Versatile Moving Average StrategyVersatile Moving Average Strategy (VMAS)
Overview:
The Versatile Moving Average Strategy (VMAS) is designed to provide traders with a flexible approach to trend-following, utilizing multiple types of moving averages. This strategy allows for customization in choosing the moving average type and length, catering to various market conditions and trading styles.
Key Features:
- Multiple Moving Average Types: Choose from SMA, EMA, SMMA (RMA), WMA, VWMA, HULL, LSMA, and ALMA to best suit your trading needs.
- Customizable Inputs: Adjust the moving average length, source of price data, and stop-loss source to fine-tune the strategy.
- Target Percent: Set the percentage difference between successive profit targets to manage your risk and rewards effectively.
- Position Management: Enable or disable long and short positions, allowing for versatility in different market conditions.
- Commission and Slippage: The strategy includes realistic commission settings to ensure accurate backtesting results.
Strategy Logic:
1. Moving Average Calculation: The selected moving average is calculated based on user-defined parameters.
2. Entry Conditions:
- A long position is entered when the entry source crosses over the moving average, if long positions are enabled.
- A short position is entered when the entry source crosses under the moving average, if short positions are enabled.
3. Stop-Loss: Positions are closed if the stop-loss source crosses the moving average in the opposite direction.
4. Profit Targets: Multiple profit targets are defined, with each target set at an incremental percentage above (for long positions) or below (for short positions) the entry price.
Default Properties:
- Account Size: $10000
- Commission: 0.01% per trade
- Risk Management: Positions are sized to risk 80% of the equity per trade, because we get very tight stoploss when position is open.
- Sample Size: Backtesting has been conducted to ensure a sufficient sample size of trades, ideally more than 100 trades.
How to Use:
1. Configure Inputs: Set your preferred moving average type, length, and other input parameters.
2. Enable Positions: Choose whether to enable long, short, or both types of positions.
3. Backtest and Analyze: Run backtests with realistic settings and analyze the results to ensure the strategy aligns with your trading goals.
4. Deploy and Monitor: Once satisfied with the backtesting results, deploy the strategy in a live environment and monitor its performance.
This strategy is suitable for traders looking to leverage moving averages in a versatile and customizable manner. Adjust the parameters to match your trading style and market conditions for optimal results.
Note: Ensure the strategy settings used for publication are the same as those described here. Always conduct thorough backtesting before deploying any strategy in a live trading environment.
Alma

ALMA/EMA/SRSI Strategy + IndicatorBack with another great high hit rate strategy!!
Disclaimer* This strategy was sampled using source code written by @ClassicScott , as referred to in the script, there is a clear line where the source code was scripted by myself.
This Strategy consists of three key factors, the ALMA, EMA crossover, and a Stochastic Rsi
ALMA: The Alma is the step line shown, turning green and red at select times. This average value gives general oversight of the macro movement of price action. and this particular one was coded by Mr.ClassicScott.
EMA crossover: At the input screen you are given an option of the fast and slow ema's. The default is solely for the hit rate and correlation to the Alma of this strategy. The arrows you see depicted on the chart are the crossover events happening.
Stochastic Rsi: The Stochastic Rsi is a stochastic value, using data sampled from the rsi. The use of this indicator in my strategy is to prevent entries when too overbought and oversold, as well as closures and vice versa, to prevent holding bags either way.
Fixed % TP: In the input screen you are given a take profit and stop loss percentage, for good R/R the hit rate will take a notch down, but with no R/R it will be near perfect.
How to use this:
Add it to your chart to get the strategy inputs. (The strategy is really only useful on a 15min TF. However the indicator within it can be used on anything at anytime!)
Watch the yellow and aqua moving averages, these are your ema's and crossover's will trigger signals based on your integer inputs.
Find Correlation between other leading indicators, as well as crossover's down/up and a red/green alma.
DO NOT use the arrows as buy/sell signals. These are simply to show ema's are crossing under or over. Momentum indicator's paired with this can be useful to determine if it could be a buy signal or sell signal.
Cheat Code's Notes:
Almost at 1000 boosts!!! I appreciate the support from everyone and I will keep trying my best to deliver quality strategies for the people.
-Cheat Code
BYBIT:BTCUSDT

Full Crypto Swing Strategy ALMA Cross with MACDThis is a full crypto swing strategy designed.
From my testing it looks like it perform the best on timeframes 4h +.
The below example has been adapted to BNB/USDT, using the entire period since 2017 until present day, with a comission of 0.03% ( which is the comission for the futures on binance).
Its components are :
ALMA Fast
ALMA Slow
MACD Histogram
Rules for entry
For long, we have a crossover of the fast alma with the slow one and the histogram is ascending.
For short, we have a crossunder of the fast alma with the slow one and the histogram is descending.
Rules for exit
We exit based on a risk management system for TP and SL, or when we receive an opposite condition than the initial one.
Regarding risk management
0.05 = 5% movement
2 = 200% movement
0.001 = 0.1% movement
If you have any questions, let me know !

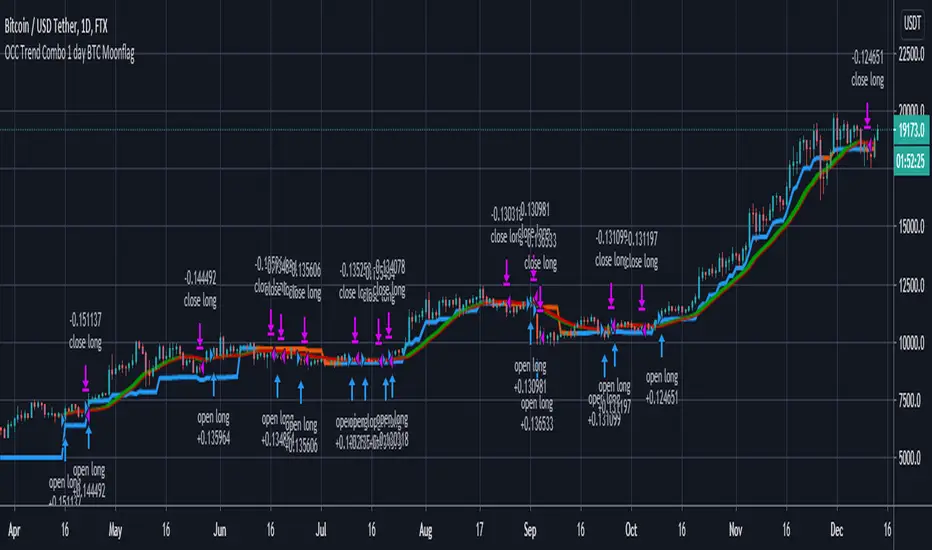
OCC Trend Combo 1 day BTC MoonflagRuns on BTC 1 DAY (NOTE USE THIS NOT THE PREVIOUS VERSION - DEFAULTS TUNED TO 1 day BTC HERE)
USE DEFAULT SETTINGS
The strategy is to maximise the profit for OCC longs (ALMA algo)
Longs start when the price action settles around the ALMA OCC, then typically breaks up
Then follow the trend indcator (blue/orange)
Shorts normally happen when the price action crosses below the ALMA OCC, although these initiate faster than the 1 day time setting - so watchout for shorts - are harder to predict than longs
So this catches most of the big move longs at their initiation
Combination Parabolic MA/IIR/ALMA Strategy, and other goodies Okay, so this is a lot. It started mostly with me combining indicators and looking for ideal entry criteria.
It is also a collection of conditions, whether used or unused, for my current chosen "best" strategy. It is currently set how I like it, but it has changed with time, and will continue to do so. Within, there are variables that are unused, but offer some insight into the overall odds of a trade. They were, in fact, once used but fell out of favor. And all details for this strategy are within the comment header of the script.
As this evolves, I most certainly wont keep any future findings and hope for profit from my peers (yinz). Also, I'd like to give a sincere thanks to the people of TV for what I learned in a few month's time and their flexible membership plans. Basically, I'm just a mad scientist, but this monster's a masterpiece and folks here before me made many indirect contributions to it.
--------------------------
Okay guys, lastly and most importantly,
Each smack of the like button is a vote of your confidence in me, to my beautiful landladies, Celeste and Adele, that my rent will be caught up and that it won't always be a problem. Which, in my mind, makes me a graph. And they've got strong hands and don't sell the low. I more than respect that. Seriously. And I'm very grateful for their willingness to work with me, but the thing is that I didn't ask first; life just happens. But few are tolerant of others. And quite importantly, I truly believe that I will be successful one day, and that "thumbs-up" button is your vote of confidence. If you're not sure, then don't hit it yet. Maybe my scripts will boost your confidence in me :)
-------------------------
PS: And you know what? I'ma give a shout-out to Philakone for teaching me everything that I know about Elliot Wave . Absolutely. Two years ago, I would keep telling myself that one day I will put something in his gratuity wallet or pursue the paid courses. And, I still plan on it, because I'm grateful. And so also, to everybody else, I'm recommending him to learn from. because as a trader who might not know everything for free, you can certainly fill in the gaps with his altruistic offerings. And I'm betting that you will then feel more than inclined to buy the Udemy course.
"If wave 2 retraces a lot; number 4 will not". Repetition. Philakone didn't fix my memory but he sure did find a workaround, haha
Okay, everyone, Thanks!

Combination Parabolic MA/IIR/ALMA Strategy, with other goodiesOkay, so this is a lot. It started mostly with me combining indicators and looking for ideal entry criteria.
It is also a collection of conditions, whether used or unused, for my current chosen "best" strategy. It is currently set how I like it, but it has changed with time, and will continue to do so. Within, there are variables that are unused, but offer some insight into the overall odds of a trade. They were, in fact, once used but fell out of favor. And all details for this strategy are within the comment header of the script.
As this evolves, I most certainly wont keep any future findings and hope for profit from my peers (yinz). Also, I'd like to give a sincere thanks to the people of TV for what I learned in a few month's time and their flexible membership plans. Basically, I'm just a mad scientist, but this monster's a masterpiece and folks here before me made many indirect contributions to it.
--------------------------
Okay guys, lastly and most importantly,
Each smack of the like button is a vote of your confidence in me, to my beautiful landladies, Celeste and Adele, that my rent will be caught up and that it won't always be a problem. Which, in my mind, makes me a graph. And they've got strong hands and don't sell the low. I more than respect that. Seriously. And I'm very grateful for their willingness to work with me, but the thing is that I didn't ask first; life just happens. But few are tolerant of others. And quite importantly, I truly believe that I will be successful one day, and that "thumbs-up" button is your vote of confidence. If you're not sure, then don't hit it yet. Maybe my scripts will boost your confidence in me :)
-------------------------
PS: And you know what? I'ma give a shout-out to Philakone for teaching me everything that I know about Elliot Wave . Absolutely. Two years ago, I would keep telling myself that one day I will put something in his gratuity wallet or pursue the paid courses. And, I still plan on it, because I'm grateful. And so also, to everybody else, I'm recommending him to learn from. because as a trader who might not know everything for free, you can certainly fill in the gaps with his altruistic offerings. And I'm betting that you will then feel more than inclined to buy the Udemy course.
"If wave 2 retraces a lot; number 4 will not". Repetition. Philakone didn't fix my memory but he sure did find a workaround, haha
Okay, everyone, Thanks!

Double EMA & ALMA StrategyThe ALMA (50 period) acts as the main trend filter, meaning that long positions are taken above the ALMA and short positions are taken below the ALMA. For instance, the 5 and 10 period exponential moving averages are added on the chart to give early signals to the trend.
Therefore, when the 5/10 EMA triggers a bullish crossover, long signals are taken when price is above the ALMA, likewise, when the 5/10 EMA triggers a bearish crossover, short signals are taken when price is below the ALMA.
Find out optimal values by trying. May not produce accurate results in horizontal markets. Thank you.

Parabolic SAR & Arnoud Legoux Moving Avarage StrategyIn the first short signal example, after price closes below the ALMA and the parabolic SAR plots above the price high, sell signal is opened with the stops trailed to the PSAR values until the trade is stopped out.
Similarly, you can see a long position where price cuts above the ALMA and the Parabolic SAR plots below the price low. Using these values as the trailing stop levels, we can stay long into the trade until the trade is stopped out.
Find out optimal values by trying. May not produce accurate results in horizontal markets. Thank you.

Kozlod - Yet Another Moving Average Cross Strategy (9 MA types)You can choose one of these MA types in params:
Simple Moving Average (SMA)
Exponential Moving Average (EMA)
Weighted Moving Average (WMA)
Arnaud Legoux Moving Average (ALMA)
Hull Moving Average (HMA)
Volume-weighted Moving Average (VWMA)
Least Square Moving Average (LSMA)
Smoothed Moving Average (SMMA)
Double Exponential Moving Average (DEMA)
Also you can select SL/PT % levels.
