MestreDoFOMO Future Projection BoxMestreDoFOMO Future Projection Box - Description & How to Use
Description
The "MestreDoFOMO Future Projection Box" is a TradingView indicator tailored for crypto traders (e.g., BTC/USDT on 1H, 4H, or 1D timeframes). It visualizes current price ranges, projects future levels, and confirms trends using semi-transparent boxes. With labeled price levels and built-in alerts, it’s a simple yet powerful tool for identifying support, resistance, and potential price targets.
How It Works
Blue Box (Current Channel): Shows the recent price range over the last 10 bars (adjustable). The top is the highest high plus an ATR buffer, and the bottom is the lowest low minus the buffer. Labels display exact levels (e.g., "Top: 114000", "Bottom: 102600").
Green Box (Future Projection): Projects the price range 10 bars ahead (adjustable) based on the trend slope of the moving average. Labels show "Proj Top" and "Proj Bottom" for future targets.
Orange Box (Moving Average): Traces a 50-period EMA (adjustable) to confirm the trend. An upward slope signals a bullish trend; a downward slope signals a bearish trend. A label shows the current MA value (e.g., "MA: 105000").
Alerts: Triggers when the price nears the projected top or bottom, helping you catch breakouts or retracements.
How to Use
Add the Indicator: Apply "MestreDoFOMO Future Projection Box" to your chart in TradingView.
Interpret the Trend: Check the orange box’s slope—upward for bullish, downward for bearish.
Identify Key Levels: Use the blue box’s top as resistance and bottom as support. On a 4H chart, if the top is 114,000, expect resistance; if the bottom is 102,600, expect support.
Plan Targets: Use the green box for future targets—top for profit-taking (e.g., 114,000), bottom for stop-loss or buying (e.g., 102,600).
Set Alerts: Enable alerts for "Near Upper Projection" or "Near Lower Projection" to get notified when the price hits key levels.
Trade Examples:
Bullish: If the price breaks above the blue box top (e.g., 114,000), buy with a target at the green box top. Set a stop-loss below the green box bottom.
Bearish: If the price rejects at the blue box top and drops below the orange MA, short with a target at the blue box bottom.
Customize: Adjust the lookback period, projection bars, ATR multiplier, and MA length in the settings to fit your trading style.
Tips
Use on 1H for short-term trades, 4H for swing trades, or 1D for long-term trends.
Combine with volume or RSI to confirm signals.
Validate levels with market structure (e.g., candlestick patterns).
Analisetecnica

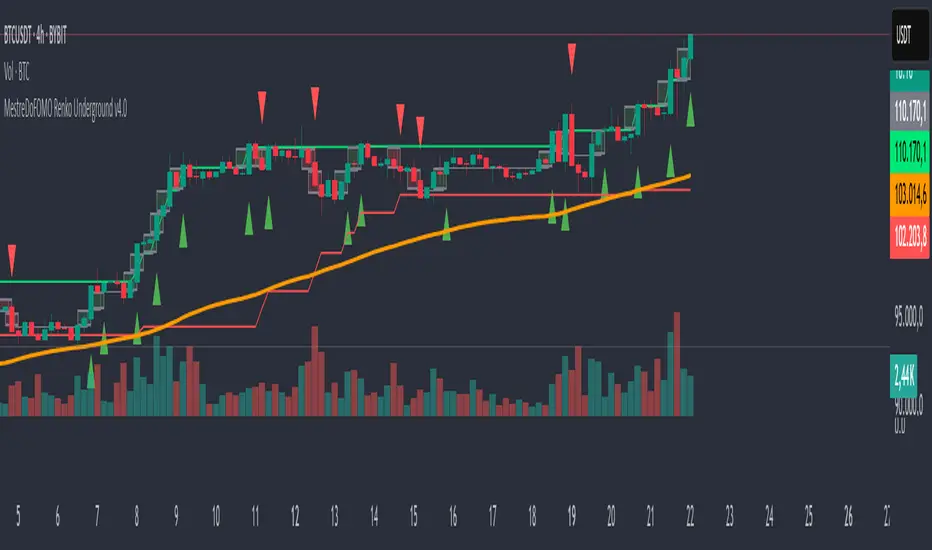
MestreDoFOMO Renko Underground v4.0Description:
The "MestreDoFOMO Renko Underground v4.0" is a custom indicator for TradingView that creates a dynamic Renko chart to help identify trends and reversal points in the market. Unlike traditional candlestick charts, Renko focuses solely on significant price movements, ignoring time and market noise. This script includes advanced features like support and resistance channels, moving averages, and alerts to assist with your trading decisions.
How It Works:
Dynamic Renko Bricks:
The brick size (price units to form each "box" on the chart) is calculated automatically using the ATR (Average True Range) with an adjustable multiplier. This means the size adapts to the asset's volatility (e.g., BTC/USDT). When the price moves up or down by the brick size, a new brick is created (green for up, red for down).
Reversal Signals:
Green triangles (🔼) appear below bars when the trend shifts to bullish, and red triangles (🔽) appear above when it shifts to bearish. These signals only appear on direction changes, reducing false signals.
Renko Channel:
The script draws two lines (green for resistance and red for support) based on the highs and lows of the last 10 bricks (or the value you set). This helps identify key price zones.
Moving Average on Bricks:
An orange line shows the moving average (EMA or SMA, your choice) of the last 20 bricks, helping confirm the overall trend.
Alerts:
You can set up alerts in TradingView to be notified when the trend shifts to bullish or bearish, perfect for active trading.
Visualization:
A gray dashed line shows the level of the last brick, providing a clear reference for the next expected move.
How to Use:
Add the indicator to your chart (e.g., BTC/USDT 1D).
Adjust parameters like the ATR multiplier, channel length, and moving average type in the settings menu.
Watch the bricks and signals to identify trends, and use the channels and moving average to plan entries and exits.
Enable alerts to receive real-time notifications.
Tip:
Test on different timeframes (1H, 4H, 1D) and adjust the ATR multiplier to match the volatility of the asset you're trading. Combine with other indicators (like RSI) for better results!