Bitcoin OnChain & Other MetricsHi all,
In these troubled times, going back to fundamentals can sometimes be a good idea 😊
I put this one up using data retrieved from “Nasdaq Data Link” and their “Blockchain.com” database.
Here is a good place to analyses some Bitcoin data “outside” its price action with 25 different data sets.
Just go to the settings menu and display the ones you are interested in.
If you want me to add more metrics, feel free to DM or comment below!
Hope you enjoy 😉
Analysis

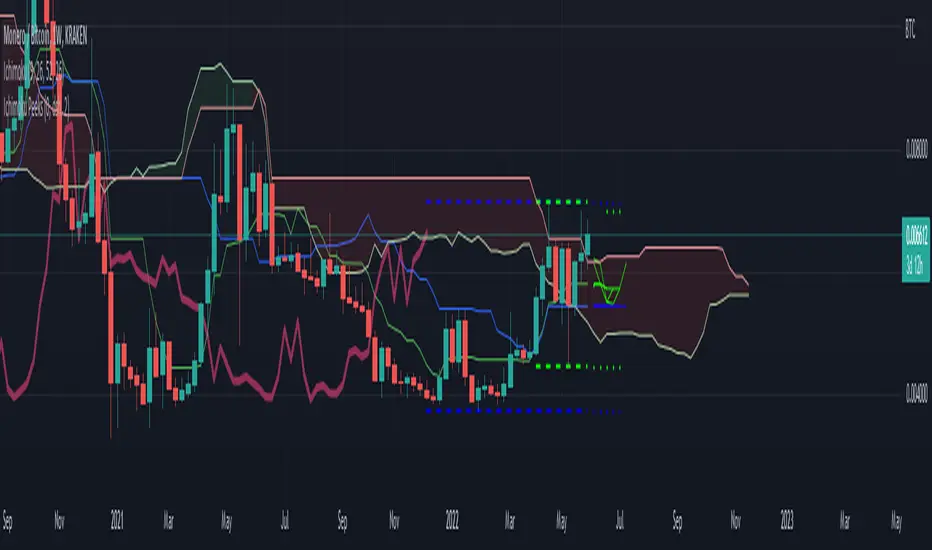
Ichimoku PeeksThis indicator uses the Ichimoku Tenkan / Kijun trend line formulas to predict what those values will be in the future if current price action does not violate the period highs and lows.
Because of the way Ichimoku formulates the trend, it contains (but does not visualize) this predictive information in a way that moving averages do not.
Sharp chart readers can infer upcoming changes by counting back candles, but the process can be automated, as I've shown here.
This description does not seem to be editable so implementation details and usage will be covered in code commentary.
MACD Scalper AnalysisThis is a scalper analysis movement designed around MACD and 200 EMA
The rules are simple:
For long we check if the close of the candle is above the ema200 and we have a crossover between macd and signal
Once this happens we analyse the next candle, if its close higher than open , we can consider it a win and if its close lower than open we consider a lose.
For short we check if the close of the candle is below the ema200 and we have a crossunder between macd and signal
Once this happens we analyse the next candle, if its close higher than open , we can consider it a loss and if its close lower than open we consider a win.
Once we have all of this we analyse the average percentage movement and establish if the specific asset or timeframe is worthy for us.
At the same time it can give a good idea if we can go with a divergence strategy, like for example we have a short entry, but we will actually go long and viceversa.
If you have any questions let me know !

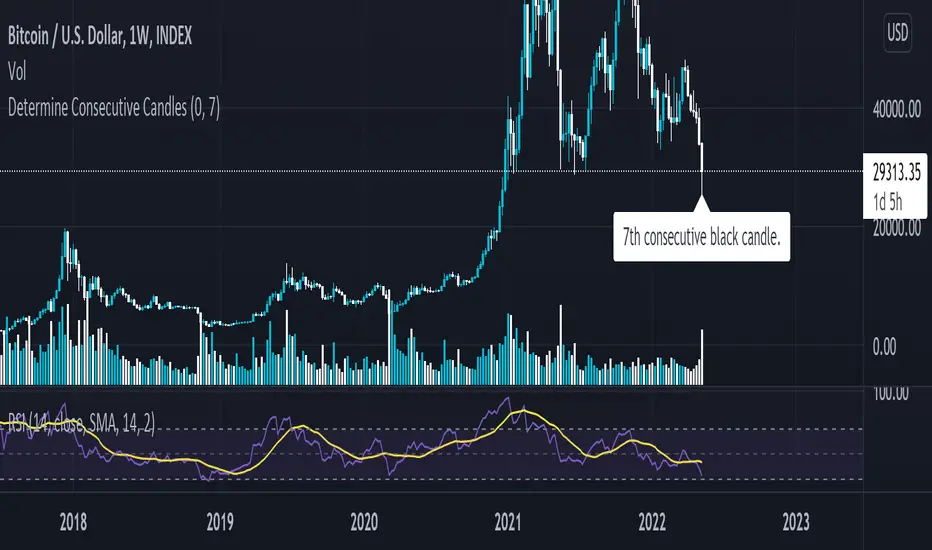
Determine Consecutive Candles█ OVERVIEW
This is a simple script that will plot labels over or under candles to show where there had been consecutive candles that closed in a similar fashion. This script was inspired by a Tweet about Bitcoin experiencing its first 7th-consecutive weekly black candle and I sought out to test that.
█ INPUTS
There are three inputs for this script.
"offset" ( integer ) - (Can be 0 or 1) Allows the user to apply this script at the currently closing candle or the most recently closed candle.
"Number of Candles" ( integer ) - (From 3 to 100*) Allows the user to select how many candles to back test for consecutive-ness.
"Black or White" ( boolean ) - Allows the user to select what kinds of candles to look for in this script. (true - Black , false - White ).
*Publishing open-sourced, this selection was arbitrary and can be modified at will.
█ USAGE
Because I had created this in a little over an hour, this is just a simple experiment that I wanted to share with others. Its applications are unknown to me, but I am interested in hearing how others may find what this script does useful.
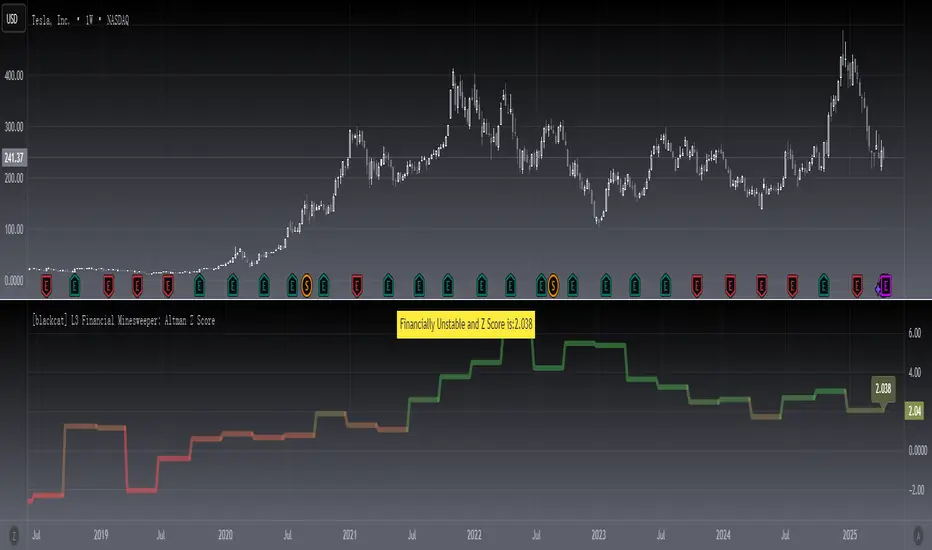
[blackcat] L3 Financial Minesweeper: Altman Z ScoreLevel: 3
Background
The Altman Z-score is the output of a credit-strength test that gauges a publicly traded manufacturing company's likelihood of bankruptcy. The Altman Z-score is a formula for determining whether a company, notably in the manufacturing space, is headed for bankruptcy.
Function
The possibility of financial failure or bankruptcy of the enterprise is analyzed and predicted through the comprehensive score. The lower the Z value, the more likely the enterprise will go bankrupt. By calculating the Z value of an enterprise for several consecutive years, we can find out whether the enterprise has signs of financial crisis. Generally speaking, when the Z value is greater than 2.675, it indicates that the financial situation of the enterprise is good, and the possibility of bankruptcy is small; When the value is less than 1.81, it indicates that the enterprise is in a potential bankruptcy crisis; when the Z value is between 1.81 and 2.675, it is called a "gray area, indicating that the financial situation of the enterprise is extremely unstable.
Remarks
STOCKs ONLY which require financial data.
X1~X5 coefficients can be customized for different stock markets.
Compared to TradingView official Altman Z-Score Indicator.
Feedbacks are appreciated.
Financial Fundamental Analysis (FFA)- Finansal Temel Analiz (TA)The main purpose of the Fundamental Analysis (TA) indicator; It is to determine whether the rising or falling movements in prices are supported by basic indicators. TA can be used in equity markets. With the financial data transferred to the platform by the companies, the development rates, intrinsic values, true values and expensiveness-cheapness situations of the stocks are estimated. In addition to technical data, it provides an impression of the long-term performance of the stock.
Growth Rate (Blue line): It is a percentage data calculated by focusing on companies' periodic net margin, operating margin and return on equity. It is expected to be higher than 0.2. It symbolizes the possibility of holding and returning cash. It is one of the indicators that the development of the company will be negative or positive in the following periods.
Earnings Per Share (Purple line): It is an important indicator of the sustainability of the company. The periodic increase is expected to be above the inflation figures.
Stock true price (Gray line): Data calculated based on the growth rate. Known book value is recalculated by reflecting the effect of growth rate on earnings per share. In a sense, revaluation is done.
Intrinsic value 1 (red line): It is determined by reevaluating the current price with the growth rate. Whether the value here is too high or too low than the stock price is related to the interest of the sector in which the stock is located.
Intrinsic value 2 (green line): The 50-day average price is determined by reassessing with the growth rate. Whether the value here is too high or too low than the stock price is related to the interest of the sector in which the stock is located.
The desired performance is to remain above 0.2, periodic earnings per share to increase above the inflation rate, and to have a regular increase graph without fluctuations in the stock true price. The fact that intrinsic value 1 crosses intrinsic value 2 is also an increase indicator and acts as an oscillator.
Sudden increases in the stock true price indicate that the stock price will increase in the coming periods. However, the current price of the stock should also be examined with technical indicators.
Temel Analiz (TA) indikatörünün temel amacı; fiyatlardaki yükseliş ya da düşüş hareketlerinin temel göstergelerle desteklenip desteklenmediğinin tespit edilmesidir. TA, hisse pay piyasalarında kullanılabilmektedir. Şirketler tarafından platforma aktarılan finansal veriler ile hisselerin gelişim oranları, içsel değerleri, gerçek ederi ve pahalılık-ucuzluk durumları tahmin edilmektedir. Teknik verilere ek olarak hissenin uzun vadede gösterdiği performansa ilişkin izlenim sunmaktadır.
Büyüme Oranı (Mavi çizgi): şirketlerin dönemsel net marjı, faaliyet marjı ve özkaynak karlılığı üzerine odaklanarak hesaplanmış yüzdesel bir veridir. 0.2’den yüksek olması beklenir. Nakit bulundurma ve döndürme imkânını simgelemektedir. Sonraki dönemlerde şirketin gelişiminin negatif ya da pozitif olacağının göstergelerinden biridir.
Hisse Başı Kazanç (Mor çizgi): Şirketin sürdürülebilirliği hakkında önemli bir göstergedir. Dönemsel artışın enflasyon rakamları üzerinde olması beklenir.
Hisse eder fiyatı (Gri çizgi): Gelişim oranına bağlı olarak hesaplanan veridir. Bilinen defter değeri, gelişim oranının hisse başı kazanç üzerine etkisi yansıtılarak tekrar hesaplanmaktadır. Bir anlamda yeniden değerleme işlemi yapılmaktadır.
İçsel değer 1 (kırmızı çizgi): Mevcut fiyatın gelişim oranı ile tekrar değerleme yöntemiyle belirlenmesidir. Buradaki değerin hisse eder fiyatından aşırı yüksek ya da aşırı düşük olması hissenin bulunduğu sektörün çektiği ilgi ile alakalıdır.
İçsel değer 2 (yeşil çizgi): 50 günlük ortalama fiyatın gelişim oranı ile tekrar değerleme yöntemiyle belirlenmesidir. Buradaki değerin hisse eder fiyatından aşırı yüksek ya da aşırı düşük olması hissenin bulunduğu sektörün çektiği ilgi ile alakalıdır.
Gelişim oranının 0.2 üzerinde kalması, dönemsel hisse başı kazancın enflasyon oranı üzerinde artış göstermesi, hisse eder fiyatın dalgalanmalar göstermeden düzenli bir artış grafiğine sahip olması istenen performanstır. İçsel değer 1‘in içsel değer 2’yi yukarı kesmesi aynı zamanda bir artış göstergesi olup osilatör görevi görmektedir.
Hisse eder fiyatındaki ani yükselişler gelecek dönemlerde hisse fiyatının da artacağını göstergesi olmaktadır. Ancak hissenin mevcut fiyatı aynı zamanda teknik göstergelerle de incelenmelidir.

Volatility Calculator for Daily Top and Bottom RangeWith the usage of ATR, applied on the close of the daily candle, I am calculated the volatility channels for the TOP and BOTTOM
Based on this logic, we can estimate, with a huge confidence factor, where the prices are going to be compressed for the trading day.
Having said that, lets take a look at the data gathered among the most important financial markets:
SPX
TOP CROSSES : 2116
BOT CROSSES : 1954
Total Daily Candles : 18908
Occurance ratio = 0.215
NDX
TOP CROSSES : 1212
BOT CROSSES : 1183
Total Daily Candles : 9386
Occurance ratio = 0.255
DIA
TOP CROSSES : 759
BOT CROSSES : 769
Total Daily Candles : 6109
Occurance ratio = 0.25
DXY
TOP CROSSES : 1597
BOT CROSSES : 1598
Total Daily Candles : 13156
Occurance ratio = 0.243
DAX
TOP CROSSES : 1878
BOT CROSSES : 1848
Total Daily Candles : 13155
Occurance ratio = 0.283
BTC USD
TOP CROSSES : 416
BOT CROSSES : 417
Total Daily Candles : 4290
Occurance ratio = 0.194
ETH USD
TOP CROSSES : 247
BOT CROSSES : 268
Total Daily Candles : 2452
Occurance ratio = 0.21
EUR USD
TOP CROSSES : 820
BOT CROSSES : 805
Total Daily Candles : 7489
Occurance ratio = 0.217
GOLD
TOP CROSSES : 1722
BOT CROSSES : 1569
Total Daily Candles : 13747
Occurance ratio = 0.239
USOIL
TOP CROSSES : 1077
BOT CROSSES : 1089
Total Daily Candles : 10231
Occurance ratio = 0.212
US 10Y
TOP CROSSES : 1302
BOT CROSSES : 1365
Total Daily Candles : 9075
Occurance ratio = 0.294
Based on this, we can assume with a very high confidence ( 70-80%) that the market is going to stay, within the range created from the BOT and TOP ATR points.

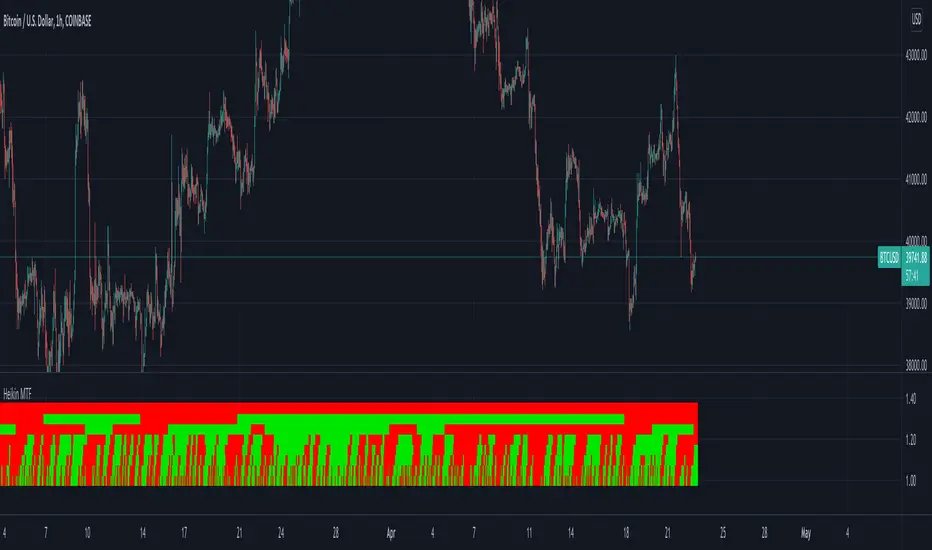
Heikin Multi Time Frame// How it Works \\
This script calculates the open and close prices of Heikin Ashi candles across multiple timeframes,
If the candle formed on that timeframe is green it will display in the table a green square, If the candle is red, the square will display red.
// Settings \\
You can change the colours of the plots
You can also Change any of the timeframes which the Heikin Ashi candles are being calculated on
// Use Case \\
Heikin Ashi candles are often used to give a smoother trend direction and help cancel out some of the noice/consolidation.
It can also be use as trend detection for multiple timeframes at once
/ / Suggestions \\
Happy for anyone to make any suggestions on changes which could improve the script,
// Terms \\
Feel free to use the script, If you do use the scrip please just tag me as I am interested to see how people are using it. Good Luck!
IsPullbackPivotRetested experimentThe indicator counts how often a pullback that starts outside the Keltner Channel resolves or fails.
Resolves: the pullback high or low is retested.
Fails: price goes outside the oppositie side of the Keltner Channel.

Key Financials A simple table with up to 9 key financials on your chart.
Simple, easy and configurable.

S&P 500 Earnings Yield SpreadThis indicator compares the attractiveness of equities relative to the risk-free rate of return, by comparing the earnings yields of S&P 500 companies to the 10Y treasury yields. "Earnings yield" refers to the net income attributable to shareholders divided by the stock's price - effectively the inverse of the PE ratio. The tangible meaning of this metric is "the annual income received by (attributable to) shareholders as a percent of the price paid to receive said income." Therefore, earnings yield is comparable to bond yields, which are "the annual income received by bond holders as a percent of the price paid to receive said income."
This indicator subtracts the earnings yield of S&P 500 companies from the current 10-year treasury bond yield, creating a "spread" between the yields that determines whether equities are currently an attractive investment relative to bonds. That is, if the S&P 500 earnings yield exceeds the 10Y treasury yield, then equity investors are receiving more attributable income per dollar paid than bondholders, which could be an indication that equities are an attractive purchase relative to the risk-free rate. The same applies vice-versa; if the 10Y treasury yield exceeds that of the S&P 500 earnings yield, then equities may not be an attractive investment relative to the risk-free rate.
Since data on S&P 500 companies' earnings yields are pulled on a monthly basis, this indicator should be used on a monthly timeframe or longer. Historical data has shown that the critical zones for the indicator are at -4% and +3%, i.e. when equities are trading with a 4% greater yield than 10Y T-bonds and when equities are trading with a 3% lower yield than 10Y T-bonds, respectively. In the "Oversold" case (-4%), equities are trading at a steep discount to the risk-free rate and has often represented a strong buying opportunity. In the "Overbought" case (+3%), equities are trading at a premium to the risk-free rate, which may be an indication that caution should be exercised within the stock market. When the indicator first crosses into "Oversold" territory, this has historically been near a the bottom of a crash on the S&P 500. When the indicator first crosses into the "Overbought" territory, this has often precipitated a correction of 15% on the S&P 500.
Some notable "misses," crashes that this indicator missed, include the 1973 stock market crash and the 2008 global recession. However, both of these cases were largely precipitated by unprecedented economic events, as opposed to stocks simply being "Overbought" relative to treasury yields. Nonetheless, this indicator should form only a small portion of your fundamental analysis, as there are many macroeconomic factors that could lead to major corrections besides the impact of treasury yields. Furthermore, it should also be noted that since markets are "forward looking," future earnings growth or interest rate hikes may become "priced into" both the stock and bond markets, affecting the outputs of this indicator. However, since both the stock and bond markets should account for these factors simultaneously, the impact has historically been minimized.
I hope you find this indicator to be beneficial to your strategies. Stay safe, and happy trading.

Accumulation/Distribution Bands & Signals (BTC, 1D, BITSTAMP) This is an accumulation/distribution indicator for BTC/USD (D) based on variations of 1400D and 120D moving averages and logarithmic regression. Yellow plot signals Long Term Accumulation, which is based on 1400D (200W) ALMA, orange plot signals Mid Term Accumulation and is based on 120D ALMA, and finally the red plot signals Long Term Distribution that's based on log regression. It should be noted that for red plot to work BTC 1D BITSTAMP graph must be used, because the function of the logarithmic regression was modified according to the x axis of the BITSTAMP data.
Signal bands have different coefficients; long term accumulation (yellow) and and the log regression (red) plots have the highest coefficients and mid term accumulation (orange) has the lowest coefficients. Coefficients are 6x, 3x and 1.5x for the red (sell) and yellow (buy) plots and 1x, 2x and 3x for the orange (buy) plot. Selling coefficient for the yellow and the orange plots are respectively 2x and 1x. Buy and sell signals are summed up accordingly and plotted at the top of the highest band.
Acknowledgement: Credits for the logarithmic regression function are due @memotyka9009 and Benjamin Cowen

Bitcoin Movement vs. Coin's Movement MTFThis script tracks the percent change of Bitcoin vs. the percent change of the coin on the chart. Crypto markets are usually affected greatly by Bitcoin swings so being able to see if the given coin is trending above or below Bitcoin is useful market data. All choices made with this script are your own! Thanks.

Financials Index ComboFinancials Index Combo includes 2 languages Vietnamese and English:
Note the abbreviations:
Rev: Total revenue (Diluted EPS)
Gross: Gross profit
OI: Operating Income
C: Deferred Income, Current
N: Deferred Income, Non-Current
INV: Total inventories (Inventory turnover)
TAS: Total assets (Asset turnover)
Ev/Ed: Enterprise value to EBITDA ratio
ROIC: Return on invested capital
ROA: Return on assets
ROE: Return on equity
TA: Return on tangible assets
TE: Return on tangible equity
G: Sustainable growth rate
FCO: Cash From Operating Activities
FCF: Free Cash Flow
D: Debt to equity ratio
L: Long term debt to total assets ratio
E: Debt to EBITDA ratio
M: Current ratio
S: Sloan ratio -10 -> 10 --> safe zone
H: Fulmer H <0 --> struggling with its finances
>0 --> stable condition
F_score: Piotroski F-score 0 - 9
TCA: Total Current Assets
Rev/TCA: Total revenue to Total Current Assets ratio
Graham: Graham's number
NCAVPS: Net current asset value per share
Convert to billions:
Real Time Table:
Quarterly or annual financial statements
Financials Index For Bank:

Financial Intelligent Eval [Fundamental] (MYTRIC)█ OVERVIEW
Financial Algorithm is a system to quickly understanding company fundamental, and judge the company type based on their financial condition.
All evaluation from the system is the result of combination with Balancing Calculation and Company Historical Financial Data(Financial Report) by using over than 30 financial ratios.
This indicator are classified into 5 level (Very Weak, Weak, Moderate, Good, Excellent)
Advantages of Financial Algorithm
• By combining and calculating company's latest 4 quarterly report, provide rating to help investor quickly know about company's fundamentals and financial performance.
• Able to identify company have what kind of strength, weakness, chance and threat. For instance, according to current economic situation, is it an advantages or a threat for a company, investor can identify it via Financial Algorithm.
• Able to identify which company have better business management by keep following the company rating, observe the improvement level of company's.
Application
*When notice there are not improvement on a company's fundamentals or financial performance which is profitable without further developing, it usually reveals the lack of management capability to generate more value, company unable to fully utilise its profit, reinvest and expanding its business to become more competitive. Sometimes this kind of company may be suspected accounting fraud.
█ BENEFITS
• Avoid investing in companies suspected of financial fraud.
• To quickly understanding company's fundamental and financial structure.
• Able to analyze whether the company build profit after it is used to optimize the company's internal
█ FEATURES
You can configure the following attributes of the display:
• Table position on your chart.
• The size and colour of text.
• Language between English and Chinese.
• Rating bar chart colour.
• On / Off Statement Review Helper Function
• On / Off 3 Years Evaluation Function
• On / Off Basic Information
• Full descriptions of each evaluation and content are included in the settings
█ LIMITATIONS
• When changing the indicator's inputs, allow around 20 seconds calculation for the change to be reflected in the display.
• This system only able to evaluate non-financial industry.
• This system is based on company's historical financial report data to generate the results and rating, it does not includes prediction from any external factor.
(External Factor: Business Model, Business Distribution & Geography, Corporate Structure, Competitor and Peer company's, Prospect, Costing Breakdown, Disaster and etc)
• Any results calculated by this system all is based on data provided by Tradingview, Data may have some tolerance, we recommend that users pay attention to the official quarterly/annual report.
█ FINANCIALS INTELLIGENT ALGORITHM FUNCTION
This lists all combination calculate financials.
01. Total Revenue
02. Earnings before interest and tax
03. Net Income
04. Property, Plant, and Equipment
05. Total Receivables
06. Cash and short-term Investments
07. Cash & Cash equivalents
08. Total Liability
09. Working Capital
10. Total Debt
11. Total Equity
12. Retained Earnings
13. Total Asset
14. Cash From Operating Activities
15. Income before extraordinary items
16. Total depreciation and amortization
17. Free Cash Flow
18. Altman Z-score
19. Cash to Debt Ratio
20. Current Ratio
21. Debt to Assets Ratio
22. Debt to Equity ratio
23. EBITDA Margin
24. Free Cash Flow Margin
25. Grahams Number
26. Net Margin
27. Price Book Ratio
28. Piotroski-F Score
29. Quick Ratio
30. Return on Assets
31. Return on Equity
32. Return on Invested Capital
33. Float Shares Outstanding
34. Total Common Shares Outstanding
35. Cash to Revenue
36. Cash to Market Capital
37. Cash to Debt
38. Receivable Turnover
39. Quality of Earning
40. Market Capital
8 financial evaluation :
3 years financial evaluation tracking :
Statement Review Helper :
█ HOW TO MAKE THE RIGHT INVESMENT OR TREND TRADING DECISION BASED ON OUR EVALUATION
Avoid mid/long term invest in companies with poor financial evaluation, only suite for trend trading. The below following assessments need to be focused.
• Comprehensive rating is poor or below.
• Quality of Earning is very poor or below.
• Receivability is very poor or below (Total Receivable is too high)
• Before : Poor Financial Strength with revenue growth
• After : The price dropped by about -80% within 2 months
███████████████████████████████████████████████████████████████████████████████████████████
• Before : Poor Financial Strength with revenue growth
• After : The price dropped by about -90% within 1 year
███████████████████████████████████████████████████████████████████████████████████████████
• Before : Excellent Financial Strength
• After : Steady growth
Steady growth
• Conclusion :
Do not judge it as a good company just because it has continuous income.
When we analyze the company's financial report, we should not only look at the company's revenue,
we should pay more attention to the company's finances and weaknesses.
Only companies with strong financial strength that can expand their business in a stable manner.
Disclaimer :
*The following conclusion are purely based on my personal opinions and views, it’s only for study and research, without any trading and investment advice.

Key Financials on ChartA simple table with a couple of key financials
The metrics are (top to bottom and left to right):
- Market cap
- P/S-ratio and forward P/S-ratio
- P/E-ratio and P/FCF-ratio
- Debt/Equity and Assets/Equity ratios
- Price/Book-ratio and Operating Margin
- Pietrosky F-Score and current Dividend Yield
should be enough to get a first idea about fundamentals of growth or value-stocks...

TradingGroundhog - Fundamental Analysis - Multiple RSI Ema(Script Available Version of my previous Fundamental Analysis - Multiple RSI Ema )
As the number of crypto currencies is expanding, we need to find the one which will boom in the next months, weeks or even days.
Therefore, I present to you a Fundamental Analysis tool based on RSI built in order to compare the RSI between the diverse cryptocurrencies.
When cryptocurrencies start to trend, become active, minable and especially "buyable", people are investing their money into them.
As a result,the Daily RSI rises and the price of the crypto in question increases steadily.
With "Fundamental Analysis - Multiple RSI EMA" you can :
Follow up to 20 RSI from different exchanges at the same time.
Find easily Increasing/Decreasing RSI as the lines get transparent if their RSI decrease.
You can also select market with high potential of booming as :
Booming Market : 60 < Daily RSI <= 100 (Strong green background)
Potent Market : 55 < Daily RSI <= 60 (Light green background)
Sleepy Market : 50 < Daily RSI <= 55 (Light red background)
Dying Market : 0 < Daily RSI <= 50 (Strong red background)
Futur booming crypto will go from the Potent Market to the Booming Market
Can be used with the following time frames depending on the necessity:
4H
Daily (Preferred)
Weekly
Monthly
Good trades !
Disclaimer (As it should always be one to any script)
***
This script is intended for and only to be used for personal purposes only. No such information provided by it constitutes advice or a recommendation for any investment or trading strategy for any specific person. There is no guarantee presented or implied as to the accuracy of specific forecasts, projections, or predictive statements offered by the script. Users of the script agree that its original developer does not take responsibility for any of your investment decisions. Please seek professional advice before trading.
***

Fibonacci Moving AverageThe Fibonacci Moving Average is a powerful indicator that takes into account many underlying moving averages to give out an approximate short-term/long-term view of the markets. Its strength lies with dynamic support and resistance levels. I have created this indicator in order to improve trend-following entry positions.

Fundamental Analysis - Multiple RSI EMAAs the number of crypto currencies is expanding, we need to find the one which will boom in the next months, weeks or even days.
Therefore, I present to you a Fundamental Analysis tool based on RSI built in order to compare the RSI between the diverse cryptocurrencies.
When cryptocurrencies start to trend, become active, minable and especially "buyable", people are investing their money into them.
As a result,the Daily RSI rises and the price of the crypto in question increases steadily.
With "Fundamental Analysis - Multiple RSI EMA" you can :
Follow up to 20 RSI from different exchanges at the same time.
Find easily Increasing/Decreasing RSI as the lines get transparent if their RSI decrease.
You can also select market with high potential of booming as :
Booming Market : 60 < Daily RSI <= 100 (Strong green background)
Potent Market : 55 < Daily RSI <= 60 (Light green background)
Sleepy Market : 50 < Daily RSI <= 55 (Light red background)
Dying Market : 0 < Daily RSI <= 50 (Strong red background)
Futur booming crypto will go from the Potent Market to the Booming Market
Can be used with the following time frames depending on the necessity:
4H
Daily (Preferred)
Weekly
Monthly
Good trades !
Disclaimer (As it should always be one to any script)
***
This script is intended for and only to be used for personal purposes only. No such information provided by it constitutes advice or a recommendation for any investment or trading strategy for any specific person. There is no guarantee presented or implied as to the accuracy of specific forecasts, projections, or predictive statements offered by the script. Users of the script agree that its original developer does not take responsibility for any of your investment decisions. Please seek professional advice before trading.
***

© AlpHay : SECURITY FUNDAMENTAL TABLE// Equity Fundamental Data Report Table:
// Data Provider: Tradingview
// I am not a financial advisor or expert.
// This is my interpretation of this data. Consider this data doesn't represent the whole picture of what is going on!
// If you find some fundamentally wrong thinking about this approach, please inform me.
// I am open to suggestions. I am also looking for answers.
// Use it with a daily timeframe for data consistency.
// You can change or customize the threshold values whatever you want.
// www.tradingview.com

Pivot TrackerThis script finds swing lows and swing highs based on input criteria for lookback and lookforward periods, and plots letters accordingly.
Helps identify trend or lacktherof
HH = higher high
LH = lower high
HL = higher low
LL = lower low

Multi timeframe Stochastic RSI Screener by noop42Here is a custom x4 timeframes Stochastic RSI screener to add on your charts.
Options
Repaint mode : if enabled: values are updated in live, if disabled: values are updated once the concerned candle is closed
Default parameters
Timeframes: 1, 5, 15, 60
Repaint mode: enabled
Notes
Use the lowest timeframe configured on the screener to get real values
A classic x3 multi-timeframe Stochastic RSI indicator is also available

Volume Pressure AnalysisVolume Pressure Analysis is a new concept I have been working on designed to show the effort required to move price. An ideal tool for confirming trends or locating reversals early. This indicator can highlight whale action and market manipulation. It calculates volume vs volatility and displays the results as a meter:
Above 0 shows how easy price action is traveling, the bigger these bars the less volume and effort is required to push price. These are indicated with a teal or red arrows and can confirm the beginning or continuation of a trend. This is the natural direction the chart wants to travel at that time.
Below 0 shows how hard price is to move. The bigger these bars the more volume and effort is required to push price. When whales and market makers push price against its will these bars will get bigger.
Yellow arrows signal pressure in that direction and excessive amounts of volume is required to move price. These signals can lead to reversal/ pivot points as price action struggles to continue its trend. These signals can be turned on in settings or use the overlay version of this script to display signals on chart. This is a very powerful tool when used with relative volume.
