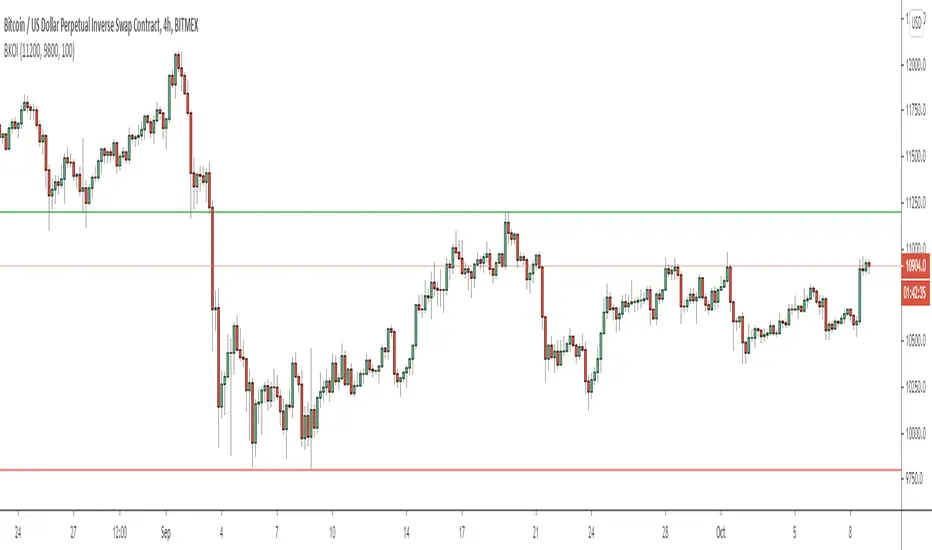
First Week Trend [MX]I created this indicator based on one of my ways of analyzing the BTC trend in particular, I noticed that the break of the first weekly candle usually indicates the trend for the rest of the month.
This indicator has a bug in which if you change the timeframe of the indicator it will show erroneous values
If you use the candlestick chart, you will need to pull the visual order of this indicator to the top to overlay the colors of the standard candles, or simply hide the standard candles
the trend colors are bugged in timeframes other than the weekly
special thanks to @xdecow who helped me with the code
////////////////////////////////////////////////////////////////////////
Eu criei esse indicador baseado em uma das minhas formas de analisar a tendência do BTC em específico, eu notei que o rompimento do primeiro candle do semanal costuma indicar a tendência para o resto do mês.
Esse script tem um bug em que se mudar o timeframe do indicador ele irá mostrar valores errados
Se você usa o gráfico de candlesticks, você precisará puxar para o topo a ordem visual desse indicador para sobrepor as cores do candles padrões, ou simplesmente ocultar os candles padrões
as cores da tendencia estão bugados em outros timeframes diferentes do semanal
agradecimentos especiais ao @xdecow que me ajudou no código
AND

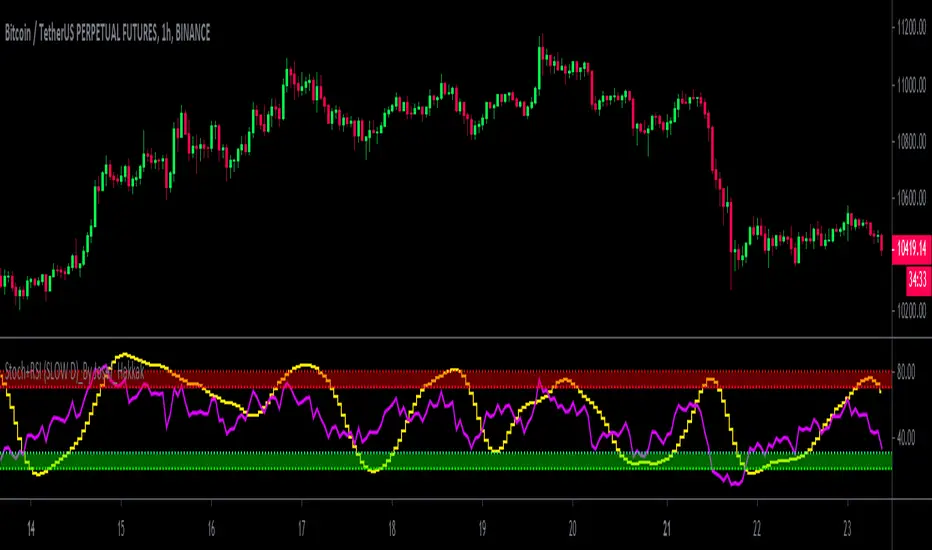
Stoch+RSI (SLOW D)_By Josef_HakkakStoch+RSI (SLOW D)_By Josef_Hakkak
Stochastic and RSI by SLOW D%
-> How to use:
B UY = When the yellow line (D of Slow Stoch ) goes out of the green range, it is better that the purple line ( RSI ) is be low
SELL = When the yellow line (D of Slow Stoch ) goes out of the red range, it is better to have the purple line ( RSI ) is be high
This script was previously written by RRanjanFX and has now been edited by me and changes have been made to optimize for shorter timeframes.
Edited and updated and optimized from:
RRanjanFX
Many thanks and loyal to RRanjanFX
Bitfinex Sentiment Index [Long-Short]BSI provides two attractive graphs that breakdown the long (green area) and short (red area) positions ratio for the all Bitfinex margin cryptocurrency pairs only .
It is a quantitative measure of the bullishness or bearishness that can be used as a trading rule or in a trading system entries or exits. Included slow stochastic oscillator.

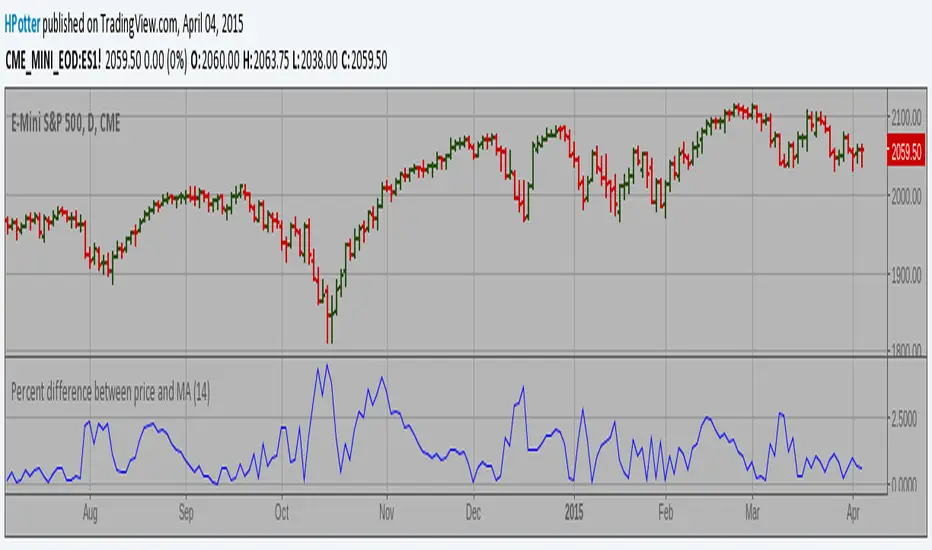
Breakout IndicatorThis script allows you to set breakout alerts.
An alert will be triggered only when price breaks and closes beyond the specified prices. You will get an alert on the first candle that closes beyond the levels you set.