The Samurai by MonedaFX (Beta)🥷🟪 The Samurai By MonedaFX
"The Samurai By MonedaFX" indicator a cutting-edge trading strategy designed to help traders identify precise trades within the markets. Developed exclusively for Moneda Lifestyle LTD, this indicator offers clear entry and exit logic along with stop-loss (SL) and take-profit (TP) templates, enabling traders to practice trading effectively and simplify their trading plan.
🔑 Key Features:
- Trade Generation: Accurately identifies and plots potential buy and sell opportunities following the pre-determined strategy.
- Risk Management: Automatically calculates and displays the stop-loss levels for each trade following the pre-determined strategy.
- Visual Aids: Incorporates graphical buy/sell plots for clear visualisation of every trade.
🌐 Visit us at: monedafx.com
---
How to Use the The Samurai By MonedaFX
1️⃣ 📖 Add the Indicator to Your Chart:
- Open your TradingView chart.
- Click on "Indicators" at the top of the screen.
- Search for "The Samurai By MonedaFX" and add it to your chart.
2️⃣ ⚙️ Select the correct timeframe & pair:
- Choose the 5 minute timeframe.
- Select one of the approved pairs.
3️⃣ 🚦 Follow the strategy:
- Be active inside the MonedaFX Discord Community.
- Watch the full video course on how to use this strategy to it's maximum potential!
---
❗ Important Information ❗
# The Samurai By MonedaFX
📲 Contact Information
- Email: info@monedafx.com
- Phone: +44 7367 106550
- Website: monedafx.com
Asiansession

ICT Asian & London Range + First Presented FVGIndicator: ICT Sessions + First Presented FVG
What it does: This tool automates the markup of key ICT (Inner Circle Trader) timeframes and entry signals. It allows you to trade on higher timeframes (like the 5m or 15m) while the script automatically "looks inside" the 1-minute chart to find specific setups for you.
Key Features:
Session Ranges (Asian & London)
Automatically highlights the Asian Session (8 PM - Midnight NY) and London Open (2 AM - 5 AM NY).
Draws a shaded box for the session's High and Low.
New: Extends the High and Low lines to 4:00 PM NY (end of the trading day) so you can use them as liquidity targets.
The "First Presented" FVG (Sniper Logic)
It detects the very first Fair Value Gap (FVG) that forms on the 1-minute chart immediately after a session starts.
It draws this 1-minute gap on your current chart, regardless of what timeframe you are viewing.
The FVG box automatically extends to the end of the trading day (4 PM NY), showing you where price might return to "mitigate" or react later in the day.

Market SessionsMarket Sessions (Asian, London, NY, Pacific)
Summary
This indicator plots the main global market sessions (Asian, European, American, Pacific) as boxes on your chart, complete with dynamic high/low tracking.
It's an essential tool for intraday traders to track session-based volatility patterns and visualize key support/resistance levels (like the Asian Range) that often define price action for the rest of the day.
Who it’s for
Intraday traders, scalpers, and day traders who need to visualize market hours and session-based ranges. If your strategy depends on the London open, the New York close, or the Asian range, this script will map it out for you.
What it shows
Customizable Session Boxes: Four fully configurable boxes for the Asian, European (London), American (New York), and Pacific (Sydney) sessions.
Session High & Low: The script tracks and boxes the highest high and lowest low of each session, dynamically updating as the session progresses.
Session Labels: Clear labels (e.g., "AS", "EU") mark each session, anchored to the start time.
Key Features
Powerful Timezone Control: This is the core feature.
Use Exchange Timezone (Default): Simply enter session times (e.g., 8:00 for London) relative to the exchange's timezone (e.g., "NASDAQ" or "BINANCE").
Use UTC Offset: Uncheck the box and enter a UTC offset (e.g., +3 or -5). Now, all session times you enter are relative to that specific UTC offset. This gives you full control regardless of the chart you're on.
Fully Customizable: Toggle any session on/off.
Style Control: Change the fill color, border color, transparency, border width, and line style (Solid, Dashed, Dotted) for each session individually.
Smart Labels: Labels stay anchored to the start of the session (no "sliding") and float just above the session high.
Why this helps
Track Volatility & Market Behavior: Visually identify the "personality" of each session. Some sessions might consistently produce powerful pumps or dumps, while others are prone to sideways "chop" or accumulation. This indicator helps you see these repeating patterns.
Find Key Support/Resistance Levels: The High and Low of a session (e.g., the Asian Range) often become critical support and resistance levels for the next session (e.g., London). This script makes it easy to spot these "session-to-session" S/R flips and reactions.
Aid Statistical Analysis: The script provides the core visual data for your statistical research. You can easily track how often the London session breaks the Asian high, or which session is most likely to reverse the trend, helping you build a robust trading plan.
Context is King: Instantly see which market is active, which are overlapping (like the high-volume London-NY overlap), and which have closed.
Quick setup
Go to Timezone Settings.
Decide how you want to enter times:
Easy (Default): Leave Use Exchange Timezone checked. Enter session times based on the chart's native exchange (e.g., for BTC/USDT on Binance, use UTC+0 times).
Manual (Pro): Uncheck Use Exchange Timezone. Enter your UTC Offset (e.g., +2 for Berlin). Now, enter all session times as they appear on the clock in Berlin.
Go to each session tab (Asian, European...) to enable/disable it and set the correct start/end hours and minutes.
Style the colors to match your chart theme.
Disclaimer
For educational/informational purposes only; not financial advice. Trading involves risk—manage it responsibly.

Vault FX Time + Price Indicator v1Collection of tools for analysis:
- Midnight Open Horizontal Price Line
- 09:30 Open Horizontal Price Line
- Midnight and 09:30 Vertical Price Lines
- NWOG painter
- Asia Range Box
- Asia Range H/L lines (Lines extend until purged or 10:00 AM NY, whichever occurs first)
- Asia Range Standard Deviation Levels (Customizable)
- Day Separators
- PDH/PDL | PWH/PWL | PMH/PML Lines w/ Alerts
- First Presented FVG for NY-AM Session (1min Chart)
- Timeframe Specific Swing High/Low Sweeps w/ Alerts (Requires user setup)
Some features are still being tested, let me know if you find any bugs!

ICT Session High/Low LevelsThis indicator automatically plots the Highs and Lows of completed sessions and draws lines for the Asian session and London session. Levels are displayed only after each session has closed. A simple tool for liquidity work and intraday context (SMC/ICT).

Session Breakout/Sweep with alertsThis indicator is based on popular London breakout strategy. but as I noticed that it don't work good with breakouts so I made it to be used as reversal entries as well. By default the timing is set for asian session but you can change it according to your need.
Use as breakout
Use as liquidity sweep
Note:
On some pairs the timing changes automatically (I don't know why), if you face this issue , go to settings and set the timing accordingly and save it as templet so that you don't have to change it every time you load the chart with timing issue.
I hope you guys find it useful. Do share your though and feedback in comments.

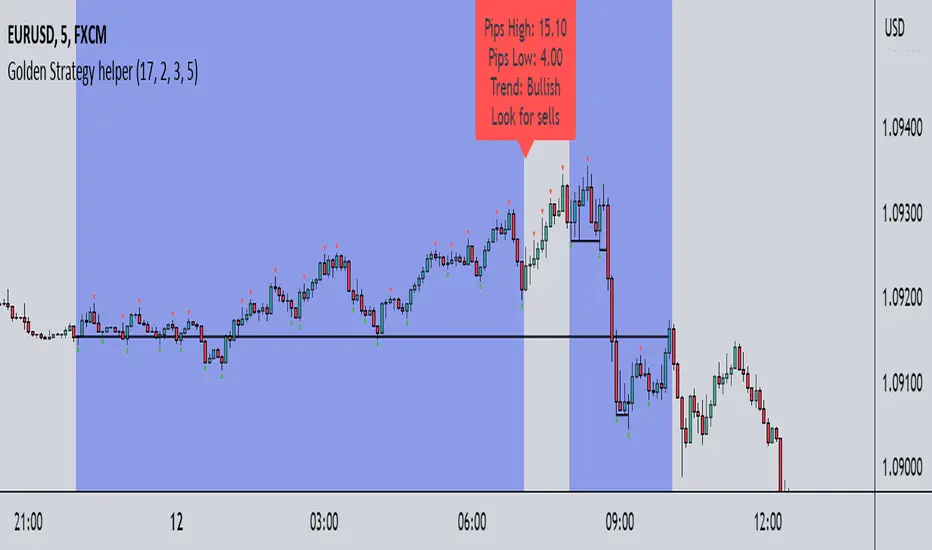
Golden Strategy helperIndicator that was made to be used in BilzSMC Golden Strategy.
It Includes:
-Asian and Trading Sessions
-Label with Asian Trend and what direction you should follow in the trading session
-Line representing the Open price of Asian Session
-Identification of Swing Points
-Identification of Breaks of Structures ( ONLY in the trading direction) and custom alerts when this happens
-Custom inputs for you to adapt the indicator to your liking
If you find any bug or have any suggestion feel free to comment or message me directly.
Happy Trading!
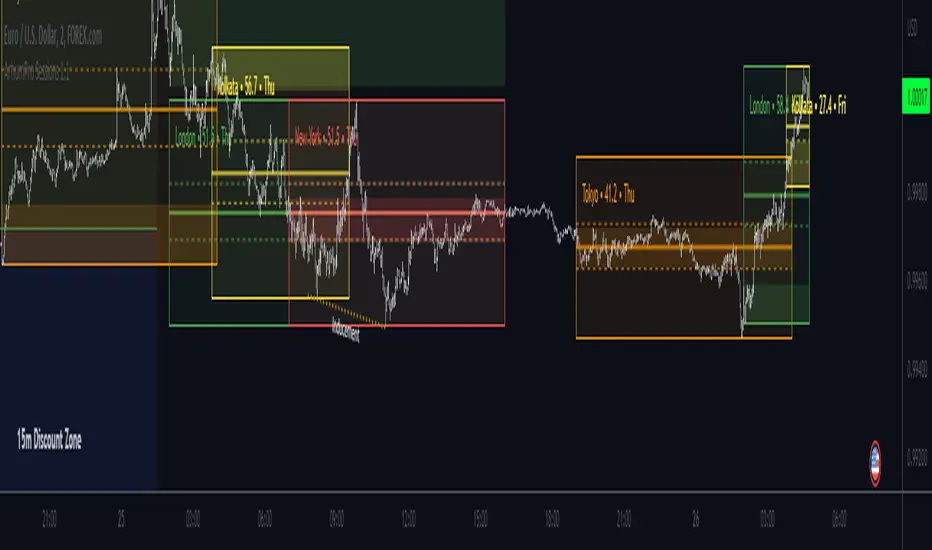
Trading Sessions [ArtiumPro]ArtiumPro Sessions is packed with tons of features and alerts to help you with your trading. It is public so enjoy it!
- History - Yes or No, No will show the most current session only.
- Pre-Sessions Range with Opening Range Breakout Alerts
- Pre-Sessions Range Can Be Listed From 15 minutes To 4 hours
- Sessions Line Style - Solid, Dash, or Dots
- Sessions Box - Default 1 Can Be Increased
- Sessions Closed Icon - Yes or No, No will show an icon on all previous sessions not active
- Pip Session Ranges
- Lookback (minutes) will color code opening range settings which you can also use for testing previous sessions ranges to help with strategies
Sessions Alerts
- Sessions Start/End
- Opening Range Breakouts
- Price Crossed Session's High/Low After Session Closed
Time Zones Supported:
- America/Los_Angeles - America/New_York - America/El_Salvador - America/Chicago - America/Argentina/Buenos_Aires
- Europe/London - Europe/Berlin - Europe/Moscow
- Asia/Dubai - Asia/Bangkok - Asia/Hong_Kong - Asia_Tokyo
- Australia/Bribane - Austalia/Sydney
- India/Kolkota
New York Session
London Sessions
Asian Sessions
Indian Sessions
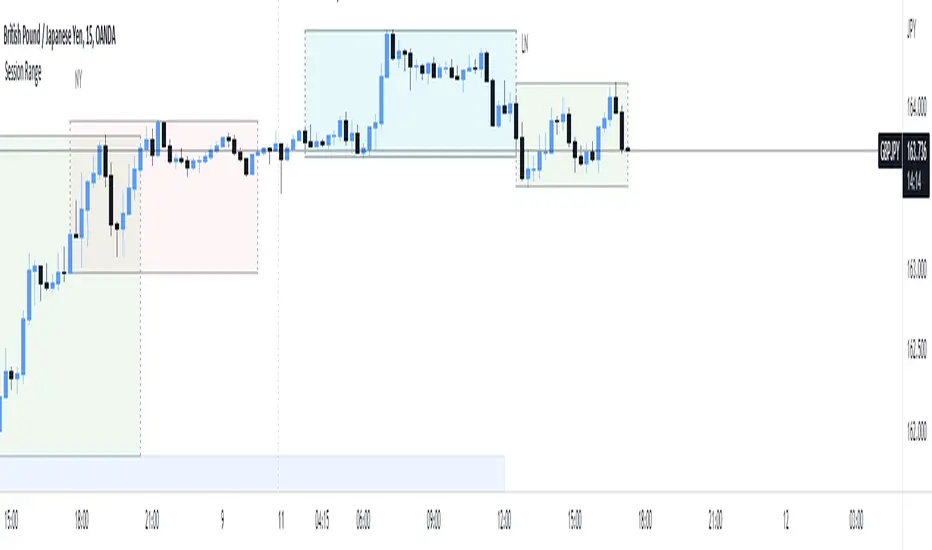
Session High Low
This indicator shows Session High Low line and prices.
1: Session range is adjustable based on your timeframe. Nomore confusing timezone settings.
You can choose your timezone then set your Session start and end time.
Script will show you the following session high and low lines which is extendable until next session.
2: All historical lines and price levels are can be partially or fully hidden.
And line colors are adjustable so you can use suitable color on your chart.
Based on session you choose this script can be used as a session break strategy AKA (Asian session break, London session break strategy).
You can create your own trading Session and high lows.
Personally I monitor how price reacts on London session high lows during the NewYork trading session.
In this chart Session starts at 8am (London open) and closes at 12:30 (NewYork open). Script is showing high lows only in this session range.
Always double confirm with your trading style. It's not a Financial advice.
Inputs:
1: Hide history - Hides all historical lines and prices that means you can see only todays session.
2: Show price - Shows price level of session high lows. You can hide price level if you want to see only lines.
3: Session time - You can set your time range of session.
4: Start time - Session start time. You can see vertical line on your chart or you can hide line.
5: End time - Session end time. You can see vertical line on your chart or you can hide line.
6: Line extend time - End of the high low lines. You can draw line until the end of the session or you can draw short line.
7: All line and price colors are optional.
Thank you.

Fx Session RangeHello traders ,as you know the session timing plays a major role in trade execution.
I was searching for a good session indicator for a very long time but I was not satisfied with the indicators which are already available on Trading view. So I decided to code one my self.
This indicator is based on the timing provided by the website www.forex.timezoneconverter.com and time is set according to Ney York time zone.
I have added almost all major sessions including (Sydney , Tokyo and Frankfurt) and almost all features which I could.
I hope you guys 👍this indicator .
Incase you notice any bug or want any features added, let me know in comment section or you can Dm me as well.
Thank you all , enjoy :D
Futures Exchange SessionsIn the 24-hour trading of the futures market, this indicator provides the user with full customization concerning the most important factor: time. This indicator is centered around three main visualizations: labels, backgrounds, and lines that minimalistically allows the user to keep track of the many time intervals that occur during a futures market 24-hour trading cycle. It also artfully displays the previous days highs and lows. And everything can be individually toggled and configured so the user can get exactly what they want.
Labels
There are three main futures market sessions in a 24-hour period: the London, New York, and Asian Sessions. Each session is given an independent label for the open and close times. The six labels (LO, LC, NYO, NYC, AO, AC) can be individually toggled on or off, the label background color changed, the text switched between black or white, and the height can be lowered or raised. These customizations are intended to give the user full control of the session they are interested in at the moment.
Backgrounds
Backgrounds are the heart of this indicator. There are different colored transparent backgrounds for each of the futures sessions. So the user can clearly see the session they want to highlight without cluttering their chart and getting in the way of analyzing the candles.
If you are familiar with the London and New York killzones, these backgrounds are each individually configured.
If you are familiar with the Inner Circle Trader’s (ICT) NY Morning and Afternoon sessions, these are available. Also, most times weird price action occurs during the lunch hour of these sessions. The London and New York have a background for their respective lunch hours so the user is never caught of guard during these periods.
Lines
The markets are constantly looking for liquidity. To help the user see runs on liquidity, this indicator projects the previous days highs and lows on to the current day with a line and a price label. The line make it very easy to see where price may be headed. See the image below for the perfect example of this phenomenon. Each of the lines can be independently controlled by color, style, and width. And even the labels can be toggled on or off if the user would prefer just to see the lines. Lastly, there is a line that marks the midnight open price in EST.
Special Notes
This indicator is specifically designed for futures tickers.
All of the backgrounds are not designed to be turned on a once (there are many that overlap). They are designed to give the user ultimate control over exactly what timeframe backgrounds to display on their charts.
The labels only appear when timeframe is 1 hour or less.

Asian Session Bollinger BandsThis is a fairly simple adjustment of the Bollinger Bands highlighting and giving the character to the Asian session.

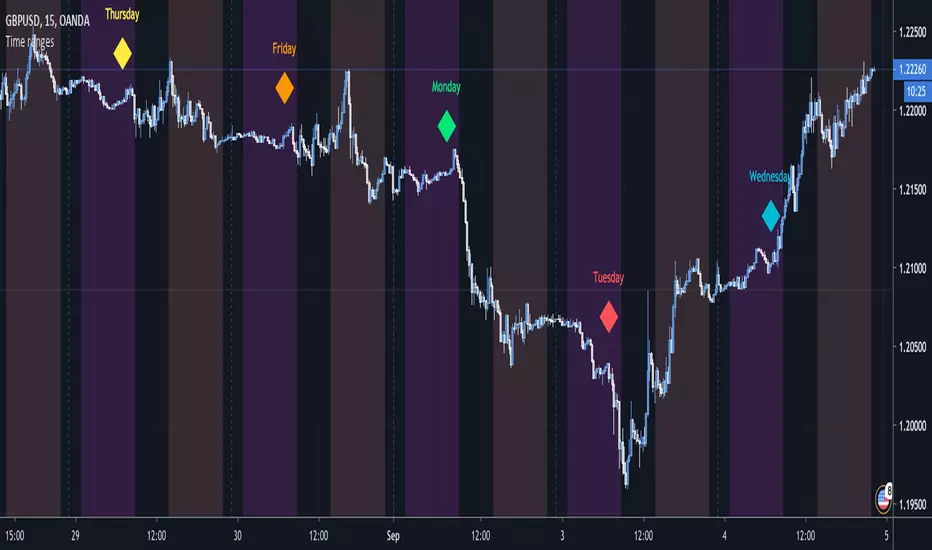
Time rangesThis script visualizes the different time sessions during the day.
The time ranges are set to the default Frankfurt, London, NY, Sydney and Tokyo, but can be
freely modified and turned off (I personally use to display only Tokyo and NY).
If you are a day trader, e.g. you trade with the Market Makers, this tool is a "must have".
It also displays the day of the week, which can be set off as well.
vitelot/yanez/Vts Sept 2019
PS I chose this script to belong to the "volatility" category since it can be used to highlight the Asian session,
and there was no suitable category available.
Sessions London, NY, Asian*UPDATED* 02/18/2019
I tweaked the code a bit to have a more accurate picture. Enjoy.
-
-
-
-
-
-
I created this indicator to help locate the most traded sessions without having to take the time to locate them.
In order to use this simply click the "favorite" button to the right; then open up your charts, click indicators at the top of your screen and locate your "favorites" tab.
If you trade either London, NY, or Asian session and do not want the other session colors - simple go to indicator settings and click the "checked" boxes that you do not want on you chart.
Also; I created/coded this indication on CST time. I did several time switches and it seem to work on all. IF it doesn't work for you please message me so that I can change that ASAP .
Any and all feedback will be much appreciated. Thanks.
-CP

Sessions (London, NY, Asian)I created this indicator to help locate the most traded sessions without having to take the time to locate them.
If you trade either London, NY, or Asian session and do not want the other session colors - simple go to indicator settings and click the "checked" boxes that you do not want on you chart.
Also; I created/coded this indication on CST time. I did several time switches and it seem to work on all. IF it doesn't work for you please message me so that I can change that ASAP.
Any and all feedback will be much appreciated. Thanks.
-CP
