Adaptive Trend Trigger // VX-ATTAdaptive Trend Trigger // VX-ATT is a trend-following bias indicator that combines a baseline EMA with adaptive ATR bands and a momentum override layer.
Core idea:
The EMA defines the baseline trend.
ATR bands above/below the EMA mark zones where volatility is high enough to justify a directional push.
A break above the upper band switches the bias to Long.
A break below the lower band switches the bias to Short.
Strong candle bodies (measured vs. an average body size) can temporarily override the current bias when they close far above/below the EMA (momentum override).
What the indicator does:
Colors the background based on the active bias (Long/Short).
Plots EMA + ATR bands.
Marks strong momentum candles with arrows.
Provides alerts when the bias flips from Long → Short or Short → Long.
Typical use cases:
Trend filter for discretionary entries
Bias layer for strategies or additional indicators
Only trade in the direction of the active bias (e.g., favor Long setups in Long bias, avoid counter-trend scalps)
This is a simplified, free component extracted from my VX toolset (VX-ATT), designed as a clean, plug-and-play trend/bias layer you can combine with your own setups.
ATR

Exponential Moving Average + ATR MTF [YSFX]Description:
This indicator is a reupload of a previously published EMA + ATR tool, updated and enhanced after a house rule violation to provide additional features and a cleaner, more versatile experience for traders.
It combines trend analysis and volatility measurement into one intuitive tool, allowing traders to visualize market direction, dynamic support and resistance, and adaptive risk levels—all in a clean, minimal interface.
The indicator calculates a customizable moving average (MA) type—EMA, SMA, WMA, HMA, RMA, DEMA, TEMA, VWMA, LSMA, or KAMA—and surrounds it with ATR-based bands that expand and contract with market volatility. This creates a dynamic envelope around price, helping traders identify potential breakouts, pullbacks, or high-probability entry/exit zones.
Advanced Features:
Multiple MA types: Supports all major moving averages, including advanced options like KAMA, DEMA, and TEMA.
KAMA customization: Adjustable fast and slow lengths for precise tuning.
Dual timeframe support: Optionally use separate timeframes for the MA and ATR, or a global timeframe for both.
Dynamic ATR bands: Automatically adjust to market volatility, useful for setting adaptive stop-loss levels.
Optional fill: Shade the area between upper and lower ATR bands for a clear visual representation of volatility.
Flexible for all markets: Works across any timeframe or asset class.
Who It’s For:
This indicator is ideal for trend-following traders, swing traders, and volatility-focused analysts who want to:
Confirm trend direction while accounting for volatility
Identify high-probability trade entries and exits
Implement dynamic, ATR-based stop-loss strategies
Keep charts clean and uncluttered while still capturing key market information
This reuploaded version ensures compliance with platform rules while offering enhanced flexibility and clarity for modern trading workflows.

Adaptive Momentum Pressure (AMP)🔹 Adaptive Momentum Pressure (AMP)
A hybrid momentum oscillator that adapts to volatility and trend dynamics.
AMP measures the rate of change of price pressure and automatically adjusts its sensitivity based on market volatility.
It reacts faster in trending markets and smooths out noise during consolidation — helping traders identify genuine momentum shifts early while avoiding whipsaws.
🧠 Core Concept
AMP fuses three elements into one adaptive momentum model:
Normalized Momentum (ROC) – captures directional acceleration of price.
Adaptive Smoothing – the smoothing length dynamically contracts when volatility rises and expands when it falls.
Directional Bias – derived from the short-term EMA slope to weight momentum toward the prevailing trend.
Combined, these form a pressure value oscillating between –100 and +100, revealing when momentum expands or fades.
⚙️ How It Works
Calculates a normalized rate of change (ROC) relative to recent volatility.
Adjusts its effective length using the ATR — more volatile periods shorten the lookback for quicker reaction.
Applies a custom EMA that adapts in real time.
Modulates momentum by a normalized EMA slope (“trend bias”).
Produces a smoothed AMP line with a Signal line and crossover markers.
🔍 How to Read It
Green AMP line rising above Signal → Building bullish momentum.
Red AMP line falling below Signal → Fading or bearish momentum.
White Signal line = smoothed confirmation of trend energy.
Green dots = early bullish crossovers.
Red dots = early bearish crossovers.
Typical interpretations:
AMP crossing above 0 from below → early bullish impulse.
AMP peaking near +50–100 and curling down → potential momentum exhaustion.
Crosses below 0 with red pressure → bearish confirmation.
⚡ Advantages
✅ Adaptive across all markets and timeframes
✅ Built-in trend bias filters false signals
✅ Reacts earlier than RSI/MACD while reducing noise
✅ No manual retuning required
🧩 Suggested Use
Combine with structure or volume tools to confirm breakouts.
Works well as a momentum confirmation filter for entries/exits.
Optimal display: separate oscillator pane (not overlay).
Use it responsibly — AMP is an analytical tool, not financial advice.

Smarter Money Volume Rejection Blocks [PhenLabs]📊 Smarter Money Volume Rejection Blocks – Institutional Rejection Zone Detection
The Smarter Money Volume Rejection Blocks indicator combines high-volume analysis with statistical confidence intervals to identify where institutional traders are actively defending price levels through volume spikes and rejection patterns.
🔥 Core Methodology
Volume Spike Detection analyzes when current volume exceeds moving average by configurable multipliers (1.0-5.0x) to identify institutional activity
Rejection Candle Analysis uses dual-ratio system measuring wick percentage (30-90%) and maximum body ratio (10-60%) to confirm genuine rejections
Statistical Confidence Channels create three-level zones (upper, center, lower) based on ATR or Standard Deviation calculations
Smart Invalidation Logic automatically clears zones when price significantly breaches confidence levels to maintain relevance
Dynamic Channel Projection extends confidence intervals forward up to 200 bars with customizable length
Support Zone Identification detects bullish rejections where smart money absorbs selling pressure with high volume and strong lower wicks
Resistance Zone Mapping identifies bearish rejections where institutions defend price levels with volume spikes and pronounced upper wicks
Visual Information Dashboard displays real-time status table showing volume spike conditions and active support/resistance zones
⚙️ Technical Configuration
Dual Confidence Interval Methods: Choose between ATR-Based for trend-following environments or StdDev-Based for range-bound statistical precision
Volume Moving Average: Configurable period (default 20) for baseline volume comparison calculations
Volume Spike Multiplier: Adjustable threshold from 1.0 to 5.0 times average volume to filter institutional activity
Rejection Wick Percentage: Set minimum wick size from 30% to 90% of candle range for valid rejection detection
Maximum Body Ratio: Configure body-to-range ratio from 10% to 60% to ensure genuine rejection structures
Confidence Multiplier: Statistical multiplier (default 1.96) for 95% confidence interval calculations
Channel Projection Length: Extend confidence zones forward from 10 to 200 bars for anticipatory analysis
ATR Period: Customize Average True Range lookback from 5 to 50 bars for volatility-based calculations
StdDev Period: Adjust Standard Deviation period from 10 to 100 bars for statistical precision
🎯 Real-World Trading Applications
Identify high-probability support zones where institutional buyers have historically defended price with significant volume
Map resistance levels where smart money sellers consistently reject higher prices with volume confirmation
Combine with price action analysis to confirm breakout validity when price approaches confidence channel boundaries
Use invalidation signals to exit positions when smart money zones are definitively breached
Monitor the real-time dashboard to quickly assess current market structure and active rejection zones
Adapt strategy based on calculation method: ATR for trending markets, StdDev for ranging conditions
Set alerts on confidence level breaches to catch potential trend reversals or continuation patterns
📈 Visual Interpretation Guide
Green Zones indicate bullish rejection blocks where buyers defended with high volume and lower wicks
Red Zones indicate bearish rejection blocks where sellers defended with high volume and upper wicks
Solid Center Lines represent the core rejection price level where maximum volume activity occurred
Dashed Confidence Boundaries show upper and lower statistical limits based on volatility calculations
Zone Opacity decreases as channels extend forward to indicate decreasing confidence over time
Dashboard Color Coding provides instant visual feedback on active volume spike and zone conditions
⚠️ Important Considerations
Volume-based indicators identify historical rejection zones but cannot predict future price action with certainty
Market conditions change rapidly and institutional activity patterns evolve continuously
High volume does not guarantee level defense as market structure can shift without warning
Confidence intervals represent statistical probabilities, not guaranteed price boundaries

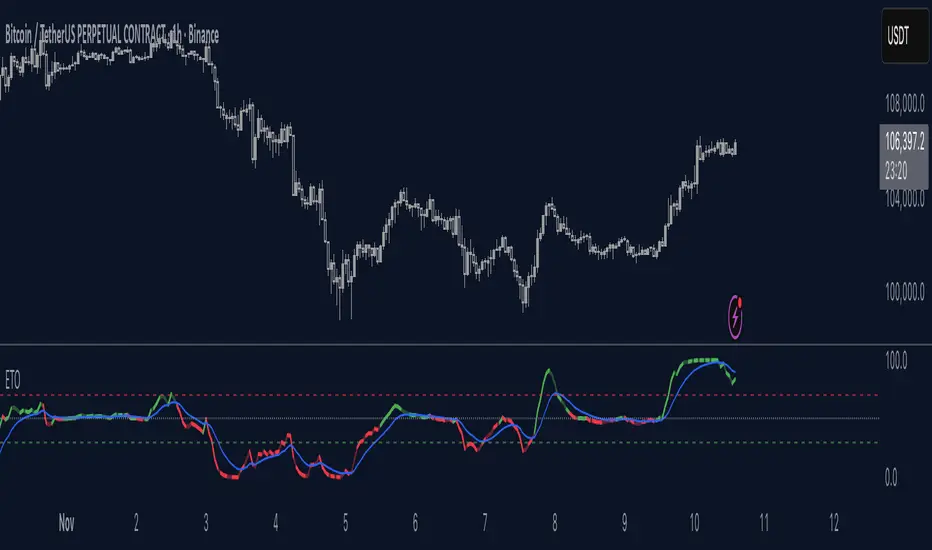
Elastic Trend OscillatorThe Elastic Trend Oscillator (ETO) is a volatility-adaptive momentum indicator that measures price displacement from a trend baseline while accounting for market volatility conditions. Unlike traditional oscillators that use fixed scaling, ETO dynamically adjusts its sensitivity based on current volatility levels relative to recent market conditions, providing context-aware momentum readings across different market regimes.
What Makes This Indicator Different
Volatility-Adaptive Scaling:
The core innovation of ETO is its dynamic volatility adjustment mechanism. The indicator calculates an ATR percentile rank over a lookback period and uses this to scale the momentum readings. When volatility is elevated, the indicator becomes less sensitive to price moves, recognizing that larger displacements are normal in volatile conditions. Conversely, in low volatility environments, smaller price moves are given more weight. This prevents false signals during volatility expansions and maintains sensitivity during quiet periods.
Low Volatility Compression:
During periods of extremely low volatility, the oscillator naturally compresses toward the midline and exhibits minimal movement. This midline-hugging behavior serves as a visual indicator that the market lacks directional energy and momentum readings are unreliable. Unlike indicators that continue oscillating during quiet periods and potentially generate false signals, ETO's compression around the midline is supposed to identify low-conviction environments where trend-following strategies underperform. When you see the oscillator stuck near 50 with little movement, recognize this as a consolidation phase where ranges dominate and breakout setups may be developing.
Trend Slope Analysis with Dynamic Thresholds:
The indicator monitors both the trend direction (EMA slope) and the rate of slope change. Dynamic thresholds based on ATR identify when trend acceleration is slowing. The oscillator becomes semi-transparent when slope deceleration exceeds the threshold, warning of potential trend exhaustion before actual reversals occur.
Relatively Linear Transformation:
Unlike many oscillators that use non-linear transformations, ETO applies a more linear scaling of the ATR-normalized displacement. This preserves the proportional relationship between price moves and oscillator readings, making divergences and momentum shifts more intuitive to interpret.
How to Use the Indicator
Trend Direction:
Green oscillator = Bullish trend (price above EMA with positive slope)
Red oscillator = Bearish trend (price below EMA with negative slope)
Oscillator compressed near 50 with minimal movement = Low volatility, consolidation phase. These phases often precede volatility expansions and significant directional moves, making them more ideal for monitoring breakout setups rather than taking positions.
Momentum Quality:
Solid color = Strong, accelerating trend
Semi-transparent = Decelerating trend, potential exhaustion, potential consolidation ahead
The transparency change acts as an early warning before actual trend reversals or consolidations.
Trading Signals:
Crossovers: When the oscillator crosses the signal line to the other side of momentum while oversold/overbought, it suggests potential reversals (better in combination with transparency loss).
Overbought/Oversold: Levels above 70 indicate overbought conditions; below 30 indicate oversold. These are not reversal signals themselves but identify extended moves where momentum may be extreme.
Midline: Oscillator above 50 indicates price is above the trend baseline with positive displacement. Below 50 indicates negative displacement.
Divergences: Like with other momentum indicators compare oscillator highs/lows with price highs/lows.
Settings
EMA Length: Controls the trend baseline period. Lower values make the indicator more responsive to short-term price changes; higher values focus on longer-term trends. This directly affects how quickly the oscillator responds to trend changes.
ATR Length: Determines the period for volatility measurement. This affects both the normalization of price displacement and the momentum confirmation filter. Lower values make volatility measurements more reactive; higher values provide smoother volatility assessment.
Oscillator Smoothing: Applies EMA smoothing to the raw oscillator values. A value of 1 shows unsmoothed, more volatile readings. Higher values produce smoother oscillations with less noise but more lag.
Signal Line Length: The EMA period for the signal line. Lower values create more frequent crossovers; higher values generate fewer but potentially more significant crossovers. This acts as a moving average of the oscillator itself.
Slope Change Sensitivity: Multiplier that sets how much slope deceleration triggers the transparency effect. Lower values make the indicator more sensitive to trend exhaustion, showing transparency earlier. Higher values require more pronounced deceleration before visual warning.
Overbought Level: Defines the upper extreme threshold.
Oversold Level: Defines the lower extreme threshold.
Best Practices
Use on any timeframe, but adjust EMA and ATR lengths according to your trading style (shorter for shorter term trades, longer for longer term trading like swing trading)
Combine with price action — the indicator identifies momentum conditions, not specific entry/exit points.
In strongly trending markets, the oscillator may remain in overbought/oversold territory for extended periods—this is normal and indicates persistent momentum rather than imminent reversal.
This indicator does not provide investment or trading advice. All trading decisions should be made based on your own analysis and risk management.
SuperTrend Dual RMAOverview
The SuperTrend Dual RMA is a hybrid volatility-based trend-following system that merges two Relative Moving Averages (RMAs) with an Average True Range (ATR)–anchored SuperTrend framework. The primary purpose of this indicator is to offer a smoother and more reliable depiction of directional bias while maintaining sensitivity to price volatility and market volume.
Traditional SuperTrend implementations typically rely on a single moving average and a fixed volatility envelope. This dual RMA structure introduces an adaptive central tendency line that reacts proportionally to both price and volume, allowing for more nuanced identification of trend reversals and continuation patterns.
**Core Concept**
The indicator is built around two key principles — smoothing and volatility adaptation.
1. **Smoothing:** The use of two separate RMAs with configurable lengths creates a dynamic equilibrium between short-term responsiveness and long-term stability. The first RMA captures near-term directional shifts, while the second provides broader market context. The average of both becomes the foundation of the SuperTrend bands.
2. **Volatility Adaptation:** The ATR multiplier and period define the distance between upper and lower bands relative to recent volatility. This ensures that the SuperTrend line remains flexible across varying market conditions — expanding during high volatility and contracting during calm phases.
**Calculation Steps**
* The indicator first computes two volume-weighted RMAs based on the typical price (`hlc3`) multiplied by trading volume.
* Each RMA is normalized by the smoothed volume to maintain proportional weighting.
* These two RMAs are averaged to produce a “basis line” that reflects the current market consensus price.
* The ATR is calculated over a user-defined period, then multiplied by a volatility factor (ATR multiplier).
* The resulting ATR value defines dynamic upper and lower thresholds around the basis line.
* Trend direction is determined by price closing behavior relative to these thresholds:
* When the closing price exceeds the upper band, the trend is considered bullish.
* When it drops below the lower band, the trend turns bearish.
* If price remains within the bands, the prior trend direction is maintained for consistency.
**Visual Structure**
The SuperTrend Dual RMA provides multiple layers of visual feedback for enhanced interpretation:
* Two distinct RMA lines (short and long) are plotted with complementary colors for contrast and clarity.
* A soft fill between the RMA lines highlights the interaction between short- and medium-term momentum.
* The ATR-based SuperTrend bands are drawn above and below the basis, with adaptive coloring that corresponds to the prevailing trend direction.
* Bar colors automatically adjust to reflect bullish or bearish bias, making it easy to identify trend shifts without relying solely on crossovers.
* Optional triangle markers appear below or above bars to signal potential buy or sell opportunities based on crossover logic.
**Signals and Alerts**
The indicator provides real-time crossover detection:
* **Buy Signal:** Triggered when the closing price moves above the SuperTrend line, confirming potential bullish continuation or reversal.
* **Sell Signal:** Triggered when the closing price drops below the SuperTrend line, indicating possible bearish momentum or reversal.
Both conditions have built-in `alertcondition()` functions, allowing users to set automated alerts for trading or monitoring purposes. This enables integration with TradingView’s alert system for push notifications, emails, or webhook connections.
**Usage Guidelines**
* **Trend Identification:** Use the color-coded trend line and bar color as a visual guide to the current directional bias.
* **Entry and Exit Timing:** Consider entering trades when a new crossover alert appears, preferably in the direction of the overall higher-timeframe trend.
* **Parameter Tuning:** Adjust the RMA lengths and ATR parameters based on asset volatility. Shorter RMA and ATR settings provide faster reactions, suitable for intraday or high-frequency trading, while longer configurations better fit swing or position strategies.
* **Risk Management:** Because the SuperTrend inherently acts as a dynamic stop level, traders can use the opposite band or SuperTrend line as a trailing stop or exit signal.
**Practical Applications**
* Trend confirmation in multi-timeframe strategies.
* Adaptive trailing stop placement using the lower or upper band.
* Visual comparison of volume-weighted price movement against volatility envelopes.
* Integration into algorithmic trading systems as a signal filter or trend bias component.
* Identification of overextended conditions when price significantly diverges from the SuperTrend basis.
**Originality and Advantages**
The SuperTrend Dual RMA differentiates itself from conventional SuperTrend scripts through three innovative design choices:
1. **Dual Volume-Weighted RMAs:** By incorporating two RMAs weighted by trading volume, the indicator accounts for liquidity dynamics, producing smoother and more reliable averages compared to price-only calculations.
2. **Anchored SuperTrend Framework:** The SuperTrend bands are not derived from a fixed source (such as a single close or median price) but from a blended RMA basis, making them more adaptable to varying market behaviors.
3. **Integrated Multi-Layer Visualization:** The inclusion of filled regions between RMAs, dynamic band coloring, and bar tinting enhances readability and analytical depth without overwhelming the chart.
These improvements collectively create a more balanced and data-rich representation of market structure, offering a higher degree of analytical precision. It’s suitable for traders seeking both discretionary and systematic use, as the indicator’s logic is transparent and compatible with alert-based or automated workflows.
**Summary**
The SuperTrend Dual RMA is a refined evolution of the classic SuperTrend, optimized for traders who value smoother directional tracking and more intelligent volatility adaptation. It blends two time-sensitive, volume-aware moving averages with an ATR-derived volatility system to deliver reliable, actionable trend information. Its visual design, adaptive responsiveness, and integrated alert functionality make it a complete solution for identifying and managing trends across multiple asset classes and timeframes.

DEMA Flow [Alpha Extract]A sophisticated trend identification system that combines Double Exponential Moving Average methodology with advanced HL median filtering and ATR-based band detection for precise trend confirmation. Utilizing dual-layer smoothing architecture and volatility-adjusted breakout zones, this indicator delivers institutional-grade flow analysis with minimal lag while maintaining exceptional noise reduction. The system's intelligent band structure with asymmetric ATR multipliers provides clear trend state classification through price position analysis relative to dynamic threshold levels.
🔶 Advanced DEMA Calculation Engine
Implements double exponential moving average methodology using cascaded EMA calculations to significantly reduce lag compared to traditional moving averages. The system applies dual smoothing through sequential EMA processing, creating a responsive yet stable trend baseline that maintains sensitivity to genuine market structure changes while filtering short-term noise.
// Core DEMA Framework
dema(src, length) =>
EMA1 = ta.ema(src, length)
EMA2 = ta.ema(EMA1, length)
DEMA_Value = 2 * EMA1 - EMA2
DEMA_Value
// Primary Calculation
DEMA = dema(close, DEMA_Length)
2H
🔶 HL Median Filter Smoothing Architecture
Features sophisticated high-low median filtering using rolling window analysis to create ultra-smooth trend baselines with outlier resistance. The system constructs dynamic arrays of recent DEMA values, sorts them for median extraction, and handles both odd and even window lengths for optimal smoothing consistency across all market conditions.
// HL Median Filter Logic
hlMedian(src, length) =>
window = array.new_float()
for i = 0 to length - 1
array.push(window, src)
array.sort(window)
// Median Extraction
lenW = array.size(window)
median = lenW % 2 == 1 ?
array.get(window, lenW / 2) :
(array.get(window, lenW/2 - 1) + array.get(window, lenW/2)) / 2
// Smooth DEMA Calculation
Smooth_DEMA = hlMedian(DEMA_Value, HL_Filter_Length)
🔶 ATR Band Construction Framework
Implements volatility-adaptive band structure using Average True Range calculations with asymmetric multiplier configuration for optimal trend identification. The system creates upper and lower threshold bands around the smoothed DEMA baseline with configurable ATR multipliers, enabling precise trend state determination through price breakout analysis.
// ATR Band Calculation
atrBands(src, atr_length, upper_mult, lower_mult) =>
ATR = ta.atr(atr_length)
Upper_Band = src + upper_mult * ATR
Lower_Band = src - lower_mult * ATR
// Band Generation
= atrBands(Smooth_DEMA, ATR_Length, Upper_ATR_Mult, Lower_ATR_Mult)
15min
🔶 Intelligent Flow Signal Engine
Generates binary trend states through band breakout detection, transitioning to bullish flow when price exceeds upper band and bearish flow when price breaches lower band. The system maintains flow state persistence until opposing band breakout occurs, providing clear trend classification without whipsaw signals during normal volatility fluctuations.
🔶 Comprehensive Visual Architecture
Provides multi-dimensional flow visualization through color-coded DEMA line, trend-synchronized candle coloring, and bar color overlay for complete chart integration. The system uses institutional color scheme with neon green for bullish flow, neon red for bearish flow, and neutral gray for undefined states with configurable band visibility.
🔶 Asymmetric Band Configuration
Features intelligent asymmetric ATR multiplier system with default upper multiplier of 2.1 and lower multiplier of 1.5, optimizing for market dynamics where upside breakouts often require stronger momentum confirmation than downside breaks. This configuration reduces false signals while maintaining sensitivity to genuine flow changes.
🔶 Dual-Layer Smoothing Methodology
Combines DEMA's inherent lag reduction with HL median filtering to create exceptional smoothing without sacrificing responsiveness. The system first applies double exponential smoothing for initial noise reduction, then applies median filtering to eliminate outliers and create ultra-clean flow baseline suitable for high-frequency and institutional trading applications.
🔶 Alert Integration System
Features comprehensive alert framework for flow state transitions with customizable notifications for bullish and bearish flow confirmations. The system provides real-time alerts on crossover events with clear directional indicators and exchange/ticker integration for multi-symbol monitoring capabilities.
🔶 Performance Optimization Framework
Utilizes efficient array management with optimized median calculation algorithms and minimal variable overhead for smooth operation across all timeframes. The system includes intelligent bar indexing for median filter initialization and streamlined flow state tracking for consistent performance during extended analysis periods.
🔶 Why Choose DEMA Flow ?
This indicator delivers sophisticated flow identification through dual-layer smoothing architecture and volatility-adaptive band methodology. By combining DEMA's reduced-lag characteristics with HL median filtering and ATR-based breakout zones, it provides institutional-grade flow analysis with exceptional noise reduction and minimal false signals. The system's asymmetric band structure and comprehensive visual integration make it essential for traders seeking systematic trend-following approaches across cryptocurrency, forex, and equity markets with clear entry/exit signals and comprehensive alert capabilities for automated trading strategies.

ATR Support LineOverview
ATR Support Line is a higher-timeframe-aware overlay that builds a single dynamic support line by anchoring a smoothed price baseline and offsetting it with an Average True Range (ATR) multiple. It is designed to track constructive trends while adapting to current volatility. The tool can render using higher-timeframe (HTF) data with optional closed-bar confirmation to avoid repainting, or live interpolation for more responsive visuals.
Core logic (concepts, not implementation)
• Compute an anchor from price using a selectable moving-average family (SMA / EMA / ZLEMA).
• Measure volatility using ATR and apply a configurable multiplier.
• Form the support line by offsetting the anchor downward by the ATR multiple.
• Timeframe handling: either use the chart timeframe or request an explicit HTF for calculation.
• Rendering modes:
– Closed-bar mode : interpolate inside the previous HTF bar for non-repainting behavior.
– Live mode : interpolate inside the current HTF bar for more timely responsiveness (can visually “breathe” intrabar).
Inputs
• Anchor smoothing: MA type (SMA / EMA / ZLEMA) and anchor length.
• Volatility: ATR length and multiplier.
• Timeframe: optional calculation timeframe (HTF) distinct from the chart timeframe.
• Confirmation: toggle to use closed HTF values (non-repainting) vs. live interpolation.
How to read it
• Price holding above the ATR Support Line indicates constructive conditions; orderly pullbacks toward the line can be normal trend behavior.
• Persistent closes above the line indicate strength; reactions into the line often resolve higher in constructive regimes.
• Persistent closes below the line warn of deterioration; consider reducing risk until price reclaims the level.
• On HTF rendering with closed-bar confirmation, use closes on that HTF for signal confirmation.
• In live mode, treat intrabar pierces as potential noise until confirmed by the close.
Practical use cases
• Trend context: define a trailing “line in the sand” for long-bias frameworks.
• Risk framing: size down or tighten exposure when price loses the support line.
• Confluence: combine with structure (HH/HL vs. LH/LL), volume, or market-wide risk gauges.
• Multi-TF workflow: calculate on HTF for bias, execute on lower TFs for entries/exits.
Best practices
• Align confirmations with the timeframe used for calculation (especially in closed-bar mode).
• Pair with clear invalidation rules (e.g., daily/weekly closes below the line).
• Start with conservative multipliers on noisier assets; adjust ATR length/multiplier to match instrument volatility.
Technical notes
• Non-repainting option : closed-bar HTF mode finalizes values on HTF close; lower-TF plotting uses interpolation only for continuity (no look-ahead).
• Live option : interpolates within the current HTF bar for responsiveness; expect intrabar breathing.
• Works on any time-based chart; results are most interpretable on liquid instruments.
Who it is for
• Traders who want a single, disciplined, volatility-adjusted support line with HTF awareness.
• Systematic users who prefer clear, reproducible rules for trend context and risk boundaries.
Limitations & disclosures
• Closed-source; for educational and analytical use only.
• Not financial advice. Markets involve risk; past performance does not guarantee future results.
Release notes
• Added selectable anchor MA (SMA / EMA / ZLEMA) and explicit HTF calculation with two rendering modes (closed-bar non-repainting vs. live).
• Interpolation refined for smooth visuals while respecting HTF closes in confirmation mode.
Originality & why closed-source
This is not a reimplementation of public open-source scripts. The integration of anchor smoothing choices, volatility offset, HTF calculation, and dual rendering modes (closed-bar non-repainting vs. live interpolation) is designed to maintain trend fidelity with practical control over responsiveness. The interaction of these components is proprietary and the source is closed to protect the implementation.
Integration, not a mashup
ATR Support Line is a single, self-contained framework. It does not merely merge indicators; its components are purpose-built to produce one coherent, volatility-aware, single-line support with a clear reading protocol (hold above = constructive; loss = caution).
Indicator, not a strategy
This publication is an indicator overlay, not a trading strategy. It includes no backtests, position logic, performance claims, or risk assumptions. Use it as analytical context within your own risk management.
Comparison to common tools
Compared to static moving-average baselines or classic volatility bands, ATR Support Line emphasizes (1) a single actionable support level, (2) explicit volatility adjustment via ATR, and (3) HTF-aware rendering with an optional non-repainting confirmation mode.

Adaptive CE-VWAP Breakout Framework [KedArc Quant]Description
A structured framework that unites three complementary systems into one charting engine:
Chandelier Exit (CE) – ATR-based trailing logic that defines trend direction, stop placement, and risk/reward overlays.
Swing-Anchored VWAP (SWAV) – a dynamically anchored VWAP that re-starts from each confirmed swing and adapts its smoothness to volatility.
Pivot S/R with Volume Breaks – confirmed horizontal levels with alerts when broken on expanding volume.
This script builds a single workflow for bias → trigger → managementwithout mixing unrelated indicators. Each module is internally linked rather than layered cosmetically, making it a true analytical framework—not.
Acknowledgment
Special thanks to Dynamic Swing Anchored VWAP by Zeiierman, whose swing-anchoring concept inspired a part of the SWAV module’s implementation and adaptation logic.
Support and Resistance Levels with Breaks by LuxAlgo for S/R breakout logic.
How this helps traders
Trend clarity – CE color-codes direction and provides evolving stops.
Context value – SWAV traces adaptive mean paths so traders see where price is heavy or light.
Action filter – Pivot+volume logic highlights true structural breaks, filtering false moves.
Discipline tool – Optional R:R boxes visualize risk and target zones to enforce planning.
Entry / Exit guidelines (for study purposes only)
Bias Use CE direction: green = long bias red = short bias
Entry
1. Breakout method– Trade in CE direction when a pivot level breaks on valid volume.
2. VWAP confirmation– Prefer breaks occurring around the nearest SWAV path (fair-value cross or re-test).
Exit
Stop = CE line / recent swing HL / ATR × (multiplier)
Target = R-multiple × risk (default 2 R)
Optional live update keeps SL/TP aligned with current CE state.
Core formula concepts
ATR Stop: Stop = High/Low – ATR × multiplier
VWAP calc: Σ(price × vol) / Σ(vol) anchored at swing pivot, adapted by APT (Adaptive Price Tracking) ratio ∝ ATR volatility.
Volume oscillator: 100 × (EMA₅ – EMA₁₀)/EMA₁₀; valid break when threshold %.
Input configuration (high-level)
Master Controls
Show CE / SWAV modules Theme & Fill opacity
CE Section
ATR period & multiplier Use Close for extremums
Show buy/sell labels Await bar confirmation
Risk-Reward overlay: R-multiple, Stop basis (CE/Swing/ATR×), Live update toggle
SWAV Section
Swing period Adaptive Price Tracking length Volatility bias (ATR-based adaptation) Line width
Pivot & Volume Breaks
Left/Right bar windows Volume threshold % Show Break labels and alerts
Best timeframes
Intraday: 5 m – 30 m for breakout confirmation
Swing: 1 h – 4 h for trend context
Settings scale with instrument volatility—adjust ATR period and volume threshold to match liquidity.
Glossary
ATR: Average True Range (volatility metric)
CE: Chandelier Exit (trailing stop/trend filter)
SWAV: Swing-Anchored VWAP (anchored mean price path)
Pivot H/L: Confirmed local extrema using left/right bar windows
R-multiple: Profit target as a multiple of initial risk
FAQ
Q: Does it repaint? A: No—pivots wait for confirmation and VWAP updates forward-only.
Q: Can modules be disabled? A: Yes—each section has its own toggle.
Q: Can it trade automatically? A: This is an indicator/study, not an auto-strategy.
Q: Is this financial advice? A: No—educational use only.
Disclaimer
This script is for educational and analytical purposes only.
It is not financial advice. Trading involves risk of loss. Past performance does not guarantee future results. Always apply sound risk management.

Cloud and Table - Ostinato TradingMain indicator of Ostinato Trading, the moving averages cloud and table. You can superpose various moving averages, bollinger bands and their color fill. Additionaly the table is used to plot the distance from the price to moving averages, the ATR value, the stop loss ... You can also plot a bulls eyes of SL and TP in points to visualise it on the chart.

Smart Money Flow Index (SMFI) - Advanced SMC [PhenLabs]📊Smart Money Flow Index (SMFI)
Version: PineScript™v6
📌Description
The Smart Money Flow Index (SMFI) is an advanced Smart Money Concepts implementation that tracks institutional trading behavior through multi-dimensional analysis. This comprehensive indicator combines volume-validated Order Block detection, Fair Value Gap identification with auto-mitigation tracking, dynamic Liquidity Zone mapping, and Break of Structure/Change of Character detection into a unified system.
Unlike basic SMC indicators, SMFI employs a proprietary scoring algorithm that weighs five critical factors: Order Block strength (validated by volume), Fair Value Gap size and recency, proximity to Liquidity Zones, market structure alignment (BOS/CHoCH), and multi-timeframe confluence. This produces a Smart Money Score (0-100) where readings above 70 represent optimal institutional setup conditions.
🚀Points of Innovation
Volume-Validated Order Block Detection – Only displays Order Blocks when formation candle exceeds customizable volume multiplier (default 1.5x average), filtering weak zones and highlighting true institutional accumulation/distribution
Auto-Mitigation Tracking System – Fair Value Gaps and Order Blocks automatically update status when price mitigates them, with visual distinction between active and filled zones preventing trades on dead levels
Proprietary Smart Money Score Algorithm – Combines weighted factors (OB strength 25%, FVG proximity 20%, Liquidity 20%, Structure 20%, MTF 15%) into single 0-100 confidence rating updating in real-time
ATR-Based Adaptive Calculations – All distance measurements use 14-period Average True Range ensuring consistent function across any instrument, timeframe, or volatility regime without manual recalibration
Dynamic Age Filtering – Automatically removes liquidity levels and FVGs older than configurable thresholds preventing chart clutter while maintaining relevant levels
Multi-Timeframe Confluence Integration – Analyzes higher timeframe bias with customizable multipliers (2-10x) and incorporates HTF trend direction into Smart Money Score for institutional alignment
🔧Core Components
Order Block Engine – Detects institutional supply/demand zones using characteristic patterns (down-move-then-strong-up for bullish, up-move-then-strong-down for bearish) with minimum volume threshold validation, tracks mitigation when price closes through zones
Fair Value Gap Scanner – Identifies price imbalances where current candle's low/high leaves gap with two-candle-prior high/low, filters by minimum size percentage, monitors 50% fill for mitigation status
Liquidity Zone Mapper – Uses pivot high/low detection with configurable lookback to mark swing points where stop losses cluster, extends horizontal lines to visualize sweep targets, manages lifecycle through age-based removal
Market Structure Analyzer – Tracks pivot progression to identify trend through higher-highs/higher-lows (bullish) or lower-highs/lower-lows (bearish), detects Break of Structure and Change of Character for trend/reversal confirmation
Scoring Calculation Engine – Evaluates proximity to nearest Order Blocks using ATR-normalized distance, assesses FVG recency and distance, calculates liquidity proximity with age weighting, combines structure bias and MTF trend into smoothed final score
🔥Key Features
Customizable Display Limits – Control maximum Order Blocks (1-10), Liquidity Zones (1-10), and FVG age (10-200 bars) to maintain clean charts focused on most relevant institutional levels
Gradient Strength Visualization – All zones render with transparency-adjustable coloring where stronger/newer zones appear more solid and weaker/older zones fade progressively providing instant visual hierarchy
Educational Label System – Optional labels identify each zone type (Bullish OB, Bearish OB, Bullish FVG, Bearish FVG, BOS) with color-coded text helping traders learn SMC concepts through practical application
Real-Time Smart Money Score Dashboard – Top-right table displays current score (0-100) with color coding (green >70, yellow 30-70, red <30) plus trend arrow for at-a-glance confidence assessment
Comprehensive Alert Suite – Configurable notifications for Order Block formation, Fair Value Gap detection, Break of Structure events, Change of Character signals, and high Smart Money Score readings (>70)
Buy/Sell Signal Integration – Automatically plots triangle markers when Smart Money Score exceeds 70 with aligned market structure and fresh Order Block detection providing clear entry signals
🎨Visualization
Order Block Boxes – Shaded rectangles extend from formation bar spanning high-to-low of institutional candle, bullish zones in green, bearish in red, with customizable transparency (80-98%)
Fair Value Gap Zones – Rectangular areas marking imbalances, active FVGs display in bright colors with adjustable transparency, mitigated FVGs switch to gray preventing trades on filled zones
Liquidity Level Lines – Dashed horizontal lines extend from pivot creation points, swing highs in bearish color (short targets above), swing lows in bullish color (long targets below), opacity decreases with age
Structure Labels – "BOS" labels appear above/below price when Break of Structure confirmed, colored by direction (green bullish, red bearish), positioned at 1% beyond highs/lows for visibility
Educational Info Panel – Bottom-right table explains key terminology (OB, FVG, BOS, CHoCH) and score interpretation (>70 high probability) with semi-transparent background for readability
📖Usage Guidelines
General Settings
Show Order Blocks – Default: On, toggles visibility of institutional supply/demand zones, disable when focusing solely on FVGs or Liquidity
Show Fair Value Gaps – Default: On, controls FVG zone display including active and mitigated imbalances
Show Liquidity Zones – Default: On, manages liquidity line visibility, disable on lower timeframes to reduce clutter
Show Market Structure – Default: On, toggles BOS/CHoCH label display
Show Smart Money Score – Default: On, controls score dashboard visibility
Order Block Settings
OB Lookback Period – Default: 20, Range: 5-100, controls bars scanned for Order Block patterns, lower values detect recent activity, higher values find older blocks
Min Volume Multiplier – Default: 1.5, Range: 1.0-5.0, sets minimum volume threshold as multiple of 20-period average, higher values (2.0+) filter for strongest institutional candles
Max Order Blocks to Display – Default: 3, Range: 1-10, limits simultaneous Order Blocks shown, lower settings (1-3) maintain focus on most recent zones
Fair Value Gap Settings
Min FVG Size (%) – Default: 0.3, Range: 0.1-2.0, defines minimum gap size as percentage of close price, lower values detect micro-imbalances, higher values focus on significant gaps
Max FVG Age (bars) – Default: 50, Range: 10-200, removes FVGs older than specified bars, lower settings (10-30) for scalping, higher (100-200) for swing trading
Show FVG Mitigation – Default: On, displays filled FVGs in gray providing visual history, disable to show only active untouched imbalances
Liquidity Zone Settings
Liquidity Lookback – Default: 50, Range: 20-200, sets pivot detection period for swing highs/lows, lower values (20-50) mark shorter-term liquidity, higher (100-200) identify major swings
Max Liquidity Age (bars) – Default: 100, Range: 20-500, removes liquidity lines older than specified bars, adjust based on timeframe
Liquidity Sensitivity – Default: 0.5, Range: 0.1-1.0, controls pivot detection sensitivity, lower values mark only major swings, higher values identify minor swings
Max Liquidity Zones to Display – Default: 3, Range: 1-10, limits total liquidity levels shown maintaining chart clarity
Market Structure Settings
Pivot Length – Default: 5, Range: 3-15, defines bars to left/right for pivot validation, lower values (3-5) create sensitive structure breaks, higher (10-15) filter for major shifts
Min Structure Move (%) – Default: 1.0, Range: 0.1-5.0, sets minimum percentage move required between pivots to confirm structure change
Multi-Timeframe Settings
Enable MTF Analysis – Default: On, activates higher timeframe trend analysis incorporation into Smart Money Score
Higher Timeframe Multiplier – Default: 4, Range: 2-10, multiplies current timeframe to determine analysis timeframe (4x on 15min = 1hour)
Visual Settings
Bullish Color – Default: Green (#089981), sets color for bullish Order Blocks, FVGs, and structure elements
Bearish Color – Default: Red (#f23645), defines color for bearish elements
Neutral Color – Default: Gray (#787b86), controls color of mitigated zones and neutral elements
Show Educational Labels – Default: On, displays text labels on zones identifying type (OB, FVG, BOS), disable once familiar with patterns
Order Block Transparency – Default: 92, Range: 80-98, controls Order Block box transparency
FVG Transparency – Default: 92, Range: 80-98, sets Fair Value Gap zone transparency independently from Order Blocks
Alert Settings
Alert on Order Block Formation – Default: On, triggers notification when new volume-validated Order Block detected
Alert on FVG Formation – Default: On, sends alert when Fair Value Gap appears enabling quick response to imbalances
Alert on Break of Structure – Default: On, notifies when BOS or CHoCH confirmed
Alert on High Smart Money Score – Default: On, alerts when Smart Money Score crosses above 70 threshold indicating high-probability setup
✅Best Use Cases
Order Block Retest Entries – After Break of Structure, wait for price retrace into fresh bullish Order Block with Smart Money Score >70, enter long on zone reaction targeting next liquidity level
Fair Value Gap Retracement Trading – When price creates FVG during strong move then retraces, enter as price approaches unfilled gap expecting institutional orders to continue trend
Liquidity Sweep Reversals – Monitor price approaching swing high/low liquidity zones against prevailing Smart Money Score trend, after stop hunt sweep watch for rejection into premium Order Block/FVG
Multi-Timeframe Confluence Setups – Identify alignment when current timeframe Order Block coincides with higher timeframe FVG plus MTF analysis showing matching trend bias
Break of Structure Continuations – After BOS confirms trend direction, trade pullbacks to nearest Order Block or FVG in direction of structure break using Smart Money Score >70 as entry filter
Change of Character Reversal Plays – When CHoCH detected indicating potential reversal, look for Smart Money Score pivot with opposing Order Block formation then enter on structure confirmation
⚠️Limitations
Lagging Pivot Calculations – Pivot-based features (Liquidity Zones, Market Structure) require bars to right of pivot for confirmation, meaning these elements identify levels retrospectively with delay equal to lookback period
Whipsaw in Ranging Markets – During choppy conditions, Order Blocks fail frequently and structure breaks produce false signals as Smart Money Score fluctuates without clear institutional bias, best used in trending markets
Volume Data Dependency – Order Block volume validation requires accurate volume data which may be incomplete on Forex pairs or limited in crypto exchange feeds
Subjectivity in Scoring Weights – Proprietary 25-20-20-20-15 weighting reflects general institutional behavior but may not optimize for specific instruments or market regimes, user cannot adjust factor weights
Visual Complexity on Lower Timeframes – Sub-hour timeframes generate excessive zones creating cluttered charts, requires aggressive display limit reduction and higher minimum thresholds
No Fundamental Integration – Indicator analyzes purely technical price action and volume without incorporating economic events, news catalysts, or fundamental shifts that override technical levels
💡What Makes This Unique
Unified SMC Ecosystem – Unlike indicators displaying Order Blocks OR FVGs OR Liquidity separately, SMFI combines all three institutional concepts plus market structure into single cohesive system
Proprietary Confidence Scoring – Rather than manual setup assessment, automated Smart Money Score quantifies probability by weighting five institutional dimensions into actionable 0-100 rating
Volume-Filtered Quality – Eliminates weak Order Blocks forming without institutional volume confirmation, ensuring displayed zones represent genuine accumulation/distribution
Adaptive Lifecycle Management – Automatically updates mitigation status and removes aged zones preventing trades on dead levels through continuous validity and age monitoring
Educational Integration – Built-in tooltips, labeled zones, and reference panel make indicator functional for both learning Smart Money Concepts and executing strategies
🔬How It Works
Order Block Detection – Scans for patterns where strong directional move follows counter-move creating last down-candle before rally (bullish OB) or last up-candle before sell-off (bearish OB), validates formations only when candle exhibits volume exceeding configurable multiple (default 1.5x) of 20-bar average volume
Fair Value Gap Identification – Compares current candle’s high/low against two-candles-prior low/high to detect price imbalances, calculates gap size as percentage of close and filters micro-gaps below minimum threshold (default 0.3%), monitors whether subsequent price fills 50% triggering mitigation status
Liquidity Zone Mapping – Employs pivot detection using configurable lookback (default 50 bars) to identify swing highs/lows where retail stops cluster, extends horizontal reference lines from pivot creation and applies age-based filtering to remove stale zones
Market Structure Analysis – Tracks pivot progression using structure-specific lookback (default 5 bars) to determine trend, confirms uptrend when new pivot high exceeds previous by minimum move percentage, detects Break of Structure when price breaks recent pivot level, flags Change of Character for potential reversals
Multi-Timeframe Confluence – When enabled, requests security data from higher timeframe (current TF × HTF multiplier, default 4x), compares HTF close against HTF 20-period MA to determine bias, contributes ±50 points to score ensuring alignment with institutional positioning on superior timeframe
Smart Money Score Calculation – Evaluates Order Block component via ATR-normalized distance producing max 100-point contribution weighted at 25%, assesses FVG factor through age penalty and distance at 20% weight, calculates Liquidity proximity at 20%, incorporates structure bias (±50-100 points) at 20%, adds MTF component at 15%, applies 3-period smoothing to reduce volatility
Visual Rendering and Lifecycle – Draws Order Block boxes, Fair Value Gap rectangles with color coding (green/red active, gray mitigated), extends liquidity dashed lines with fade-by-age opacity, plots BOS labels, displays Smart Money Score dashboard, continuously updates checking mitigation conditions and removing elements exceeding age/display limits
💡Note:
The Smart Money Flow Index combines multiple Smart Money Concepts into unified institutional order flow analysis. For optimal results, use the Smart Money Score as confluence filter rather than standalone entry signal – scores above 70 indicate high-probability setups but should be combined with risk management, higher timeframe bias, and market regime understanding.

Twisted Analytics ATR Model ProThe Trend Spotter Indicator is a sophisticated technical analysis tool engineered to identify high-probability trend formations across all timeframes and asset classes. Built with proprietary algorithms, this indicator combines multiple technical methodologies to deliver clear, actionable signals for traders at all experience levels.
What Makes It Unique
Unlike basic moving average systems, the Trend Spotter employs a multi-layered approach that validates trends through:
Multi-Timeframe Analysis: Confirms signals across higher timeframes to filter false positives
Adaptive Volatility Filtering: Adjusts thresholds based on ATR to optimize for both ranging and trending markets
Momentum Confirmation: Validates trend strength using proprietary oscillators before generating signals
Dynamic Trend Strength Measurement: Real-time assessment of trend intensity and potential exhaustion
Key Features
✅ Universal Compatibility: Works seamlessly on crypto, stocks, forex, commodities, and indices
✅ No Repainting: Signals remain fixed once generated - reliable for backtesting and live trading
✅ Customizable Alerts: Set up notifications for trend reversals, breakouts, and momentum shifts
✅ Visual Clarity: Color-coded signals with adjustable display settings
✅ Smart Noise Filtering: Advanced algorithms eliminate market noise and focus on genuine trends
✅ Support/Resistance Detection: Automatically identifies key levels based on trend structure
How It Works
The indicator analyzes price action through four independent validation layers:
Trend Identification: Detects higher highs/lows (uptrend) or lower highs/lows (downtrend)
Momentum Confirmation: Ensures signals align with prevailing momentum
Volatility Analysis: Adapts to changing market conditions using ATR-based thresholds
Signal Validation: Cross-references multiple factors before generating final signals
This multi-factor approach significantly reduces false signals by requiring confirmation from multiple independent analysis methods.
Best Use Cases
Trend Following: Ride major trends from early entry to exhaustion
Breakout Trading: Catch strong momentum moves out of consolidation
Reversal Trading: Identify trend exhaustion and potential reversals
Multi-Timeframe Strategies: Confirm lower timeframe entries with higher timeframe trends
Who Should Use This
Day traders seeking reliable trend signals on intraday charts
Swing traders looking for multi-day trend opportunities
Position traders wanting to identify major trend changes
Both beginner and professional traders who value data-driven decision making
Configuration Flexibility
The indicator offers extensive customization options:
Trend Period: Adjust sensitivity from 5 to 200 bars
Signal Sensitivity: Choose Low/Medium/High based on trading style
Trend Strength Threshold: Filter weak trends (0-100 scale)
Multi-Timeframe Mode: Enable/disable higher timeframe confirmation
Visual Settings: Customize colors, signal size, and labels
Trading Strategy Examples
Trend Following: Enter on initial signal, add on pullbacks, exit on reversal
Breakout Strategy: Wait for consolidation, enter on trend signal breakout
Reversal Strategy: Identify exhaustion, enter on first opposite signal
Scalping: Use high sensitivity on 1-15 min charts for quick trades
Risk Management Note
While the Trend Spotter provides high-probability signals, no indicator guarantees profits. Always use proper risk management:
Risk only 1-2% of capital per trade
Set stop-losses based on technical levels
Combine with volume analysis and support/resistance
Backtest settings on historical data before live trading
What You Get
Professional-grade trend detection algorithm
Real-time signal generation with no lag
Comprehensive parameter customization
Visual clarity with intuitive color coding
Compatible with all TradingView account types
Ongoing updates and improvements
Technical Specifications
Calculation Method: Proprietary multi-factor analysis
Signal Type: Non-repainting trend direction and strength
Overlay: Yes - displays directly on price chart
Alerts: Fully customizable alert conditions
Timeframes: All timeframes from 1-minute to monthly
Asset Classes: Universal - works on all tradable instruments
Support
Published by Twisted Analytics - Professional trading tools built by traders, for traders.

Volume Weighted Average True RangeThis indicator calculates a customizable version of the Average True Range (ATR), a tool for measuring market volatility. It enhances the standard ATR with volume weighting, a dual-smoothing process, normalization, and volatility pivot detection.
Key Features:
Volume Weighting: An option (Volume weighted) allows for volume to be incorporated into the volatility calculation. This provides a measure of "volume-adjusted" volatility that is more responsive to significant market activity.
Dual Smoothing Process: For noise reduction, the indicator employs a two-stage smoothing process. It first calculates a smoothed True Range (TR) over a user-defined period (TR Length) before applying the final ATR moving average (ATR Length & ATR Smooth).
Normalization (Percentage Volatility): An optional 'Normalize' mode calculates the ATR as a percentage of the price. This allows for consistent volatility comparison across different assets and over long time periods.
Volatility Pivot Detection: The indicator includes a built-in pivot detector that identifies significant turning points (highs and lows) in the ATR line itself, signaling potential shifts in volatility.
Note on Confirmation (Lag): Pivot signals are confirmed using a lookback method. A pivot is only plotted after the Pivot Right Bars input has passed. This is essential for ensuring the signal is non-repainting but introduces an inherent lag.
Multi-Timeframe (MTF) Capability:
MTF ATR Line: The ATR line itself can be calculated on a different timeframe, with standard options to handle gaps (Fill Gaps) and prevent repainting (Wait for...).
Limitation: The Pivot detection (Calculate Pivots) is disabled if a Higher Timeframe (HTF) is selected.
Integrated Alerts: Includes alerts that trigger when a new volatility pivot (high or low) is detected in the ATR line.
DISCLAIMER
For Informational/Educational Use Only: This indicator is provided for informational and educational purposes only. It does not constitute financial, investment, or trading advice, nor is it a recommendation to buy or sell any asset.
Use at Your Own Risk: All trading decisions you make based on the information or signals generated by this indicator are made solely at your own risk.
No Guarantee of Performance: Past performance is not an indicator of future results. The author makes no guarantee regarding the accuracy of the signals or future profitability.
No Liability: The author shall not be held liable for any financial losses or damages incurred directly or indirectly from the use of this indicator.
Signals Are Not Recommendations: The alerts and visual signals (e.g., crossovers) generated by this tool are not direct recommendations to buy or sell. They are technical observations for your own analysis and consideration.

Volatility Resonance CandlesVolatility Resonance Candles visualize the dynamic interaction between price acceleration, volatility, and volume energy.
They’re designed to reveal moments when volatility expansion and directional momentum resonate — often preceding strong directional moves or reversals.
🔬 Concept
Traditional candles display direction and range, but they miss the energetic structure of volatility itself.
This indicator introduces a resonance model, where ATR ratio, price acceleration, and volume intensity combine to form a composite signal.
* ATR Resonance: compares short-term vs. long-term volatility
* Acceleration: captures the rate of price change
* Volume Energy: reinforces the move’s significance
When these components align, the candle color “resonates” — brighter, more intense candles signal stronger volatility–momentum coupling.
⚙️ Features
* Adaptive Scaling
Normalizes energy intensity dynamically across a user-defined lookback period, ensuring consistency in changing market conditions.
* Power-Law Transformation
Optional non-linear scaling (gamma) emphasizes higher-energy events while keeping low-intensity noise visually subdued.
* Divergence Mode
When enabled, colors can invert to highlight energy divergence from candle direction (e.g., bearish pressure during bullish closes).
* Customizable Styling
Full control over bullish/bearish base colors, transparency scaling, and threshold sensitivity.
🧠 Interpretation
* Bright / High-Intensity Candles → Strong alignment of volatility and directional energy.
Often signals the resonant phase of a move — acceleration backed by volatility expansion and volume participation.
* Dim / Low-Intensity Candles → Energy dispersion or consolidation.
These typically mark quiet zones, pauses, or inefficient volatility.
* Opposite-Colored Candles (if divergence mode on) → Potential inflection zones or hidden stress in the trend structure.
⚠️ Disclaimer
This script is for educational purposes only.
It does not constitute financial advice, and past performance is not indicative of future results. Always do your own research and test strategies before making trading decisions.

Uptrick: Volume Weighted BandsIntroduction
This indicator, Uptrick: Volume Weighted Bands, overlays dynamic, volume-informed trend channels directly on the chart. By fusing price and volume data through volume-weighted and exponential moving averages, the script forms a core trend line with adaptive bandwidth controlled by volatility. It is designed to help traders identify trend direction, breakout entries, and extended conditions that may warrant take-profits or pullback re-entries.
Overview
The Volume Weighted Bands system is built around a trend line calculated by averaging a Volume Weighted Moving Average (VWMA) and an Exponential Moving Average (EMA), both over a configurable lookback period. This hybrid trend baseline is then smoothed further and expanded into dynamic upper and lower bands using an Average True Range (ATR) multiplier. These bands adapt with market volatility and shift color based on prevailing price action, helping traders quickly identify bullish, bearish, or neutral conditions.
Originality and Unique Features
This script introduces originality by blending both price and volume in the core trend calculation, a technique that is more responsive than traditional moving average bands. Its multi-mode visualization (cloud, single-band, or line-only), combined with selective buy/sell signals, makes it flexible for discretionary and algorithmic strategies alike. Optional modules for take-profit signals based on z-score deviation and RSI slope, as well as buy-back detection logic with cooldown filters, offer practical tools for managing trades beyond simple entries.
Explanation of Inputs
Every user input in this script is included to give the trader control over behavior and visual presentation:
Trend Length (len): Defines the lookback window for both the VWMA and EMA, controlling the sensitivity of the core trend baseline. A lower value makes the bands more reactive, while a higher value smooths out short-term noise.
Extra Smoothing (smoothLen): Applies an additional EMA to the blended VWMA/EMA average. This second-level smoothing ensures the central trend line reacts gradually to shifts in price.
Band Width (ATR Multiplier) (bandMult): Multiplies the ATR to create the width of the upper and lower bands around the trend line. Larger values widen the bands, capturing more volatility, while smaller values narrow them.
ATR Length (atrLen): Sets the length of the ATR used in calculating band width and signal offsets. Longer values produce smoother band boundaries.
Show Buy/Sell Signals (showSignals): Toggles the primary crossover/crossunder entry signals, which are labeled when the close crosses the upper or lower band.
Visual Mode (visualMode): Allows selection between three display modes:
--> Cloud: Shows both bands and the central trend line with a shaded background.
--> Single Band: Displays only the active (upper or lower) band depending on trend state, with gradient fill to price.
--> Line Only: Shows only the trend line for a minimal visual profile.
Take Profit Signals (enableTP): Enables a z-score-based profit-taking signal system. Signals occur when price deviates significantly from the trend line and RSI confirms exhaustion.
TP Z-Score Threshold (tpThreshold): Sets the z-score deviation required to trigger a take-profit signal. Higher values reduce the frequency of signals, focusing on more extreme moves.
Re-Entries (enableBuyBack): Enables logic to signal when price reverts into the band after an initial breakout, suggesting a possible re-entry or pullback setup.
Buy Back Cooldown (bars) (buyBackCooldown): Defines a minimum bar count before a new buy-back signal is allowed, preventing rapid retriggering in choppy conditions.
Buy Offset and Sell Offset: Hidden inputs used to vertically adjust the placement of the Buy ("𝓤𝓹") and Sell ("𝓓𝓸𝔀𝓷") labels relative to the bands. These use ATR units to maintain proportionality across different instruments and timeframes.
Take-Profit Signal Module
The take-profit module uses a z-score of the distance between price and the trend line to detect extended conditions. In bullish trends, a signal appears when price is well above the band and RSI indicates exhaustion; the opposite applies for bearish conditions. A boolean flag is used to prevent retriggering until RSI resets. These signals are plotted with minimalist “X” markers near recent highs or lows, based on whether the market is extended upward or downward.
Re-Entry Logic
The re-entry system identifies instances where price momentarily dips or spikes into the opposite band but closes back inside, implying a continuation of the prevailing trend. This module can be particularly useful for traders managing entries after brief pullbacks. A built-in cooldown period helps filter out noise and prevents signal overloading during fast markets. Visual markers are shown as upward or downward arrows near the relevant candle wicks.
How to Use This Indicator
The basic usage of this indicator follows a directional, signal-driven approach. When a buy signal appears, it suggests entering a long position. The recommended stop loss placement is below the lower band, allowing for some breathing space to accommodate natural volatility. As the position progresses, take partial profits—typically 10% to 15% of the position—each time a take-profit signal (marked with an "X") is shown on the chart.
An optional feature is the buy-back signal, which can be used to re-enter after partial exits or missed entries. Utilizing this can help reduce losses during false breakouts or trend reversals by scaling in more gradually. However, it also means that in strong, clean trends, the full position may not be captured from the start, potentially reducing the total return. It is up to the trader to decide whether to enter fully on the initial signal or incrementally using buy-backs.
When a sell signal appears, the strategy advises fully exiting any long positions and immediately switching to a short position. The short trade follows the same logic: place your stop loss above the upper band with some margin, and again, take partial profits at each take-profit signal.
Visual Presentation and Signal Labels
All signals are plotted with clean, minimal labels that avoid clutter, and are color-coded using a custom palette designed to remain clear across light and dark chart themes. Bullish trends are marked in teal and bearish trends in magenta. Candles and wicks are also colored accordingly to align price action with the detected trend state. Buy and sell entries are marked with "𝓤𝓹" and "𝓓𝓸𝔀𝓷" labels.
Summary
In summary, the Uptrick: Volume Weighted Bands indicator provides a versatile, visually adaptive trend and volatility tool that can serve multiple styles of trading. Through its integration of price, volume, and volatility, along with modular take-profit and buy-back signaling, it aims to provide actionable structure across a range of market conditions.
Disclaimer
This indicator is for educational purposes only. Trading involves risk, and past performance does not guarantee future results. Always test strategies before applying them in live markets.

Volatility Dashboard (ATR-Based)Here's a brief description of what this indicator does:
- This measures volatility of currents based on ATR (Average True Range) and plots them against the smoothed ATR baseline (SMA of ATR for the same periods).
- It categorizes the market as one of the three regimes depending on the above-mentioned ratio:
- High Volatility (ratio > 1.2)
- Normal Volatility (between 0.8 and 1.2),
|- Low Volatility (ratio < 0.8, green)
- For each type of trading regime, Value Area (VA) coverage to use: for example: 60-65% in high vol trade regimes, 70% in normal trade regimes, 80-85% in low trade regimes
* What you’ll see on the chart:
- Compact dashboard in the top-right corner featuring:
- ATR (present, default length 20)
- ATR Avg (ATR baseline)
- The volatility regime identified based on the color-coded background and the coverage recommended for the VA.
Important inputs that can be adjusted:
- ATR Length (default 20) - “High/Low volatility thresholds” (default values: 1.2 – The VA coverage recommendations for each scheme (text) Purpose: - Quickly determine whether volatility is above/below average and adjust the coverage of the Value Area.
If you're using this for the GC1! Use 14 ATR Length, For ES or NQ Use Default Setting(20)

MTF K-Means Price Regimes [matteovesperi] ⚠️ The preview uses a custom example to identify support/resistance zones. due to the fact that this identifier clusterizes, this is possible. this example was set up "in a hurry", therefore it has a possible inaccuracy. When setting up the indicator, it is extremely important to select the correct parameters and double-check them on the selected history.
📊 OVERVIEW
Purpose
MTF K-Means Price Regimes is a TradingView indicator that automatically identifies and classifies the current market regime based on the K-Means machine learning algorithm. The indicator uses data from a higher timeframe (Multi-TimeFrame, MTF) to build stable classification and applies it to the working timeframe in real-time.
Key Features
✅ Automatic market regime detection — the algorithm finds clusters of similar market conditions
✅ Multi-timeframe (MTF) — clustering on higher TF, application on lower TF
✅ Adaptive — model recalculates when a new HTF bar appears with a rolling window
✅ Non-Repainting — classification is performed only on closed bars
✅ Visualization — bar coloring + information panel with cluster characteristics
✅ Flexible settings — from 2 to 10 clusters, customizable feature periods, HTF selection
━━━━━━━━━━━━━━━━━━━━━━━━━━━━━━━━━━━━━━━━━━━━━━━━━━━━━━━━━━━━━━━━━
🔬 TECHNICAL DETAILS
K-Means Clustering Algorithm
What is K-Means?
K-Means is one of the most popular clustering algorithms (unsupervised machine learning). It divides a dataset into K groups (clusters) so that similar elements are within each cluster, and different elements are between clusters.
Algorithm objective:
Minimize within-cluster variance (sum of squared distances from points to their cluster center).
How Does K-Means Work in Our Indicator?
Step 1: Data Collection
The indicator accumulates history from the higher timeframe (HTF):
RSI (Relative Strength Index) — overbought/oversold indicator
ATR% (Average True Range as % of price) — volatility indicator
ΔP% (Price Change in %) — trend strength and direction indicator
By default, 200 HTF bars are accumulated (clusterLookback parameter).
Step 2: Creating Feature Vectors
Each HTF bar is described by a three-dimensional vector:
Vector =
Step 3: Normalization (Z-Score)
All features are normalized to bring them to a common scale:
Normalized_Value = (Value - Mean) / StdDev
This is critically important, as RSI is in the range 0-100, while ATR% and ΔP% have different scales. Without normalization, one feature would dominate over others.
Step 4: K-Means++ Centroid Initialization
Instead of random selection of K initial centers, an improved K-Means++ method is used:
First centroid is randomly selected from the data
Each subsequent centroid is selected with probability proportional to the square of the distance to the nearest already selected centroid
This ensures better initial centroid distribution and faster convergence
Step 5: Iterative Optimization (Lloyd's Algorithm)
Repeat until convergence (or maxIterations):
1. Assignment step:
For each point find the nearest centroid and assign it to this cluster
2. Update step:
Recalculate centroids as the average of all points in each cluster
3. Convergence check:
If centroids shifted less than 0.001 → STOP
Euclidean distance in 3D space is used:
Distance = sqrt((RSI1 - RSI2)² + (ATR1 - ATR2)² + (ΔP1 - ΔP2)²)
Step 6: Adaptive Update
With each new HTF bar:
The oldest bar is removed from history (rolling window method)
New bar is added to history
K-Means algorithm is executed again on updated data
Model remains relevant for current market conditions
Real-Time Classification
After building the model (clusters + centroids), the indicator works in classification mode:
On each closed bar of the current timeframe, RSI, ATR%, ΔP% are calculated
Feature vector is normalized using HTF statistics (Mean/StdDev)
Distance to all K centroids is calculated
Bar is assigned to the cluster with minimum distance
Bar is colored with the corresponding cluster color
Important: Classification occurs only on a closed bar (barstate.isconfirmed), which guarantees no repainting .
Data Architecture
Persistent variables (var):
├── featureVectors - Normalized HTF feature vectors
├── centroids - Cluster center coordinates (K * 3 values)
├── assignments - Assignment of each HTF bar to a cluster
├── htfRsiHistory - History of RSI values from HTF
├── htfAtrHistory - History of ATR values from HTF
├── htfPcHistory - History of price changes from HTF
├── htfCloseHistory - History of close prices from HTF
├── htfRsiMean, htfRsiStd - Statistics for RSI normalization
├── htfAtrMean, htfAtrStd - Statistics for ATR normalization
├── htfPcMean, htfPcStd - Statistics for Price Change normalization
├── isCalculated - Model readiness flag
└── currentCluster - Current active cluster
All arrays are synchronized and updated atomically when a new HTF bar appears.
Computational Complexity
Data collection: O(1) per bar
K-Means (one pass):
- Assignment: O(N * K) where N = number of points, K = number of clusters
- Update: O(N * K)
- Total: O(N * K * I) where I = number of iterations (usually 5-20)
Example: With N=200 HTF bars, K=5 clusters, I=20 iterations:
200 * 5 * 20 = 20,000 operations (executes quickly)
━━━━━━━━━━━━━━━━━━━━━━━━━━━━━━━━━━━━━━━━━━━━━━━━━━━━━━━━━━━━━━━━━
📖 USER GUIDE
Quick Start
1. Adding the Indicator
TradingView → Indicators → Favorites → MTF K-Means Price Regimes
Or copy the code from mtf_kmeans_price_regimes.pine into Pine Editor.
2. First Launch
When adding the indicator to the chart, you'll see a table in the upper right corner:
┌─────────────────────────┐
│ Status │ Collecting HTF │
├─────────────────────────┤
│ Collected│ 15 / 50 │
└─────────────────────────┘
This means the indicator is accumulating history from the higher timeframe. Wait until the counter reaches the minimum (default 50 bars for K=5).
3. Active Operation
After data collection is complete, the main table with cluster information will appear:
┌────┬──────┬──────┬──────┬──────────────┬────────┐
│ ID │ RSI │ ATR% │ ΔP% │ Description │Current │
├────┼──────┼──────┼──────┼──────────────┼────────┤
│ 1 │ 68.5 │ 2.15 │ 1.2 │ High Vol,Bull│ │
│ 2 │ 52.3 │ 0.85 │ 0.1 │ Low Vol,Flat │ ► │
│ 3 │ 35.2 │ 1.95 │ -1.5 │ High Vol,Bear│ │
└────┴──────┴──────┴──────┴──────────────┴────────┘
The arrow ► indicates the current active regime. Chart bars are colored with the corresponding cluster color.
Customizing for Your Strategy
Choosing Higher Timeframe (HTF)
Rule: HTF should be at least 4 times higher than the working timeframe.
| Working TF | Recommended HTF |
|------------|-----------------|
| 1 min | 15 min - 1H |
| 5 min | 1H - 4H |
| 15 min | 4H - D |
| 1H | D - W |
| 4H | D - W |
| D | W - M |
HTF Selection Effect:
Lower HTF (closer to working TF): More sensitive, frequently changing classification
Higher HTF (much larger than working TF): More stable, long-term regime assessment
Number of Clusters (K)
K = 2-3: Rough division (e.g., "uptrend", "downtrend", "flat")
K = 4-5: Optimal for most cases (DEFAULT: 5)
K = 6-8: Detailed segmentation (requires more data)
K = 9-10: Very fine division (only for long-term analysis with large windows)
Important constraint:
clusterLookback ≥ numClusters * 10
I.e., for K=5 you need at least 50 HTF bars, for K=10 — at least 100 bars.
Clustering Depth (clusterLookback)
This is the rolling window size for building the model.
50-100 HTF bars: Fast adaptation to market changes
200 HTF bars: Optimal balance (DEFAULT)
500-1000 HTF bars: Long-term, stable model
If you get an "Insufficient data" error:
Decrease clusterLookback
Or select a lower HTF (e.g., "4H" instead of "D")
Or decrease numClusters
Color Scheme
Default 10 colors:
Red → Often: strong bearish, high volatility
Orange → Transition, medium volatility
Yellow → Neutral, decreasing activity
Green → Often: strong bullish, high volatility
Blue → Medium bullish, medium volatility
Purple → Oversold, possible reversal
Fuchsia → Overbought, possible reversal
Lime → Strong upward momentum
Aqua → Consolidation, low volatility
White → Undefined regime (rare)
Important: Cluster colors are assigned randomly at each model recalculation! Don't rely on "red = bearish". Instead, look at the description in the table (RSI, ATR%, ΔP%).
You can customize colors in the "Colors" settings section.
━━━━━━━━━━━━━━━━━━━━━━━━━━━━━━━━━━━━━━━━━━━━━━━━━━━━━━━━━━━━━━━━━
⚙️ INDICATOR PARAMETERS
Main Parameters
Higher Timeframe (htf)
Type: Timeframe selection
Default: "D" (daily)
Description: Timeframe on which the clustering model is built
Recommendation: At least 4 times larger than your working TF
Clustering Depth (clusterLookback)
Type: Integer
Range: 50 - 2000
Default: 200
Description: Number of HTF bars for building the model (rolling window size)
Recommendation:
- Increase for more stable long-term model
- Decrease for fast adaptation or if there's insufficient historical data
Number of Clusters (K) (numClusters)
Type: Integer
Range: 2 - 10
Default: 5
Description: Number of market regimes the algorithm will identify
Recommendation:
- K=3-4 for simple strategies (trending/ranging)
- K=5-6 for universal strategies
- K=7-10 only when clusterLookback ≥ 100*K
Max K-Means Iterations (maxIterations)
Type: Integer
Range: 5 - 50
Default: 20
Description: Maximum number of algorithm iterations
Recommendation:
- 10-20 is sufficient for most cases
- Increase to 30-50 if using K > 7
Feature Parameters
RSI Period (rsiLength)
Type: Integer
Default: 14
Description: Period for RSI calculation (overbought/oversold feature)
Recommendation:
- 14 — standard
- 7-10 — more sensitive
- 20-25 — more smoothed
ATR Period (atrLength)
Type: Integer
Default: 14
Description: Period for ATR calculation (volatility feature)
Recommendation: Usually kept equal to rsiLength
Price Change Period (pcLength)
Type: Integer
Default: 5
Description: Period for percentage price change calculation (trend feature)
Recommendation:
- 3-5 — short-term trend
- 10-20 — medium-term trend
Visualization
Show Info Panel (showDashboard)
Type: Checkbox
Default: true
Description: Enables/disables the information table on the chart
Cluster Color 1-10
Type: Color selection
Description: Customize colors for visual cluster distinction
Recommendation: Use contrasting colors for better readability
━━━━━━━━━━━━━━━━━━━━━━━━━━━━━━━━━━━━━━━━━━━━━━━━━━━━━━━━━━━━━━━━━
📊 INTERPRETING RESULTS
Reading the Information Table
┌────┬──────┬──────┬──────┬──────────────┬────────┐
│ ID │ RSI │ ATR% │ ΔP% │ Description │Current │
├────┼──────┼──────┼──────┼──────────────┼────────┤
│ 1 │ 68.5 │ 2.15 │ 1.2 │ High Vol,Bull│ │
│ 2 │ 52.3 │ 0.85 │ 0.1 │ Low Vol,Flat │ ► │
│ 3 │ 35.2 │ 1.95 │ -1.5 │ High Vol,Bear│ │
│ 4 │ 45.0 │ 1.20 │ -0.3 │ Low Vol,Bear │ │
│ 5 │ 72.1 │ 3.05 │ 2.8 │ High Vol,Bull│ │
└────┴──────┴──────┴──────┴──────────────┴────────┘
"ID" Column
Cluster number (1-K). Order doesn't matter.
"RSI" Column
Average RSI value in the cluster (0-100):
< 30: Oversold zone
30-45: Bearish sentiment
45-55: Neutral zone
55-70: Bullish sentiment
> 70: Overbought zone
"ATR%" Column
Average volatility in the cluster (as % of price):
< 1%: Low volatility (consolidation, narrow range)
1-2%: Normal volatility
2-3%: Elevated volatility
> 3%: High volatility (strong movements, impulses)
Compared to the average volatility across all clusters to determine "High Vol" or "Low Vol".
"ΔP%" Column
Average price change in the cluster (in % over pcLength period):
> +0.05%: Bullish regime
-0.05% ... +0.05%: Flat (sideways movement)
< -0.05%: Bearish regime
"Description" Column
Automatic interpretation:
"High Vol, Bull" → Strong upward momentum, high activity
"Low Vol, Flat" → Consolidation, narrow range, uncertainty
"High Vol, Bear" → Strong decline, panic, high activity
"Low Vol, Bull" → Slow growth, low activity
"Low Vol, Bear" → Slow decline, low activity
"Current" Column
Arrow ► shows which cluster the last closed bar of your working timeframe is in.
Typical Cluster Patterns
Example 1: Trend/Flat Division (K=3)
Cluster 1: RSI=65, ATR%=2.5, ΔP%=+1.5 → Bullish trend
Cluster 2: RSI=50, ATR%=0.8, ΔP%=0.0 → Flat/Consolidation
Cluster 3: RSI=35, ATR%=2.3, ΔP%=-1.4 → Bearish trend
Strategy: Open positions when regime changes Flat → Trend, avoid flat.
Example 2: Volatility Breakdown (K=5)
Cluster 1: RSI=72, ATR%=3.5, ΔP%=+2.5 → Strong bullish impulse (high risk)
Cluster 2: RSI=60, ATR%=1.5, ΔP%=+0.8 → Moderate bullish (optimal entry point)
Cluster 3: RSI=50, ATR%=0.7, ΔP%=0.0 → Flat
Cluster 4: RSI=40, ATR%=1.4, ΔP%=-0.7 → Moderate bearish
Cluster 5: RSI=28, ATR%=3.2, ΔP%=-2.3 → Strong bearish impulse (panic)
Strategy: Enter in Cluster 2 or 4, avoid extremes (1, 5).
Example 3: Mixed Regimes (K=7+)
With large K, clusters can represent condition combinations:
High RSI + Low volatility → "Quiet overbought"
Neutral RSI + High volatility → "Uncertainty with high activity"
Etc.
Requires individual analysis of each cluster.
Regime Changes
Important signal: Transition from one cluster to another!
Trading situation examples:
Flat → Bullish trend → Buy signal
Bullish trend → Flat → Take profit, close longs
Flat → Bearish trend → Sell signal
Bearish trend → Flat → Close shorts, wait
You can build a trading system based on the current active cluster and transitions between them.
━━━━━━━━━━━━━━━━━━━━━━━━━━━━━━━━━━━━━━━━━━━━━━━━━━━━━━━━━━━━━━━━━
💡 USAGE EXAMPLES
Example 1: Scalping with HTF Filter
Task: Scalping on 5-minute charts, but only enter in the direction of the daily regime.
Settings:
Working TF: 5 min
HTF: D (daily)
K: 3 (simple division)
clusterLookback: 100
Logic:
IF current cluster = "Bullish" (ΔP% > 0.5)
→ Look for long entry points on 5M
IF current cluster = "Bearish" (ΔP% < -0.5)
→ Look for short entry points on 5M
IF current cluster = "Flat"
→ Don't trade / reduce risk
Example 2: Swing Trading with Volatility Filtering
Task: Swing trading on 4H, enter only in regimes with medium volatility.
Settings:
Working TF: 4H
HTF: D (daily)
K: 5
clusterLookback: 200
Logic:
Allowed clusters for entry:
- ATR% from 1.5% to 2.5% (not too quiet, not too chaotic)
- ΔP% with clear direction (|ΔP%| > 0.5)
Prohibited clusters:
- ATR% > 3% → Too risky (possible gaps, sharp reversals)
- ATR% < 1% → Too quiet (small movements, commissions eat profit)
Example 3: Portfolio Rotation
Task: Managing a portfolio of multiple assets, allocate capital depending on regimes.
Settings:
Working TF: D (daily)
HTF: W (weekly)
K: 4
clusterLookback: 100
Logic:
For each asset in portfolio:
IF regime = "Strong trend + Low volatility"
→ Increase asset weight in portfolio (40-50%)
IF regime = "Medium trend + Medium volatility"
→ Standard weight (20-30%)
IF regime = "Flat" or "High volatility without trend"
→ Minimum weight or exclude (0-10%)
Example 4: Combining with Other Indicators
MTF K-Means as a filter:
Main strategy: MA Crossover
Filter: MTF K-Means on higher TF
Rule:
IF MA_fast > MA_slow AND Cluster = "Bullish regime"
→ LONG
IF MA_fast < MA_slow AND Cluster = "Bearish regime"
→ SHORT
ELSE
→ Don't trade (regime doesn't confirm signal)
This dramatically reduces false signals in unsuitable market conditions.
━━━━━━━━━━━━━━━━━━━━━━━━━━━━━━━━━━━━━━━━━━━━━━━━━━━━━━━━━━━━━━━━━
📈 OPTIMIZATION RECOMMENDATIONS
Optimal Settings for Different Styles
Day Trading
Working TF: 5M - 15M
HTF: 1H - 4H
numClusters: 4-5
clusterLookback: 100-150
Swing Trading
Working TF: 1H - 4H
HTF: D
numClusters: 5-6
clusterLookback: 150-250
Position Trading
Working TF: D
HTF: W - M
numClusters: 4-5
clusterLookback: 100-200
Scalping
Working TF: 1M - 5M
HTF: 15M - 1H
numClusters: 3-4
clusterLookback: 50-100
Backtesting
To evaluate effectiveness:
Load historical data (minimum 2x clusterLookback HTF bars)
Apply the indicator with your settings
Study cluster change history:
- Do changes coincide with actual trend transitions?
- How often do false signals occur?
Optimize parameters:
- If too much noise → increase HTF or clusterLookback
- If reaction too slow → decrease HTF or increase numClusters
Combining with Other Techniques
Regime-Based Approach:
MTF K-Means (regime identification)
↓
+---+---+---+
| | | |
v v v v
Trend Flat High_Vol Low_Vol
↓ ↓ ↓ ↓
Strategy_A Strategy_B Don't_trade
Examples:
Trend: Use trend-following strategies (MA crossover, Breakout)
Flat: Use mean-reversion strategies (RSI, Bollinger Bands)
High volatility: Reduce position sizes, widen stops
Low volatility: Expect breakout, don't open positions inside range
━━━━━━━━━━━━━━━━━━━━━━━━━━━━━━━━━━━━━━━━━━━━━━━━━━━━━━━━━━━━━━━━━
📞 SUPPORT
Report an Issue
If you found a bug or have a suggestion for improvement:
Describe the problem in as much detail as possible
Specify your indicator settings
Attach a screenshot (if possible)
Specify the asset and timeframe where the problem is observed

Volume Order Block Scanner [BOSWaves]Volume Order Block Scanner - Dynamic Detection of High-Volume Supply and Demand Zones
Overview
The Volume Order Block Scanner introduces a refined approach to institutional zone mapping, combining volume-weighted order flow, structural displacement, and ATR-based proportionality to identify regions of aggressive participation from large entities.
Unlike static zone mapping or simplistic body-size filters, this framework dynamically evaluates each candle through a multi-layer model of relative volume, candle structure, and volatility context to isolate genuine order block formations while filtering out market noise.
Each identified zone represents a potential institutional footprint, defined by significant volume surges and efficient body-to-ATR relationships that indicate purposeful positioning. Once mapped, each order block is dynamically adjusted for volatility and tracked throughout its lifecycle - from creation to mitigation to potential invalidation - producing an evolving liquidity map that adapts with price.
This adaptive behavior allows traders to visualize where liquidity was absorbed and where it remains unfilled, revealing the structural foundation of institutional intent across timeframes.
Theoretical Foundation
At its core, the Volume Order Block Scanner is built on the interaction between volume displacement and structural imbalance. Traditional order block systems often rely on fixed candle formations or simple engulfing logic, neglecting the fundamental driver of institutional activity: volume concentration relative to volatility.
This framework redefines that approach. Each candle is filtered through two comparative ratios:
Relative Volume Ratio (RVR) - the candle’s volume compared to its rolling average, confirming genuine transactional surges.
Body-ATR Ratio (BAR) - a measure of displacement efficiency relative to recent volatility, ensuring structural strength.
Only when both conditions align is an order block validated, marking a displacement event significant enough to create a lasting imbalance.
By embedding this logic within a volatility-adjusted environment, the system maintains scalability across asset classes and volatility regimes - equally effective in crypto, forex, or index markets.
How It Works
The Volume Order Block Scanner operates through a structured multi-stage process:
Displacement Detection - Identifies candles whose body and volume exceed dynamic thresholds derived from ATR and rolling volume averages. These represent the origin points of institutional aggression.
Zone Construction - Each qualified candle generates an order block with ATR-proportional dimensions to ensure consistency across instruments and timeframes. The zone includes two regions: Body Zone (the precise initiation point of displacement) and Wick Imbalance (the residual inefficiency representing unfilled liquidity).
Lifecycle Tracking - Each zone is continuously monitored for market interaction. Reactions within a defined window are classified as respected, mitigated, or invalidated, giving traders a data-driven sense of ongoing institutional relevance.
Volume Confirmation Layer - Reinforces signal integrity by ensuring that all detected blocks correspond with meaningful increases in transactional activity.
Temporal Decay Control - Zones that remain untested beyond a set period gradually lose visual and analytical weight, maintaining chart clarity and contextual precision.
Interpretation
The Volume Order Block Scanner visualizes how institutional participants interact with the market through zones of accumulation and distribution.
Bullish order blocks denote demand imbalances where price displaced upward under high volume; bearish order blocks signify supply regions formed by concentrated selling pressure.
Price revisiting these areas often reflects institutional re-entry or liquidity rebalancing, offering actionable insights for both continuation and reversal scenarios.
By continuously monitoring interaction and expiry, the framework enables traders to distinguish between active institutional footprints and historical liquidity artifacts.
Strategy Integration
The Volume Order Block Scanner integrates naturally into advanced structural and order-flow methodologies:
Liquidity Mapping : Identify high-volume regions that are likely to influence future price reactions.
Break-of-Structure Confirmation : Validate BOS and CHOCH signals through aligned order block behavior.
Volume Confluence : Combine with BOSWaves volume or momentum indicators to confirm real institutional intent.
Smart-Money Frameworks : Utilize order block retests as precision entry zones within SMC-based setups.
Trend Continuation : Filter zones in line with higher-timeframe bias to maintain directional integrity.
Technical Implementation Details
Core Engine : Dual-filter mechanism using Relative Volume Ratio (RVR) and Body-ATR Ratio (BAR).
Volatility Framework : ATR-based scaling for cross-asset proportionality.
Zone Composition : Body and wick regions plotted independently for visual clarity of imbalance.
Lifecycle Logic : Real-time monitoring of reaction, mitigation, and invalidation states.
Directional Coloring : Distinct bullish and bearish shading with adjustable transparency.
Computation Efficiency : Lightweight structure suitable for multi-timeframe or multi-asset environments.
Optimal Application Parameters
Timeframe Guidance:
5m - 15m : Reactive intraday zones for short-term liquidity engagement.
1H - 4H : Medium-term structures for swing or intraday trend mapping.
Daily - Weekly : Macro accumulation and distribution footprints.
Suggested Configuration:
Relative Volume Threshold : 1.5× - 2.0× average volume.
Body-ATR Threshold : 0.8× - 1.2× for valid displacement.
Zone Expiry : 5 - 10 bars for intraday use, 15 - 30 for swing/macro contexts.
Parameter optimization should be asset-specific, tuned to volatility conditions and liquidity depth.
Performance Characteristics
High Effectiveness:
Markets exhibiting clear displacement and directional flow.
Environments with consistent volume expansion and liquidity inefficiencies.
Reduced Effectiveness:
Range-bound markets with frequent false impulses.
Low-volume sessions lacking institutional participation.
Integration Guidelines
Confluence Framework : Pair with structure-based BOS or liquidity tools for validation.
Risk Management : Treat active order blocks as contextual areas of interest, not guaranteed reversal points.
Multi-Timeframe Logic : Derive bias from higher-timeframe blocks and execute from refined lower-timeframe structures.
Volume Verification : Confirm each reaction with concurrent volume acceleration to avoid false liquidity cues.
Disclaimer
The Volume Order Block Scanner is a quantitative mapping framework designed for professional traders and analysts. It is not a predictive or guaranteed system of profit.
Performance depends on correct configuration, market conditions, and disciplined risk management. BOSWaves recommends using this indicator as part of a comprehensive analytical process - integrating structural, volume, and liquidity context for accurate interpretation.

THAIT Moving Averages Tight within # ATR EMA SMA convergence
THAIT(tight) indicator is a powerful tool for identifying moving average convergence in price action. This indicator plots four user-defined moving averages (EMA or SMA). It highlights moments when the MAs converge within a user specified number of ATRs, adjusted by the 14-period ATR, signaling potential trend shifts or consolidation.
A convergence is flagged when MA1 is the maximum, the spread between MAs is tight, and the price is above MA1, excluding cases where the longest MA (MA4) is the highest. The indicator alerts and visually marks convergence zones with a shaded green background, making it ideal for traders seeking precise entry or exit points.

EdgeBox: MA DistanceEdgeBox: MA Distance adds a clean HUD showing the percentage distance from the current close to your selected moving averages (default: SMA 100/150/200/250). Values are positive when MAs are above price and negative when below. Also includes ATR% (volatility) and RSI(14). Fully customizable: corner position, font sizes, and text/background colors. A fast context panel for trend and volatility at a glance.

ATR Trailing Stop with Entry Date & First-Day MultiplierATR based trailing stop based on a X post of Aksel Kibar.

Market Profile based Support/ResistanceBrought to you by Stock Kaka - Your trading sidekick 🦜📈 - pay your visit at stockkaka.my.canva.site or find us on X #StockKaka
📊 What This Indicator Does
Ever wish the market would just tell you where the important levels are? Well, buckle up, because this indicator is like having a market whisperer on your chart!
Based on cutting-edge hierarchical market structure analysis (fancy words for "smart support and resistance"), this bad boy uses ATR-based Directional Change to identify turning points that actually matter. No more guessing where price might bounce or break—let the algorithm do the heavy lifting while you sip your coffee ☕
🎯 The Five Levels Explained (From Noisy to Mighty)
Think of these levels like a pyramid of importance. Level 0 is your chatty friend who notices everything, while Level 4 is the wise oracle who only speaks when it really matters.
Level 0: The Hyperactive Scout 🐿️
What it does: Catches every little zigzag in price using ATR confirmation
Significance: Very short-term, intraday noise
Best for: Scalpers who love action every few minutes
Trader Type: "I refresh my chart 100 times an hour"
Reliability: ⭐⭐ (It's enthusiastic but easily excitable)
Level 1: The Day Trader's Buddy 🎯
What it does: Filters Level 0 to show minor swing highs/lows
Significance: Intraday support/resistance, hourly structure
Best for: Day traders, scalpers looking for better entries
Trader Type: "I close all positions before dinner"
Reliability: ⭐⭐⭐ (Solid for quick moves)
Level 2: The Swing Trader's Sweet Spot 🎪
What it does: Identifies multi-day to weekly structure points
Significance: Intermediate support/resistance where battles happen
Best for: Swing traders, position traders
Trader Type: "I hold for days, not minutes"
Reliability: ⭐⭐⭐⭐ (Now we're talking real structure!)
Level 3: The Big Money Magnet 💰
What it does: Shows major market structure—where the whales play
Significance: Weekly to monthly levels, institutional zones
Best for: Position traders, trend followers
Trader Type: "I think in weeks and months, not hours"
Reliability: ⭐⭐⭐⭐⭐ (These levels have gravitational pull!)
Level 4: The Market Prophet 🔮
What it does: Reveals ultra-major turning points (think: quarterly/yearly pivots)
Significance: Long-term macro structure, investment-grade levels
Best for: Investors, long-term position traders
Trader Type: "Warren Buffett is my spirit animal"
Reliability: ⭐⭐⭐⭐⭐⭐ (When these break, market's rewrite the story)
⚙️ Parameter Setup Guide (The Secret Sauce)
The magic ingredient is the ATR Lookback Period—think of it as teaching the indicator your timeframe's "dialect." Here's your cheat sheet:
2-Minute Chart ⚡
ATR Lookback: 720 (24 hours of 2-min bars)
Who uses this: Crypto degens, futures scalpers, adrenaline junkies
Show Levels: L0, L1, L2 (L3+ won't budge much)
Pro Tip: Enable only L1 and L2 or your chart will look like spaghetti
5-Minute Chart 🏃
ATR Lookback: 288 (24 hours of 5-min bars)
Who uses this: Active day traders, news traders
Show Levels: L1, L2, L3
Pro Tip: L2 is your best friend here—perfect for intraday swings
15-Minute Chart 📈
ATR Lookback: 96 (24 hours of 15-min bars)
Who uses this: Swing traders, patient day traders
Show Levels: L1, L2, L3
Pro Tip: This is the "Goldilocks zone"—not too fast, not too slow
1-Hour Chart ⏰
ATR Lookback: 168 (1 week of hourly bars)
Who uses this: Swing traders, position traders
Show Levels: L2, L3, L4
Pro Tip: L3 levels here are like magnets for price action
Daily Chart 📅
ATR Lookback: 30 to 50 (1-2 months)
Who uses this: Investors, long-term traders, people with patience
Show Levels: L2, L3, L4
Pro Tip: L4 on dailies = "Don't fight this level, respect it"
🎨 How to Use This Thing
Add to Chart - Duh! 😄
Set Your ATR Lookback - Use the guide above (don't wing it!)
Enable Relevant Levels - Less is more! Turn off levels that just clutter
Watch the Magic - See horizontal lines appear at key S/R zones
Check the Table - Top-right corner shows current levels (fancy!)
Set Alerts - Get notified when price approaches or breaks levels
Trading Strategies 🎲
The Bounce Play:
Price approaches Level 2 or 3 support → Look for bullish reversal signals
Take profit at the next level resistance
Stop loss just below the support level
The Breakout Play:
Price breaks through Level 2/3 resistance with volume → Go long
Next level becomes your target
Failed breakout? Level becomes resistance again (classic fake-out)
The Confluence Play:
When Level 3 aligns with your favorite indicator (RSI oversold, moving average, Fibonacci) → Chef's kiss! 👨🍳💋
These multi-confirmation setups are where the money lives
🚨 Important Notes (Read This or Blame Yourself Later)
⚠️ This indicator REPAINTS on the current bar until an extreme is confirmed. That's not a bug, it's how directional change works. The past levels are solid as a rock, but the pending one is still... pending.
⚠️ More levels ≠ Better results. Showing all 5 levels is like having 5 GPS apps shouting directions at once. Pick 2-3 levels max.
⚠️ ATR Lookback matters! Wrong setting = garbage results. Use the guide above or experiment carefully.
⚠️ Volatile markets (crypto, meme stocks) work GREAT with this. Choppy, range-bound markets? Meh.
⚠️ Combine with other tools! This shows you WHERE, not WHEN. Use momentum indicators, volume, or your favorite chicken entrails for timing 🐔
🦜 Final Word from Stock Kaka
Remember: Indicators don't make money, traders do. This tool shows you where the market has historically respected structure. What you do with that info? That's on you, champ!
Use proper risk management, don't YOLO your rent money, and may your stops never get hunted 🎯
Trade smart, trade safe, and let Stock Kaka be your guide!
📝 Credits
Algorithm: neurotrader888 (Python implementation)
Pine Script Conversion: Your friendly neighborhood Stock Kaka team!!
Inspiration: Ginger chai, market inefficiencies, and a dash of chaos
📌 Tags
support-and-resistance market-structure atr directional-change multi-timeframe swing-trading day-trading levels hierarchical-analysis algo-trading

DTR & ATR with live zonesThis indicator is designed to help traders gauge the day's volatility in real-time. It compares the current Daily True Range (DTR)—the distance between the session's high and low—to the historical Average True Range (ATR).
The main purpose is to project potential price levels where the market might reach based on its average volatility. These levels (100% ATR, 150%, 200%, etc.) can be used as price targets. For instance, if you're in a long trade, you might consider taking partial or full profits as the price approaches these upper ATR extension levels. The indicator is highly customisable, allowing you to control the appearance of the ATR lines, zones, and labels to fit your charting preferences.
Core Concepts: ATR and DTR
To use this indicator effectively, it's important to understand its two main components:
Average True Range (ATR): This is a classic technical analysis indicator that measures market volatility. It calculates the average range of price movement over a specific period (e.g., 14 days). A higher ATR means the price is, on average, moving more, while a low ATR indicates less volatility. This script uses a higher timeframe ATR (e.g., Daily) to establish a stable volatility baseline for the current trading day.
Daily True Range (DTR): This is simply the difference between the current trading session's highest high and lowest low (session high - session low). It tells you how much the price has actually moved so far today.
The indicator's logic revolves around comparing the live, unfolding DTR to the historical, baseline ATR. An on-screen table conveniently shows this comparison as a percentage, to show how volatile the day has been.
How It Works: The Dynamic & Locked Mechanism
The most clever part of this indicator is how it draws the ATR levels. It operates in two distinct phases during the trading session:
Phase 1: Dynamic Expansion (Before DTR meets ATR)
At the start of the session, the DTR is small. The indicator calculates the remaining range needed to "complete" the 100% ATR level (difference = avg_atr - dtr). It then adds this remaining amount to the session high and subtracts it from the session low. This creates a "floating" 100% ATR range that expands dynamically as the session high or low is extended.
Phase 2: The Lock-in (After DTR meets or exceeds ATR)
Once the day's range (DTR) becomes equal to or greater than the avg_atr, the day has met its "expected" volatility. At this point, the levels lock in place. The indicator intelligently determines the anchor point for the locked range.
Once this primary 100% ATR range is established (either dynamically or locked), the script projects the other levels (150%, 200%, 250%, and 300%) by adding or subtracting multiples of the avg_atr from this base.
How to Use It for Trading
The primary use of this indicator is to set logical, volatility-based price targets.
Setting Profit Targets: If you enter a long position, the upper ATR levels (100%, 150%, 200%) serve as excellent areas to consider taking profits. A move to the 200% or 250% level often signifies an overextended or "exhaustion" move, making it a high-probability exit zone. For short positions, the lower ATR levels serve the same purpose.
Assessing Intraday Momentum: The on-screen table tells you how much of the expected daily range has been used. If it's early in the session and the DTR is only at 30% of the ATR, you can anticipate more significant price movement is likely to come. Conversely, if the DTR is already at 150% of ATR, the bulk of the day's move may already be complete.
Mean Reversion Signals: If the price pushes to an extreme level (e.g., 250% ATR) and shows signs of stalling (e.g., bearish divergence on an oscillator), it could signal a potential reversal or pullback, offering an opportunity for a counter-trend trade.
Key Settings
ATR Length & Smoothing Type: These settings control how the baseline ATR is calculated. The default 14 period and RMA smoothing are standard, but you can adjust them to your preference.
Session Settings: This is crucial. You must set the Market Session and Time Zone to match the primary trading hours of the asset you are analysing (e.g., "0930-1600" for the NYSE session).
Show Lines / Show Labels / Show Zones: The script gives you full control over the visual display. You can toggle each ATR level's lines, labels, and background zones individually to avoid a cluttered chart and focus only on the levels that matter to your strategy.
