Average Candle SizeI created this indicator because I couldn't find a simple tool that calculates just the average candle size without additional complexity. Built for traders who want a straightforward volatility measure they can fully understand. How it works:
1. Calculate high-low for each candle
2. Sum all results
3. Divide by the total number of candles
Simple math to get the average candle size of the period specified in Length.
Averagerange

ICT ADR/AWR/AMR Levels | Trade Symmetry🌟 ICT ADR/AWR/AMR Levels
📋 Overview
This advanced technical analysis tool calculates and displays Average Daily Range (ADR), Average Weekly Range (AWR), and Average Monthly Range (AMR) levels. The indicator incorporates smart detection technology that automatically maintains monthly level visibility when historical data becomes unavailable.
✨ Key Features
🕒 Precise Time Alignment
True Daily Opens (TDO) aligned with 00:00 UTC
True Weekly Opens (TWO) at 00:00 UTC (configurable Monday/Sunday start)
True Monthly Opens (TMO) at 00:00 UTC on month start
Customizable period start times and parameters
📊 Comprehensive Multi-Timeframe Analysis
Daily Levels (ADR): Base level with multiple extensions including Fibonacci ratios
Weekly Levels (AWR): Weekly range projections and key levels
Monthly Levels (AMR): Monthly range calculations with automatic fallback system
🔄 Intelligent Level Management
Smart Detection: Automatically switches between historical and current monthly levels
Continuous Visibility: Ensures reference levels remain visible regardless of data availability
Seamless Operation: No manual adjustment needed for level transitions
⚙️ Extensive Customization
Adjustable lookback periods for all timeframes
Independent control over each level type and extension
Complete visual customization (colors, styles, widths)
Flexible labeling and display options
Configurable vertical separation lines
🏷️ Advanced Display Options
Clean, organized label placement
Optional price display in labels
Historical period tracking
Overlapping label merging capability
Adjustable label sizing and positioning
🚀 How to Use
Initial Setup: Enable desired timeframes (Daily/Weekly/Monthly)
Range Configuration: Set appropriate averaging periods for each timeframe
Level Selection: Choose which extension levels to display
Visual Settings: Customize colors and styles to match your trading workspace
Automatic Operation: The indicator intelligently manages level transitions
💡 Practical Applications
Identify potential support and resistance areas across multiple timeframes
Establish realistic profit targets based on historical volatility
Plan trade entries and exits around significant time-based levels
Analyze market volatility patterns across different time horizons
Incorporate institutional trading concepts into your analysis
ACR(Average Candle Range) With TargetsWhat is ACR?
The Average Candle Range (ACR) is a custom volatility metric that calculates the mean distance between the high and low of a set number of past candles. ACR focuses only on the actual candle range (high - low) of specific past candles on a chosen timeframe.
This script calculates and visualizes the Average Candle Range (ACR) over a user-defined number of candles on a custom timeframe. It displays a table of recent range values, plots dynamic bullish and bearish target levels, and marks the start of each new candle with a vertical line. All calculations update in real time as price action develops. This script was inspired by the “ICT ADR Levels - Judas x Daily Range Meter°” by toodegrees.
Key Features
Custom Timeframe Selection: Choose any timeframe (e.g., 1D, 4H, 15m) for analysis.
User-Defined Lookback: Calculate the average range across 1 to 10 previous candles.
Dynamic Targets:
Bullish Target: Current candle low + ACR.
Bearish Target: Current candle high – ACR.
Live Updates: Targets adjust intrabar as highs or lows change during the current candle.
Candle Start Markers: Vertical lines denote the open of each new candle on the selected timeframe.
Floating Range Table:
Displays the current ACR value.
Lists individual ranges for the previous five candles.
Extend Target Lines: Choose to extend bullish and bearish target levels fully across the screen.
Global Visibility Controls: Toggle on/off all visual elements (targets, vertical lines, and table) for a cleaner view.
How It Works
At each new candle on the user-selected timeframe, the script:
Draws a vertical line at the candle’s open.
Recalculates the ACR based on the inputted previous number of candles.
Plots target levels using the current candle's developing high and low values.
Limitation
Once the price has already moved a full ACR in the opposite direction from your intended trade, the associated target loses its practical value. For example, if you intended to trade long but the bearish ACR target is hit first, the bullish target is no longer a reliable reference for that session.
Use Case
This tool is designed for traders who:
Want to visualize the average movement range of candles over time.
Use higher or lower timeframe candles as structural anchors.
Require real-time range-based price levels for intraday or swing decision-making.
This script does not generate entry or exit signals. Instead, it supports range awareness and target projection based on historical candle behavior.
Key Difference from Similar Tools
While this script was inspired by “ICT ADR Levels - Judas x Daily Range Meter°” by toodegrees, it introduces a major enhancement: the ability to customize the timeframe used for calculating the range. Most ADR or candle-range tools are locked to a single timeframe (e.g., daily), but this version gives traders full control over the analysis window. This makes it adaptable to a wide range of strategies, including intraday and swing trading, across any market or asset.

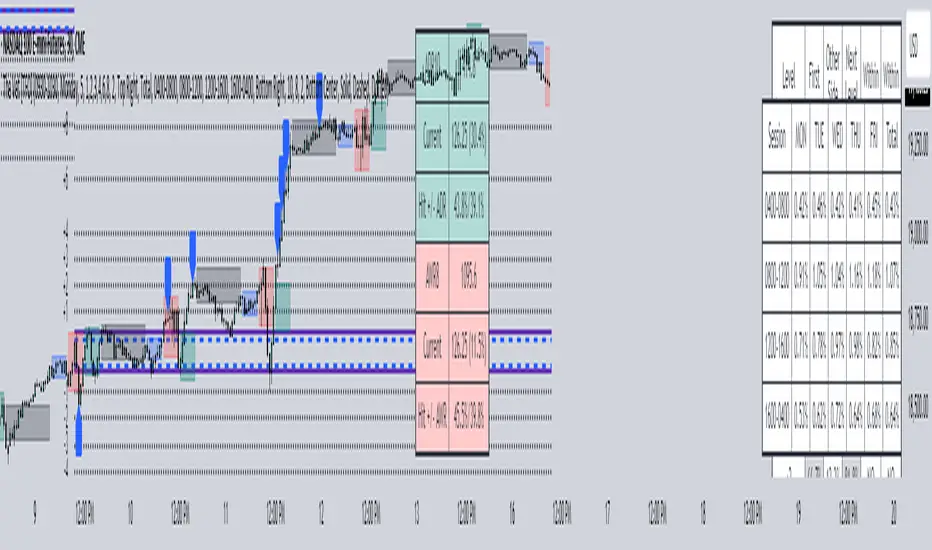
The Vet [TFO]In collaboration with @mickey1984 , "The Vet" was created to showcase various statistical measures of price.
The first core measurement utilizes the Defining Range (DR) concept on a weekly basis. For example, we might track the session from 09:30-10:30 on Mondays to get the DR high, DR low, IDR high, and IDR low. The DR high and low are the highest high and lowest low of the session, respectively, whereas the IDR high and low would be the highest candle body level (open or close) and lowest candle body level, respectively, during this window of time.
From this data, we use the IDR range (from IDR high to IDR low) to extrapolate several, custom projections of this range from its high and low so that we can collect data on how often these levels are hit, from the close of one DR session to the open of the next one.
This information is displayed in the Range Projection Table with a few main columns of information:
- The leftmost column indicates each level that is projected from the IDR range, where (+) indicates a projection above the range high, and (-) indicates a projection below the range low
- The "First Touch" column indicates how often price has reached these levels in the past at any point until the next weekly DR session
- The "Other Side Touch" column indicates how often price has reached a given level, then reversed to hit the opposing level of the same magnitude. For example, the above chart shows that if price hit the +1 projection, ~33% of instances also hit the -1 projection before the next weekly DR session. For this reason, the probabilities will be the same for projection levels of the same but opposite magnitude (+1 would be the same as -1, +3 would be the same as -3, etc.)
- The "Next Level Touch" column provides insight into how often price reaches the next greatest projection level. For example, in the above chart, the red box in the projection table is highlighting that once price hits the -2 projection, ~86% of instances reached the -3 projection before the next weekly DR session
- The last columns, "Within ADR" and "Within AWR" show if any of the projection levels are within the current Average Daily Range, or Average Weekly Range, respectively, which can both be enabled from the Average Range section
The next section, Distributions, primarily measures and displays the average price movements from specified intraday time windows. The option to Show Distribution Boxes will overlay a box showing each respective session's average range, while adjusting itself to encapsulate the price action of that session until the average range is met/exceeded. Users can choose to display the range average by Day of Week, or the Total average from all days. Values for average ranges can either be shown as point or percent values. We can also show a table to display this information about price's average ranges for each given session, and show labels displaying the current range vs its average.
The final section, Average Range, simply offers the ability to plot the Average Daily Range (ADR) and Average Weekly Range (AWR) of a specified length. An ADR of 10 for example would take the average of the last 10 days, from high to low, while an AWR of 10 would take the average of the last 10 weeks (if the current chart provides enough data to support this). Similarly, we can also show the Average Range Table to indicate what these ADR/AWR values are, what our current range is and how it compares to those values, as well as some simple statistics on how often these levels are hit. As an example, "Hit +/- ADR: 40%/35%" in this table would indicate that price has hit the upper ADR limit 40% of the time, and the lower limit 35% of the time, for the amount of data available on the current chart.
Average Session Range [QuantVue]The Average Session Range or ASR is a tool designed to find the average range of a user defined session over a user defined lookback period.
Not only is this indicator is useful for understanding volatility and price movement tendencies within sessions, but it also plots dynamic support and resistance levels based on the ASR.
The average session range is calculated over a specific period (default 14 sessions) by averaging the range (high - low) for each session.
Knowing what the ASR is allows the user to determine if current price action is normal or abnormal.
When a new session begins, potential support and resistance levels are calculated by breaking the ASR into quartiles which are then added and subtracted from the sessions opening price.
The indicator also shows an ASR label so traders can know what the ASR is in terms of dollars.
Session Time Configuration:
The indicator allows users to define the session time, with default timing set from 13:00 to 22:00.
ASR Calculation:
The ASR is calculated over a specified period (default 14 sessions) by averaging the range (high - low) of each session.
Various levels based on the ASR are computed: 0.25 ASR, 0.5 ASR, 0.75 ASR, 1 ASR, 1.25 ASR, 1.5 ASR, 1.75 ASR, and 2 ASR.
Visual Representation:
The indicator plots lines on the chart representing different ASR levels.
Customize the visibility, color, width, and style (Solid, Dashed, Dotted) of these lines for better visualization.
Labels for these lines can also be displayed, with customizable positions and text properties.
Give this indicator a BOOST and COMMENT your thoughts!
We hope you enjoy.
Cheers!

Price Legs: Average Heights; 'Smart ATR'Price Legs: Average Heights; 'Smart ATR'. Consol Range Gauge
~~ Indicator to show small and large price legs (based on short and long input pivot lengths), and calculating the average heights of these price legs; counting legs from user-input start time ~~
//Premise: Wanted to use this as something like a 'Smart ATR': where the average/typical range of a distinct & dynamic price leg could be calculated based on a user-input time interval (as opposed to standard ATR, which is simply the average range over a consistent repeating period, with no regard to market structure). My instinct is that this would be most useful for consolidated periods & range trading: giving the trader an idea of what the typical size of a price leg might be in the current market state (hence in the title, Consol Range gauge)
//Features & User inputs:
-Start time: confirm input when loading indicator by clicking on the chart. Then drag the vertical line to change start time easily.
-Large Legs (toggle on/off) and user-input pivot lookback/lookforward length (larger => larger legs)
-Small Legs (toggle on/off) and user-input pivot lookback/lookforward length (smaller => smaller legs)
-Display Stats table: toggle on/off: simple view- shows the averages of large (up & down), small (up & down), and combined (for each).
-Extended stats table: toggle on/off option to show the averages of the last 3 legs of each category (up/down/large/small/combined)
-Toggle on/off Time & Price chart text labels of price legs (time in mins/hours/days; price in $ or pips; auto assigned based on asset)
-Table position: user choice.
//Notes & tips:
-Using custom start time along with replay mode, you can select any arbitrary chunk of price for the purpose of backtesting.
-Play around with the pivot lookback lengths to find price legs most suitable to the current market regime (consolidating/trending; high volatility/ low volatility)
-Single bar price legs will never be counted: they must be at least 2 bars from H>>L or L>>H.
//Credits: Thanks to @crypto_juju for the idea of applying statistics to this simple price leg indicator.
Simple View: showing only the full averages (counting from Start time):
View showing ONLY the large legs, with Time & Price labels toggled ON:

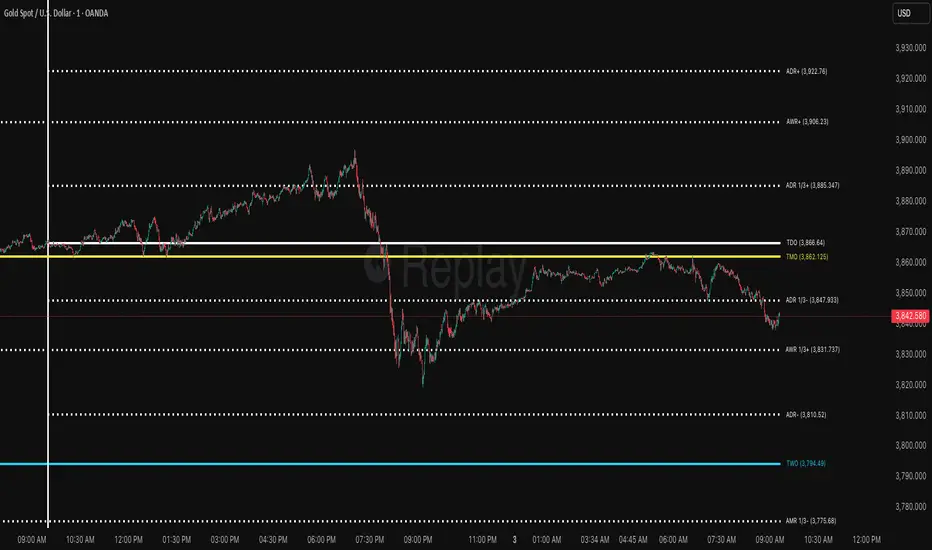
Average Range Levels [Pro+]Description:
The Average Range Levels builds on the concepts of ADR projections showcased in its lite version.
Average Daily Range (ADR) is a common metric used to measure volatility in an asset. It calculates the average difference between the highest and lowest price over a time interval – normally five days.
The Inner Circle Trader teaches the importance of this metric from an algorithmic point of view; in particular the 1/3ADR price level is deemed to be a threshold used to determine the area at which a Judas Swing – false move to trick market participants, protraction, manipulation – might exhaust.
Another key difference in the ICT-use of this metric compared to the classic approach is that the average range is calculated from New York midnight Time, rather than the daily candle's open.
This exact concept was upscaled to higher Timeframe fractals obtaining the Average Weekly Range (AWR) and the Average Monthly Range (AMR). The latter two metrics are anchored at the first Monday’s midnight (New York Time) of the respective interval – however they also have the option to be anchored at the True Week Open (Tuesday’s Daily Open) and True Month Open (Second Week Open).
It is crucial to remember that the elements of Time are key when it comes to interpreting how price action will, or won't, react to these levels: what Time of the day is it? what day of the week? what week of the month?
If one thinks about the Power of Three of a candle (Accumulation, Manipulation Distribution), it is highly unlikely that a Manipulation event will happen later in the candle’s development – seeing the 1/3ADR hold in London session or New York open, seeing the 1/3AWR hold on Tuesday or Wednesday, or seeing price race to the 1/3AMR early on in the month gives undeniable edge to an Analyst.
Apart from the 1/3 level seen from a Judas perspective, the opposing 1/3 level, and the full AR projections, are excellent algorithmic levels at which we will see orderflow or reactions worth studying. These can be take profit targets, reversal opportunities, pyramid entries, …
Last but not least, the tool is equipped with a Data Table. You have a clear narrative but you are unsure of when price will expand? Track the previous 5 ARs and the current Range for Daily, Weekly, and Monthly – the smaller the AR the higher the chance for an expansion, the larger the AR the higher the chance for a consolidation.
Tool Features:
Auto Color the drawings based on your chart’s background or choose your own
Decide whether to consider daily candles, or New York (00:00 to 00:00 NY Time) for the basis of the calculation
Show the last 10 Historical Levels
– See the AR Range, the AR price levels and 1/3AR price levels by hovering over the text labels
Plot the AR levels from their Time Anchor, or as offset markers on the side for a cleaner look
Show/Hide all elements individually
In the Idea below, you can see how INDEX:BTCUSD hit the 1/3AMR level at the end of the second week of the month. The subsequent rejection from this level suggests we might have witnessed a Judas Swing, hence we flip to bullish bias.
In the more recent AWR levels, we can see how price did not touch any level until friday – this is a consolidation week with low probability setups. This was expected, if one looks at the precious two week's ranges and respective average ranges in the Data Table: both breached the AR value, due to to the great expansion higher.
Lastly for the ADR levels we can see how the Judas higher got beautifully stopped at the 1/3 level, and the full ADR level on the opposite side catches price while it falls.
To Get Access, and Level Up see the Author's Instructions below!
This indicator is available only on the TradingView platform.
⚠️ Intellectual Property Rights ⚠️
While this tool's base concepts are public, its interpretation, code, and presentation are protected intellectual property. Unauthorized copying or distribution is prohibited.
⚠️ Terms and Conditions ⚠️
This financial tool is for educational purposes only and not financial advice. Users assume responsibility for decisions made based on the tool's information. Past performance doesn't guarantee future results. By using this tool, users agree to these terms.
Skrip berbayar

Average Range PercentageIt is indicator for average percent range (range from high to low of stock/index price) of N days,
This will help to find high percentage moving stock/index for intraday.

Awesome Trend BandsHere I propose another band indicator, it is tuned to consider volatility expansion and compression, average possible movement, and RSI position to identify dominant sentiment in the market.
When you should go long that center band line will be colored lime when you are to enter shorts it will be red, this signal is great for trading both trending and contracting markets, so you can even trade mean reversion, it catches good moves.
And the best thing of all, it works on all markets/instruments and timeframes- without any inputs from the user.
Here are some charts>
Past performance is not an assurance of future performance, author is not responsible for your profit or loss.
Enjoy~

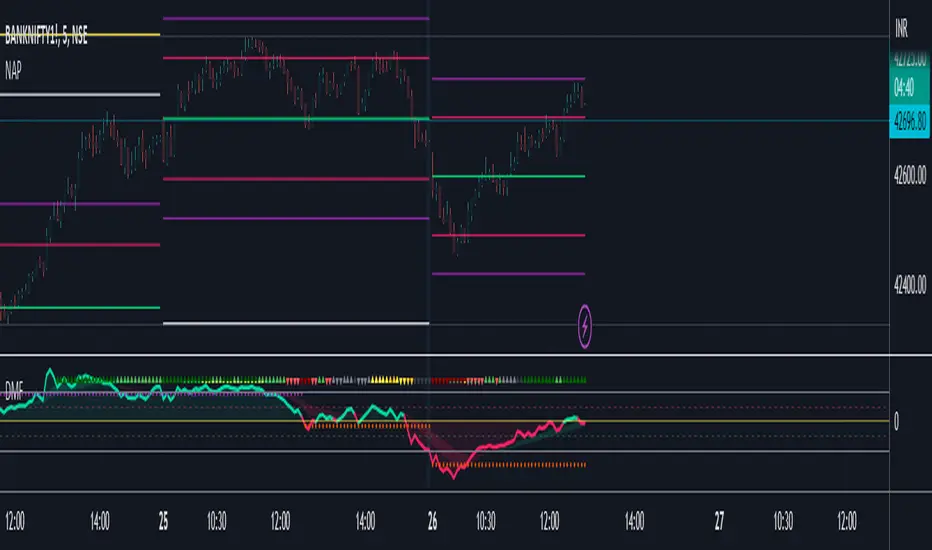
New Age PivotsHere I'm proposing possibly the simplest and most relevant pivot style for intraday traders like me.
It utilizes fundamentals of the average range and devises S/R around that. Pivot point in this is today's open (colored lime), which is far more relevant than yesterday's/past data based pivots.
This is an attempt to reduce the influence of historical data as much as possible, as traders grow in their experience and skill, this becomes the newest and most successful methodology to stay profitable over the long run. Just my pov.
This is purely for educational purposes, no past performance be it visual or mathematical is a guarantee of success in the future. Use it at your own discretion.
The author takes no responsibility of your individual profit or loss. Also, the script will be checked protected for protection against theft, however, you can use it by adding to your favorites.
I've added the ability to hide and view historical S/R as well, it looks best when your chart is clutter-free.
Enjoy~