BBMA OA - AI GPT-5This indicator is an AI-assisted implementation of the BBMA OA (Bollinger Bands + Moving Average) trading strategy, originally introduced by Malaysian trader Oma Ally. The code was generated and optimized using the GPT-5 AI model to ensure clean Pine Script v6 structure and compatibility.
The system combines Bollinger Bands (20, 2) with EMA50, EMA200, and MA5/10 High-Low to identify the four main BBMA OA patterns:
Extreme
Market Hilang Volume (MHV)
Candle Arah Kukuh (CSAK)
Re-entry (RRE, REE, REM)
Features:
Multi Time Frame confirmation for higher accuracy
Automatic signal detection with visual markers
Trend ribbon and candle coloring
Optimized Pine Script v6, free from errors/warnings
⚠ This is an adaptation of Oma Ally’s concept for educational purposes, not an official version. Past performance does not guarantee future results.
Bbma
[zackdinz] BBMA Oma AllyIntroduction:
The BBMA OMA Ally indicator is a combination of Bollinger Bands and several different moving averages. It uses the power of both indicators to provide a comprehensive and robust analysis of market trends and patterns. The indicator is based on the principle of combining trend-following and momentum indicators to generate precise buy and sell signals.
Conditions:
This indicator uses four main conditions to generate signals: Momentum Move, Extreme Move, Reentry and MHV. Momentum Move is a condition where the price is above the upper Bollinger Band and the moving average is trending upwards. Extreme Move is a condition where the price is significantly above the upper Bollinger Band and the moving average is trending upwards. Reentry is a condition where the price is above the middle Bollinger Band and the moving average is trending upwards. MHV is a condition where the price is below the lower Bollinger Band and the moving average is trending downwards.
MA Retest:
The best entry point is at the Reentry and MHV conditions when the MA Retest happens. MA Retest is when the low is below the MA5 and the close is above the MA10 for a buy signal, and when the high is above the MA5 and the close is below the MA10 for a sell signal.
Multiple Timeframe:
The BBMA OMA Ally indicator can also be used on multiple timeframes for a more comprehensive analysis. This strategy involves using different timeframes, such as the 5-minute, 15-minute, and 1-hour charts, to identify trends and patterns. By analyzing different timeframes, traders can have a better understanding of the market and make more informed trading decisions.
Attractiveness:
The BBMA OMA Ally indicator is a powerful tool that can help traders make more profitable trades. It is easy to use, and its signals are highly accurate. By combining the best features of Bollinger Bands and Moving Averages, it provides a complete picture of the market. Additionally, the multiple timeframe strategy allows traders to have a more comprehensive analysis of the market.
In conclusion, the BBMA OMA Ally indicator is a must-have tool for any trader looking to improve their trading performance. Its combination of trend-following and momentum indicators, along with the added feature of MA Retest and multiple timeframes, makes it a versatile and effective tool for both short-term and long-term traders.

Bollinger Bands + Moving Average (BBMA Oma Ally)Found this strategy in babypips forums.babypips.com
This strategy using BB and MA
BBMA Oma Ally Trading Technique
I’m just sharing this Forex Technique that helping me making positive result.
In BBMA, BB (Bollinger Bands) act as Dynamic Support and Resistance.
SETTING OF BBMA - BOLLINGER BANDS
Period : 20
Deviations : 2
Shift : 0
Apply to : Close
Style : Dodge Blue
MA (Moving Average) are used to detect potential entry point.
SETTING OF BBMA - MOVING AVERAGE
Ma5 Hi
Period : 5
Ma Method : Linear Weighted
Apply to : High
Style : Red
Ma10 Hi
Period : 10
Ma Method : Linear Weighted
Apply to : High
Style : Yellow
Ma5 Low
Period : 5
Ma Method : Linear Weighted
Apply to : Low
Style : Magenta
Ma10 Low
Period : 10
Ma Method : Linear Weighted
Apply to : Low
Style : White
Ma50
Period : 50
Ma Method : Exponential
Apply to : Close
Style : Lime
.
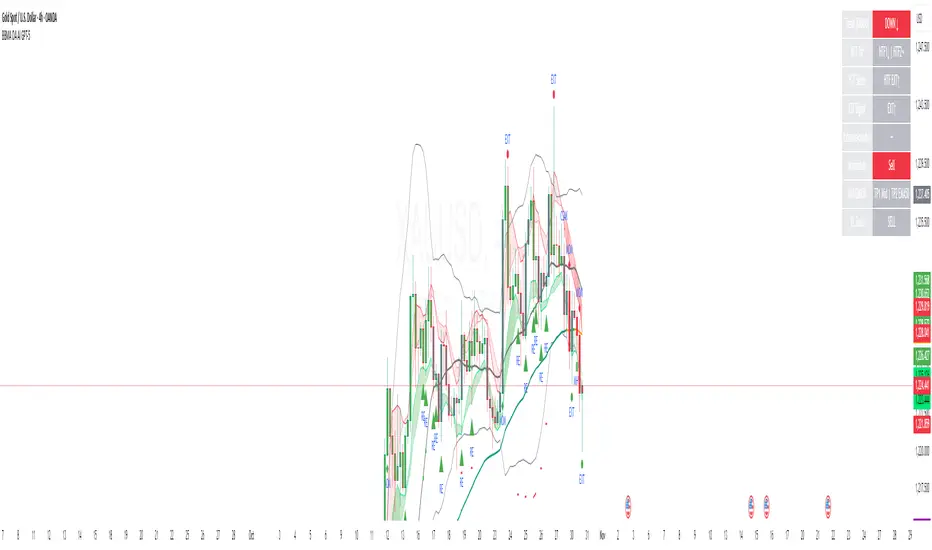
EXTREM (SIGNAL)
Extrem is an early signal to say the Market journey is beginning to end - but not yet confirmed
Will only confirm when there is a reversal candle.
Extrem is not valid when there is a CS momentum, although Ma outside BB.
CHARACTERISTICS OF EXTREM
Ma out of Top / Low BB (will not valid if there is cs momentum, although Ma is outside BB)
Reverse candle must exist, as it indicates the journey of a Market is ending (not necessarily 1 or 2 cs)
Retest candle (entry point)
Entry at Highest or Lowest volume
Entry retest candle at Ma5 or body candle
MHV (LOSS VOLUME MARKET) (SETUP)
It is a setup for the beginning of long distance Market journey
This setup gives a validation for the Extrem signal earlier
It is to show the loss of strength for the market.
MHV is valid once CSA (direction candle) appear
***If the candle close NOT above or below Top / Low BB after the first Reentry, after MHV there is a directional candlestick, then there will be a reentry and after the reentry there is no momentum “COMPULSORY TP”
CHARACTERISTICS OF MHV :
Candle CANNOT close above or below Top / Low BB
Must have reverse candle, because reverse candle is confirming the end of the journey (Marking at candle body)
Retest candle (entry point) at Ma5 or highest volume / lowest at that current time
Must happen after Extrem
TYPES OF MHV
5 types but i can only post 1 photo. So sorry i cant give more on this.
RE-ENTRY
CHARACTERISTICS OF REENTRY
Candle close can not pass Ma5 / Ma10
It will be strong when the candle close does not pass Ma5 / Ma10 and also Mid BB
Candle close did not come in. He found Ma5 / Ma10 and mid BB at that Time would make the re-entry stronger
If there is a re-entry in Ma5 / Ma10 and mid BB, the minimum of 3 drops of candles or increments (follow TF) re-entry will be strong
Following market trend, then just search for re-entry and entry
Wait for the second candle, because the first candle validates the reentry and the second candle is for entry

[HuD] BBMA OABBMA OA is a trading technique and strategy invented by Technical Analysis guru, Mr Oma Ally.
It consists of :
1. WMA 5 High
2. WMA 10 High
3. WMA 5 Low
4. WMA 10 Low
5. Bollinger Band ( Standard Setting )
6. EMA 50 ( Purple Line )
7. SMA200 ( Red Line )
There are many rules for entry, Take Profit (TP) and reentry etc from this technique.
For the introduction, I start with basic info first before proceeding to the next stage ( info & coding ).
Upper band WMA = Green color when ( WMA5 High > WMA10 High )
Lower band WMA = Green color when ( WMA5 Low > WMA10 Low )
Upper band WMA = Red color when ( WMA5 High < WMA10 High )
Lower band WMA = Red color when ( WMA5 Low < WMA10 Low )
Green Candle = Momentum Up candle - when candle close outside from TopBB
Red Candle = Momentum Down candle - when candle close outside from Low BB
+ sign (Red) when line WMA exceed outside TopBB (possible Extreme Sell will happen)
+ sign (Green) when line WMA exceed outside LowBB (possible Extreme Buy will happen)

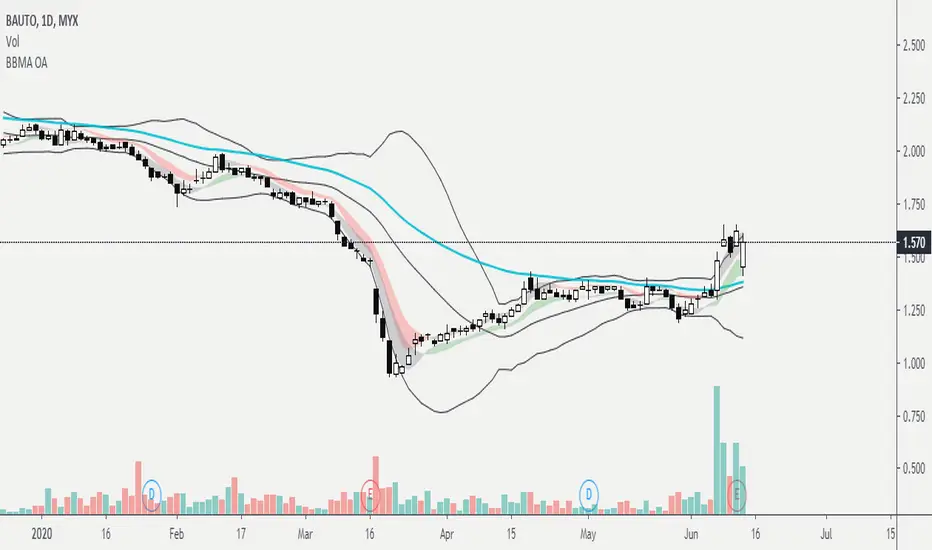
BBMA : Bollinger Band & Moving AverageBased on trading technique by Mr Oma Ally, Technical Analysis Guru.
1. Bollinger Band - standard setting, MA20, Dev = 2
2. EMA 50 ( Line Color = Aqua )
3. WMA High ( wma5 High and wma10 High )
Area Pink : WMA5 High < WMA10 High
Area Gray : WMA5 High > WMA10 High
4. WMA Low ( wma5 Low and wma10 Low )
Area Green : WMA5 Low > WMA10 Low
Area Gray : WMA5 Low < WMA10 Low
5. If you wish to see wma lines, adjust the transparency at the menu.
This is just an indicator setting.
For technique and how to apply for trading, kindly please refer to web/youtube/class/etc :)
BBMA Oma Ally Light ThemeThis is an implementation of BBMA OMA Ally for light theme.
It is based on original BBMA Rules without any extra indicator or modification.
Add feature to allow notification if setup condition is met.
Detection:
-CSM
-RE-ENTRY (BUY/SELL)
-ALIEN Candle
-EXTREME (BUY/SELL)
Please report bug or issue to author.


BBMA #scriptbolinger bands, ma's, csd, extremes, inside/outside bars.
If You like it click thumbs up.
