CAP Kronks Bias Killer 10Candles and background changes colour when 60 SMA is above or below close price
Below

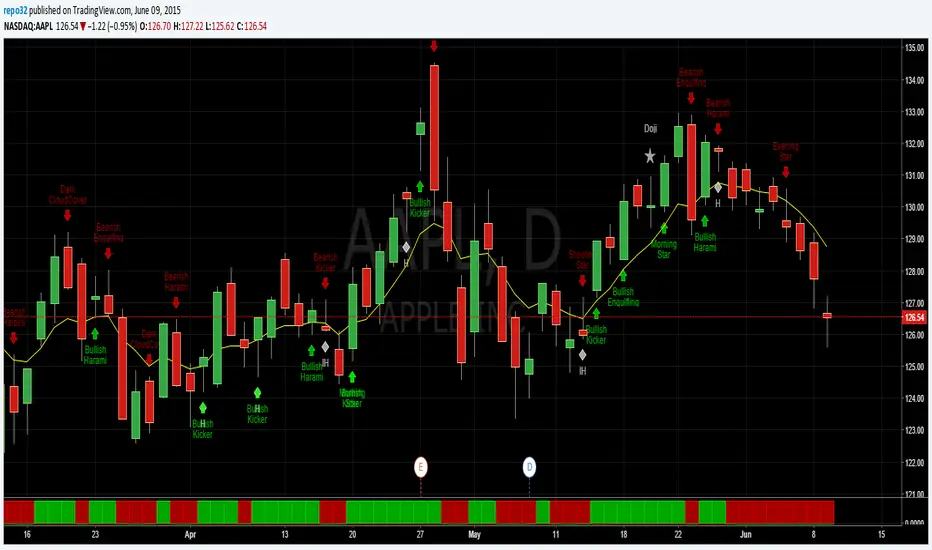
Price above/below EMAThis script will give you red/green columns to indicate if price is above or below a certain EMA. With Candlestick charting, we are looking for price in relation to the 8 ema Trigger Line (T-Line). You can adjust this indicator to fit your need. Simple, but nice to quickly see.
Oops. Last line's title should be "Sell". Doesn't affect display though.