StdDev Supply/Demand Zone RefinerThis indicator uses standard deviation bands to identify statistically significant price extremes, then validates these levels through volume analysis and market structure. It employs a proprietary "Zone Refinement" technique that dynamically adjusts zones based on price interaction and volume concentration, creating increasingly precise support/resistance areas.
Key Features:
Statistical Extremes Detection: Identifies when price reaches 2+ standard deviations from mean
Volume-Weighted Zone Creation: Only creates zones at extremes with abnormal volume
Dynamic Zone Refinement: Automatically tightens zones based on touch points and volume nodes
Point of Control (POC) Identification: Finds the exact price with maximum volume within each zone
Volume Profile Visualization: Shows horizontal volume distribution to identify key liquidity levels
Multi-Factor Validation: Combines volume imbalance, zone strength, and touch count metrics
Unlike traditional support/resistance indicators that use arbitrary levels, this system:
Self-adjusts based on market volatility (standard deviation)
Refines zones through machine-learning-like feedback from price touches
Weights by volume to show where real money was positioned
Tracks zone decay - older, untested zones automatically fade
Penunjuk Bill Williams

yEQ - TTTThe EQ LEVELS indicator by TheTopTraders is designed to display key Equilibrium (EQ) levels across different timeframes – Daily, Weekly, Monthly, and Yearly. These levels represent the midpoint between the high and low prices of the selected period and can serve as important reference points for trading decisions.

HTF POC with Zones & AlertsPlots a Point of Control (POC) per candle from a timeframe you choose (MTF). Because TradingView doesn’t expose true footprint data, the POC here is a proxy (choose: Body Mid, Range Mid, or Typical Price HLC3). The script draws the POC line and an optional POC zone (±% of that candle’s range), then alerts when price retests the zone (wick touches count).
Use it to:
Mark key levels inside candles that often act as magnets or reaction zones
Track retests of strong bars (imbalance) across higher timeframes
Add clean confluence with S/R, FVGs, or trend tools
Features: Selectable TF, zone width, extend lines/zones, historical caps, alerts, and info panel.
Note: This is an estimate of POC from OHLC, not real bid/ask volume. Use as context, not a standalone signal.

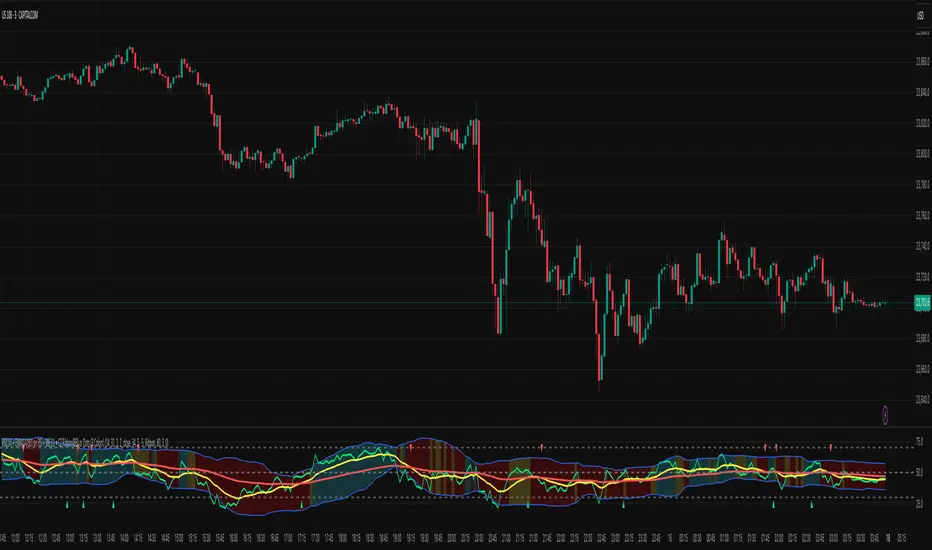
FluidFlow OscillatorFluidFlow Oscillator: Study Material for Traders
Overview
The FluidFlow Oscillator is a custom technical indicator designed to measure price momentum and market flow dynamics by simulating fluid motion concepts such as velocity, viscosity, and turbulence. It helps traders identify potential buy and sell signals along with trend strength, momentum direction, and volatility conditions.
This study explains the underlying calculation concepts, signal logic, visual cues, and how to interpret the professional dashboard table that summarizes key indicator readings.
________________________________________
How the FluidFlow Oscillator Works
Core Mechanisms
1. Price Flow Velocity
o Measures the rate of change of price over a specified flow length (default 40 bars).
o Calculated as a percentage change of closing price: roc=close−closelen_flowcloselen_flow×100\text{roc} = \frac{\text{close} - \text{close}_{len\_flow}}{\text{close}_{len\_flow}} \times 100roc=closelen_flowclose−closelen_flow×100
o Smoothed by an EMA (Exponential Moving Average) to reduce noise, generating a "flow velocity" value.
2. Viscosity Factor
o Analogous to fluid viscosity, it adjusts the flow velocity based on recent price volatility.
o Volatility is computed as the standard deviation of close prices over the flow length.
o The viscosity acts as a damping factor to slow down the flow velocity in highly volatile conditions.
o This results in a "flow with viscosity" value, that smooths out the velocity considering market turbulence.
3. Turbulence Burst
o Captures sudden changes or bursts in the flow by measuring changes between successive viscosity-adjusted flows.
o The turbulence value is a smoothed absolute change in flow.
o A burst boost factor is added to the oscillator to incorporate this rapid change component, amplifying signals during sudden shifts.
4. Oscillator Calculation
o The raw oscillator value is the sum of flow with viscosity plus burst boost, scaled by 10.
o Clamped between -100 and +100 to limit extremes.
o Finally, smoothed again by EMA for cleaner visualization.
________________________________________
Signal Logic
The oscillator works with complementary components to produce actionable signals:
• Signal Line: An EMA-smoothed version of the oscillator for generating crossover-based signals.
• Momentum: The rate of change of the oscillator itself, smoothed by EMA.
• Trend: Uses fast (21-period EMA) and slow (50-period EMA) moving averages of price to identify market trend direction (uptrend, downtrend, or sideways).
Signal Conditions
• Bullish Signal (Buy): Oscillator crosses above the oversold threshold with positive momentum.
• Bearish Signal (Sell): Oscillator crosses below the overbought threshold with negative momentum.
Statuses
The oscillator provides descriptive market states based on level and momentum:
• Overbought
• Oversold
• Buy Signal
• Sell Signal
• Bullish / Bearish (momentum-driven)
• Neutral (no clear trend)
________________________________________
Color System and Visualization
The oscillator uses a sophisticated HSV color model adapting hues according to:
• Oscillator value magnitude and sign (positive or negative)
• Acceleration of oscillator changes
• Smooth color gradients to facilitate intuitive understanding of trend strength and momentum shifts
Background colors highlight overbought (red tint) and oversold (green tint) zones with transparency.
________________________________________
How to Understand the Professional Dashboard Table
The FluidFlow Oscillator offers an integrated table at the bottom center of the chart. This dashboard summarizes critical indicator readings in 8 columns across 3 rows:
Column Description
SIGNAL Current signal status (e.g., Buy, Sell, Overbought) with color coding
OSCILLATOR Current oscillator value (-100 to +100) with color reflecting intensity and direction
MOMENTUM Momentum bias indicating strength/direction of oscillator changes (Strong Up, Up, Sideways, Down, Strong Down)
TREND Current trend status based on EMAs (Strong Uptrend, Uptrend, Sideways, Downtrend, Strong Downtrend)
VOLATILITY Volatility percentage relative to average, indicating market activity level
FLOW Flow velocity value describing price momentum magnitude and direction
TURBULENCE Turbulence level indicating sudden bursts or spikes in price movement
PROGRESS Oscillator's position mapped as a percentage (0% to 100%) showing proximity to extreme levels
Rows Explained
• Row 1 (Header): Labels for each metric.
• Row 2 (Values): Current numerical or descriptive values color-coded along a professional scheme:
o Green or lime tones indicate positive or bullish conditions.
o Red or orange tones indicate caution, sell signals, or bearish conditions.
o Blue tones indicate neutral or stable conditions.
• Row 3 (Status Indicators): Emoji-like icons and bars provide a quick visual gauge of each metric's intensity or signal strength:
o For example, "🟢🟢🟢" suggests very strong bullish momentum, while "🔴🔴🔴" suggests strong bearish momentum.
o Progress bar visually demonstrates oscillator movement toward oversold or overbought extremes.
________________________________________
Practical Interpretation Tips
• A Buy signal with green colors and strong momentum usually precedes upward price moves.
• An Overbought status with red background and red table colors warns of potential price corrections or reversals.
• Watch the Turbulence to gauge market instability; spikes may precede price shocks or volatility bursts.
• Confirm signals with the Trend and Momentum columns to avoid false entries.
• Use the Progress bar to anticipate oscillations approaching key threshold levels for timing trades.
________________________________________
Alerts
The oscillator supports alerts for:
• Buy and sell signals based on oscillator crossovers.
• Overbought and oversold levels reached.
These help traders automate awareness of important market conditions.
________________________________________
Disclaimer
The FluidFlow Oscillator and its signals are for educational and informational purposes only. They do not guarantee profits and should not be considered as financial advice. Always conduct your own research and use proper risk management when trading. Past performance is not indicative of future results.
________________________________________
This detailed explanation should help you understand the workings of the FluidFlow Oscillator, its components, signal logic, and how to analyze its professional dashboard for informed trading decisions.

Screener based on Profitunity strategy for multiple timeframes
Screener based on Profitunity strategy by Bill Williams for multiple timeframes (max 5, including chart timeframe) and customizable symbol list. The screener analyzes the Alligator and Awesome Oscillator indicators, Divergent bars and high volume bars.
The maximum allowed number of requests (symbols and timeframes) is limited to 40 requests, for example, for 10 symbols by 4 requests of different timeframes. Therefore, the indicator automatically limits the number of displayed symbols depending on the number of timeframes for each symbol, if there are more symbols than are displayed in the screener table, then the ordinal numbers are displayed to the left of the symbols, in this case you can display the next group of symbols by increasing the value by 1 in the "Show tickers from" field, if the "Group" field is enabled, or specify the symbol number by 1 more than the last symbol in the screener table. 👀 When timeframe filtering is applied, the screener table displays only the columns of those timeframes for which the filtering value is selected, which allows displaying more symbols.
For each timeframe, in the "TIMEFRAMES > Prev" field, you can enable the display of data for the previous bar relative to the last (current) one, if the market is open for the requested symbol. In the "TIMEFRAMES > Y" field, you can enable filtering depending on the location of the last five bars relative to the Alligator indicator lines, which are designated by special symbols in the screener table:
⬆️ — if the Alligator is open upwards (Lips > Teeth > Jaw) and none of the bars is closed below the Lips line;
↗️ — if one of the bars, except for the penultimate one, is closed below Lips, or two bars, except for the last one, are closed below Lips, or the Alligator is open upwards only below four bars, but none of the bars is closed below Lips;
⬇️ — if the Alligator is open downwards (Lips < Teeth < Jaw), but none of the bars is closed above Lips;
↘️ — if one of the bars, except the penultimate one, is closed above the Lips, or two bars, except the last one, are closed above the Lips, or the Alligator is open down only above four bars, but none of the bars are closed above the Lips;
➡️ — in other cases, including when the Alligator lines intersect and one of the bars is closed behind the Lips line or two bars intersect one of the Alligator lines.
In the "TIMEFRAMES > Show bar change value for TF" field, you can add a column to the right of the selected timeframe column with the percentage change between the closing price of the last bar (current) and the closing price of the previous bar ((close – previous close) / previous close * 100). Depending on the percentage value, the background color of the screener table cell will change: dark red if <= -3%; red if <= -2%, light red if <= -0.5%; dark green if >= 3%; green if >= 2%; light green if >= 0.5%.
For each timeframe, the screener table displays the symbol of the latest (current) bar, depending on the closing price relative to the bar's midpoint ((high + low) / 2) and its location relative to the Alligator indicator lines: ⎾ — the bar's closing price is above its midpoint; ⎿ — the bar's closing price is below its midpoint; ├ — the bar's closing price is equal to its midpoint; 🟢 — Bullish Divergent bar, i.e. the bar's closing price is above its midpoint, the bar's high is below all Alligator lines, the bar's low is below the previous bar's low; 🔴 — Bearish Divergent bar, i.e. the bar's closing price is below its midpoint, the bar's low is above all Alligator lines, the bar's high is above the previous bar's high. When filtering is enabled in the "TIMEFRAMES > Filtering by Divergent bar" field, the data in the screener table cells will be displayed only for those timeframes that have a Divergent bar. A high bar volume signal is also displayed — 📶/📶² if the bar volume is greater than 40%/70% of the average volume value calculated using a simple moving average (SMA) in the 140 bar interval from the last bar.
In the indicator settings in the "SYMBOL LIST" field, each ticker (for example: OANDA:SPX500USD) must be on a separate line. If the market is closed, then the data for requested symbols will be limited to the time of the last (current) bar on the chart, for example, if the current symbol was traded yesterday, and the requested symbol is traded today, when requesting data for an hourly timeframe, the last bar will be for yesterday, if the timeframe of the current chart is not higher than 1 day. Therefore, by default, a warning will be displayed on the chart instead of the screener table that if the market is open, you must wait for the screener to load (after the first price change on the current chart), or if the highest timeframe in the screener is 1 day, you will be prompted to change the timeframe on the current chart to 1 week, if the screener requests data for the timeframe of 1 week, you will be prompted to change the timeframe on the current chart to 1 month, or switch to another symbol on the current chart for which the market is open (for example: BINANCE:BTCUSDT), or disable the warning in the field "SYMBOL LIST > Do not display screener if market is close".
The number of the last columns with the color of the AO indicator that will be displayed in the screener table for each timeframe is specified in the indicator settings in the "AWESOME OSCILLATOR > Number of columns" field.
For each timeframe, the direction of the trend between the price of the highest and lowest bars in the specified range of bars from the last bar is displayed — ↑ if the trend is up (the highest bar is to the right of the lowest), or ↓ if the trend is down (the lowest bar is to the right of the highest). If there is a divergence on the AO indicator in the specified interval, the symbol ∇ is also displayed. The average volume value is also calculated in the specified interval using a simple moving average (SMA). The number of bars is set in the indicator settings in the "INTERVAL FOR HIGHEST AND LOWEST BARS > Bars count" field.
In the indicator settings in the "STYLE" field you can change the position of the screener table relative to the chart window, the background color, the color and size of the text.
***
Скринер на основе стратегии Profitunity Билла Вильямса для нескольких таймфреймов (максимум 5, включая таймфрейм графика) и настраиваемого списка символов. Скринер анализирует индикаторы Alligator и Awesome Oscillator, Дивергентные бары и бары с высоким объемом.
Максимально допустимое количество запросов (символы и таймфреймы) ограничено 40 запросами, например, для 10 символов по 4 запроса разных таймфреймов. Поэтому в индикаторе автоматически ограничивается количество отображаемых символов в зависимости от количества таймфреймов для каждого символа, если символов больше чем отображено в таблице скринера, то слева от символов отображаются порядковые номера, в таком случае можно отобразить следующую группу символов, увеличив значение на 1 в настройках индикатора поле "Show tickers from", если включено поле "Group", или указать номер символа на 1 больше, чем последний символ в таблице скринера. 👀 Когда применяется фильтрация по таймфрейму, в таблице скринера отображаются только столбцы тех таймфреймов, для которых выбрано значение фильтрации, что позволяет отображать большее количество символов.
Для каждого таймфрейма в настройках индикатора в поле "TIMEFRAMES > Prev" можно включить отображение данных для предыдущего бара относительно последнего (текущего), если для запрашиваемого символа рынок открыт. В поле "TIMEFRAMES > Y" можно включить фильтрацию, в зависимости от расположения последних пяти баров относительно линий индикатора Alligator, которые обозначаются специальными символами в таблице скринера:
⬆️ — если Alligator открыт вверх (Lips > Teeth > Jaw) и ни один из баров не закрыт ниже линии Lips;
↗️ — если один из баров, кроме предпоследнего, закрыт ниже Lips, или два бара, кроме последнего, закрыты ниже Lips, или Alligator открыт вверх только ниже четырех баров, но ни один из баров не закрыт ниже Lips;
⬇️ — если Alligator открыт вниз (Lips < Teeth < Jaw), но ни один из баров не закрыт выше Lips;
↘️ — если один из баров, кроме предпоследнего, закрыт выше Lips, или два бара, кроме последнего, закрыты выше Lips, или Alligator открыт вниз только выше четырех баров, но ни один из баров не закрыт выше Lips;
➡️ — в остальных случаях, в то числе когда линии Alligator пересекаются и один из баров закрыт за линией Lips или два бара пересекают одну из линий Alligator.
В поле "TIMEFRAMES > Show bar change value for TF" можно добавить справа от выбранного столбца таймфрейма столбец с процентным изменением между ценой закрытия последнего бара (текущего) и ценой закрытия предыдущего бара ((close – previous close) / previous close * 100). В зависимости от величины процента будет меняться цвет фона ячейки таблицы скринера: темно-красный, если <= -3%; красный, если <= -2%, светло-красный, если <= -0.5%; темно-зеленый, если >= 3%; зеленый, если >= 2%; светло-зеленый, если >= 0.5%.
Для каждого таймфрейма в таблице скринера отображается символ последнего (текущего) бара, в зависимости от цены закрытия относительно середины бара ((high + low) / 2) и расположения относительно линий индикатора Alligator: ⎾ — цена закрытия бара выше его середины; ⎿ — цена закрытия бара ниже его середины; ├ — цена закрытия бара равна его середине; 🟢 — Бычий Дивергентный бар, т.е. цена закрытия бара выше его середины, максимум бара ниже всех линий Alligator, минимум бара ниже минимума предыдущего бара; 🔴 — Медвежий Дивергентный бар, т.е. цена закрытия бара ниже его середины, минимум бара выше всех линий Alligator, максимум бара выше максимума предыдущего бара. При включении фильтрации в поле "TIMEFRAMES > Filtering by Divergent bar" данные в ячейках таблицы скринера будут отображаться только для тех таймфреймов, где есть Дивергентный бар. Также отображается сигнал высокого объема бара — 📶/📶², если объем бара больше чем на 40%/70% среднего значения объема, рассчитанного с помощью простой скользящей средней (SMA) в интервале 140 баров от последнего бара.
В настройках индикатора в поле "SYMBOL LIST" каждый тикер (например: OANDA:SPX500USD) должен быть на отдельной строке. Если рынок закрыт, то данные для запрашиваемых символов будут ограничены временем последнего (текущего) бара на графике, например, если текущий символ торговался последний день вчера, а запрашиваемый символ торгуется сегодня, при запросе данных для часового таймфрейма, последний бар будет за вчерашний день, если таймфрейм текущего графика не выше 1 дня. Поэтому по умолчанию на графике будет отображаться предупреждение вместо таблицы скринера о том, что если рынок открыт, то необходимо дождаться загрузки скринера (после первого изменения цены на текущем графике), или если в скринере самый высокий таймфрейм 1 день, то будет предложено изменить на текущем графике таймфрейм на 1 неделю, если в скринере запрашиваются данные для таймфрейма 1 неделя, то будет предложено изменить на текущем графике таймфрейм на 1 месяц, или же переключиться на другой символ на текущем графике, для которого рынок открыт (например: BINANCE:BTCUSDT), или отключить предупреждение в поле "SYMBOL LIST > Do not display screener if market is close".
Количество последних столбцов с цветом индикатора AO, которые будут отображены в таблице скринера для каждого таймфрейма, указывается в настройках индикатора в поле "AWESOME OSCILLATOR > Number of columns".
Для каждого таймфрейма отображается направление тренда между ценой самого высокого и самого низкого баров в указанном интервале баров от последнего бара — ↑, если тренд направлен вверх (самый высокий бар справа от самого низкого), или ↓, если тренд направлен вниз (самый низкий бар справа от самого высокого). Если есть дивергенция на индикаторе AO в указанном интервале, то также отображается символ — ∇. В указанном интервале также рассчитывается среднее значение объема с помощью простой скользящей средней (SMA). Количество баров устанавливается в настройках индикатора в поле "INTERVAL FOR HIGHEST AND LOWEST BARS > Bars count".
В настройках индикатора в поле "STYLE" можно изменить положение таблицы скринера относительно окна графика, цвет фона, цвет и размер текста.

EMA +BB + CZ or dot (3 Colors) on RSI RSI(14) + EMA(14/60) on RSI + BB(31) • CZ Ribbon(BB) or Dots (3 Colors)
F160 YAZ1LI8"Our updates continue on a regular basis. The advanced extensions applied on daily bars are renewed every week to ensure the most up-to-date and efficient performance." ✅


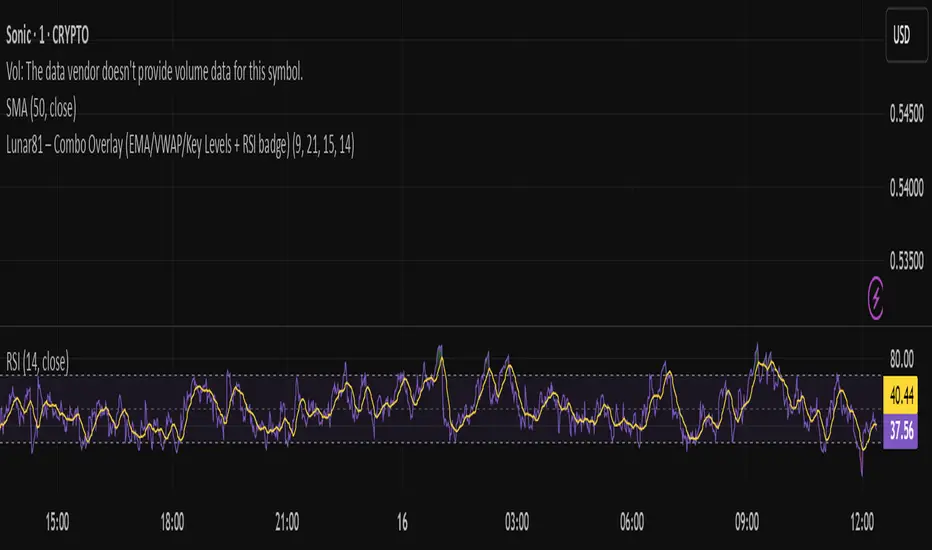
S_Enterprice – Overlay (EMA/VWAP/Key Levels + RSI badge)Indicator that combines EMA 9/21, VWAP, Previous Day/Week levels, Session Open, Open Range, Initial Balance, and an RSI badge.
Useful for intraday trading, scalping, and ICT-style analysis.

DRKSCALPER Strategycoded by Russian coders
this indicators is based coded by buy and sell via price action and fundamental analysis

Pro Market Toolkit (TH) v2.4 — S/R + Zones + ATR Bands + Alertsรายละเอียด (ภาษาไทย):
อินดิเคเตอร์ชุดเครื่องมือครบวงจรสำหรับนักเทรด
คำนวณ แนวรับ–แนวต้าน (Support / Resistance) อัตโนมัติจากสวิง (Pivot High/Low)
สร้าง Supply/Demand Zones จาก ATR เพื่อหาพื้นที่กลับตัวสำคัญ
วาดเส้น Moving Average และ ATR Bands เพื่อประเมินแนวโน้มและความผันผวน
แสดงสัญญาณ Breakout และ Bounce/Reject อย่างชัดเจนบนกราฟ
รองรับ Alerts สำหรับ 4 เงื่อนไขสำคัญ: Breakout ขึ้น/ลง, Demand Bounce, Supply Reject
มีตารางแสดง Trend และค่า ATR ปัจจุบัน
เหมาะสำหรับผู้ที่ต้องการดูแนวโน้ม, หาจุดเข้า/ออก และรับการแจ้งเตือนอัตโนมัติ โดยไม่ต้องเฝ้ากราฟตลอดเวลา
Description (English):
A comprehensive trading toolkit indicator for professional traders.
Automatically detects Support/Resistance levels using swing pivots
Generates Supply/Demand Zones based on ATR to highlight potential reversal areas
Plots Moving Average and ATR Bands for trend and volatility analysis
Displays clear signal markers for Breakouts and Zone Bounces/Rejects
Provides Alerts for 4 key conditions: Breakout Up/Down, Demand Bounce, Supply Reject
Includes an on-chart table showing the current Trend and ATR value
Ideal for traders who want automatic key levels, zones, and signal alerts without the need to monitor the chart constantly.

Stocklopedia Indicator Version 1Indicator Description & Disclaimer
This indicator has been developed and shared on TradingView for educational and research purposes only. It is designed to help users learn and explore technical analysis concepts within Pine Script. It is not a financial product, nor does it provide any form of financial, investment, or trading advice.
Trading financial markets involves substantial risk, including the possible loss of capital. By using this indicator, you acknowledge and agree to the following:
No Guarantee of Accuracy
While this indicator is intended to provide useful insights, Pine Script calculations and TradingView data feeds may, at times, produce inaccurate, delayed, or incomplete results.
Market conditions (such as volatility, liquidity gaps, or technical limitations of the platform) can also affect the reliability of the signals generated.
No guarantee, warranty, or assurance is provided that the indicator will function as expected at all times.
No Liability
The author of this indicator shall not be held responsible or liable for any profits, losses, damages, or other outcomes—direct or indirect—that may arise from the use of this script.
Any trading or investment decisions taken based on this indicator are entirely your own responsibility.
Educational Use Only
This script is intended as a tool to support learning and experimentation with Pine Script and technical indicators.
It should not be considered as a buy/sell signal generator or relied upon for live trading decisions.
User Responsibility
By applying or modifying this indicator, you fully accept that you are solely accountable for your trading decisions and their consequences.
You should always conduct your own research, consult with a qualified financial advisor if needed, and use appropriate risk management practices.
⚠️ Final Note:
Use this indicator at your own discretion. The author assumes no responsibility in any form or manner for how this tool is used, interpreted, or applied in real-world trading.
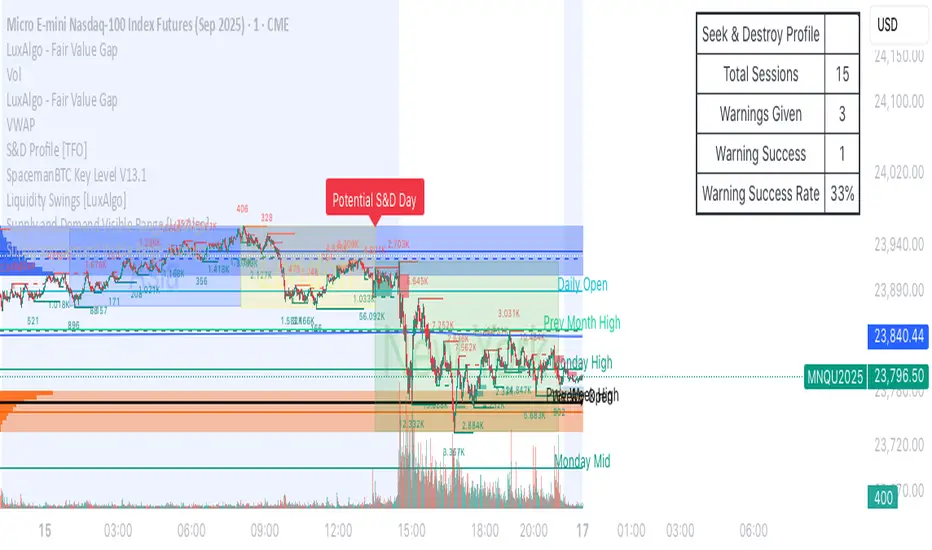
liquidity reversalThis script detects liquidity sweeps and confirms reversals based on price action. It looks for:
- A sweep of a recent high or low
- A reversal candle closing back inside range
- (Optional) Confirmation via market structure break (MSB)
When confirmed, it plots:
- BUY signals after low sweep + bullish break
- SELL signals after high sweep + bearish break
Works on any timeframe. Designed for MNQ scalping during NY open.
Estrategia WT + Squeeze + MMAs v6 (Mejorada)USER GUIDE – WT + Squeeze + MMAs Strategy
1. Preparation
Activate your indicator on the chart of the asset you want to trade (stock, ETF, index, etc.).
Choose the time frame according to your style:
Intraday: 5m, 15m, 30m
Swing: 1h, 4h
Investment: Daily, Weekly
Always check two time frames:
A higher one for the overall trend.
A lower one for precise entry.
2. Initial Filter: Trend
Buy: Price above the 200 MMA.
Sell: Price below the 200 MMA.
❌ Do not trade signals that go against the main trend.
3. Confirm the Momentum
Buy: 10 MMA above the 55 MMA.
Sell: 10 MMA below the 55 MMA.
Both MAs must be aligned with the trend direction indicated by the 200 MMA.
4. Wait for System Confirmation
The script will mark:
📈 BUY (green):
Uptrend confirmed.
WT crosses upward.
Positive Squeeze Momentum (green values).
📉 SELL (red):
Downtrend confirmed.
WT crosses downward.
Negative Squeeze Momentum (red values).
💡 Golden Rule: Only enter if the trend, momentum, and script signals are aligned.
5. Trade Execution
Buy (BUY):
Enter at the open of the candle following the signal.
Stop Loss: Below the last relevant support or recent low.
Take Profit:
Minimum R/R 1:2
Or exit when a sell signal appears.
Sell (SELL):
Enter at the open of the candle following the signal.
Stop Loss: Above the last relevant resistance or recent high.
Take Profit: Same as in buys.
6. Risk Management
Risk no more than 1–2% of your capital in a single trade.
If trading stocks (spot market):
Only use BUY, holding as long as the 10 MMA does not cross below the 55 MMA.
If trading CFDs or on margin:
You can use BUY and SELL, applying a strict SL.
7. Filter Out False Signals
Avoid trading right before major news events (earnings reports, economic announcements).
If the signal appears in a very tight range, wait for a breakout.
On a higher time frame, check that the price is not touching strong resistance (for buys) or strong support (for sells).
Quick Example
On 4H → price is above the 200 MMA (uptrend).
On 15M → 10 MMA > 55 MMA, WT crosses bullish, and Squeeze turns green.
Script marks BUY.
Place a buy order, SL below last support, TP 1:2 or exit when the script marks SELL.

Indicador Millo SMA20-SMA200-AO-RSI M1This indicator is designed for scalping in 1-minute timeframes on crypto pairs, combining trend direction, momentum, and oscillator confirmation.
Logic:
Trend Filter:
Only BUY signals when price is above the SMA200.
Only SELL signals when price is below the SMA200.
Entry Trigger:
BUY: Price crosses above the SMA20.
SELL: Price crosses below the SMA20.
Confirmation Window:
After the price cross, the Awesome Oscillator (AO) must cross the zero line in the same direction within a maximum of N bars (configurable, default = 4).
RSI must be > 50 for BUY and < 50 for SELL at the moment AO confirms.
Cooldown:
A cooldown period (configurable, default = 10 bars) prevents multiple signals of the same type in a short time, reducing noise in sideways markets.
Features:
Works on any crypto pair and can be used in other markets.
Adjustable confirmation window, RSI threshold, and cooldown.
Alerts ready for BUY and SELL conditions.
Can be converted into a strategy for backtesting with TP/SL.
Suggested Use:
Pair: BTC/USDT M1 or similar high-liquidity asset.
Combine with manual support/resistance or higher timeframe trend analysis.
Recommended to confirm entries visually and with additional confluence before trading live.

Dynamic Trend Bands (DTB)Description:
Dynamic Trend Bands (DTB) is a volatility-based range filter combined with multiple trend confirmation tools to detect and visualize market direction and possible reversals.
Features:
Range Filter: Identifies potential highs/lows and filters out market noise.
Trend Strength: Integrated ADX to validate trend momentum.
VIDYA Bands + ATR: Detects breakout conditions using variable adaptive moving averages and volatility bands.
EMA 200 Filter: Determines long-term trend direction.
Auto Buy/Sell Labels: Generates clear entry and exit signals.
Alerts: Ready-to-use alert conditions for automated notifications.
Recommended Use:
Timeframe: 4H (works on other timeframes as well)
Markets: BTC, ETH, major altcoins, and traditional assets.
Advantages:
Combines short-term and long-term trend detection.
Filters out false signals in choppy markets.
Visual and alert-based trade setups for easier execution.
//@version=6
// ─────────────────────────────────────────────────────────────────────────────
// Title: Dynamic Trend Bands (DTB) + Auto Buy/Sell + EMA 200 + ADX + VIDYA
//
// Description:
// Dynamic Trend Bands (DTB) is a volatility-based range filter combined with
// multiple trend confirmation tools to detect and visualize market direction
// and possible reversals.
//
// Features:
// - Range Filter: Identifies potential highs/lows and filters out market noise.
// - Trend Strength: Integrated ADX to validate trend momentum.
// - VIDYA Bands + ATR: Detects breakout conditions using variable adaptive moving averages and volatility bands.
// - EMA 200 Filter: Determines long-term trend direction.
// - Auto Buy/Sell Labels: Generates clear entry and exit signals.
// - Alerts: Ready-to-use alert conditions for automated notifications.
//
// Recommended Use:
// - Timeframe: 4H (works on other timeframes as well)
// - Markets: BTC, ETH, major altcoins, and traditional assets.
//
// Advantages:
// - Combines short-term and long-term trend detection.
// - Filters out false signals in choppy markets.
// - Visual and alert-based trade setups for easier execution.
// ───────────────────────────────────────────

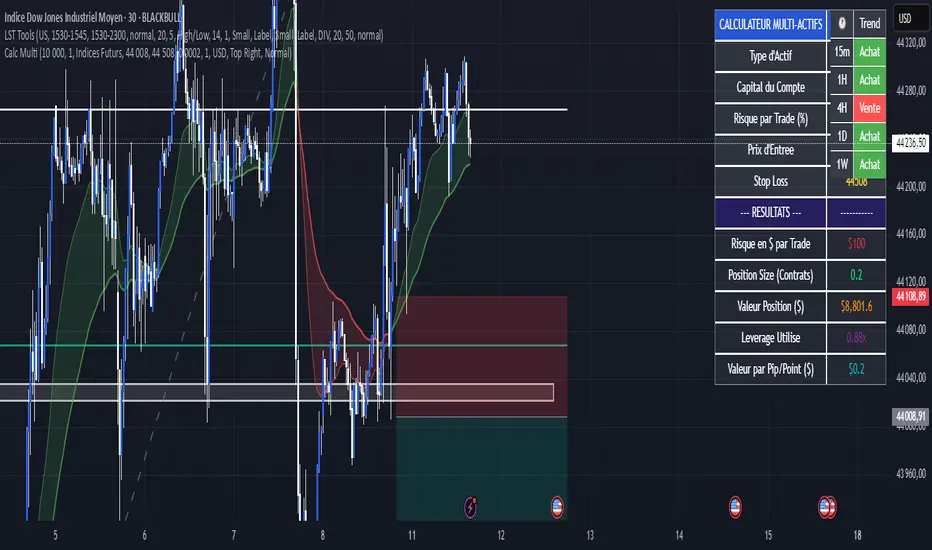
Calculateur Position Size Multi-ActifsThe Multi-Asset Position Size Calculator v6 is a fully customizable Pine Script indicator designed to help you determine the optimal position size based on your risk tolerance across any market: Forex, stocks, crypto, futures indices, or commodities. Features include:
Asset Type Selector: Choose between Forex, Stocks, Crypto, Futures Indices, or Commodities
Account Capital & Risk: Set your total account size and risk percentage per trade
Entry Price & Stop-Loss: Configure your entry and stop-loss levels directly
Automatic or Custom Pip/Point Value: Automatically calculates pip/point value by asset class or enter your own
Contract Size Adjustment: Define contract sizes (e.g., 100,000 units for Forex, 1 for stocks/crypto)
Margin & Leverage Display: View your used leverage and position value in real time
Risk Alerts: Warnings for invalid inputs, high leverage (>10×), and asset-specific risk settings (e.g., crypto leverage)
Integrated Table Interface: On-chart table with adjustable position and text size
Optional Price Level Drawing: Display entry and stop-loss lines on the chart
Trade any market confidently with precise, asset-tailored position sizing and risk management.
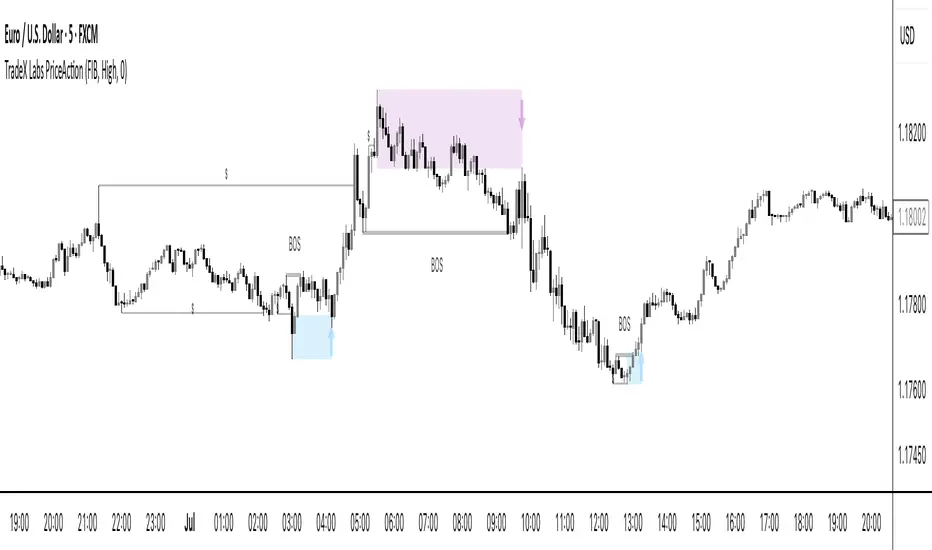
TradeX Labs PriceActionTradeX Labs Price Action — Multi-Layered Market Structure & Liquidity Visualizer
This invite-only script is a unified price-action framework for traders who want a clear, multi-timeframe visual map of structure, liquidity events, and execution zones. It is not a simple combination of existing tools — all modules are custom-built in-house and designed to work from a shared data model, ensuring every feature interacts seamlessly with the others.
Purpose & Core Design
The script’s foundation is a fractal-based swing engine that detects high-quality structural pivots. These pivots form the anchor points for:
BOS (Break of Structure) and structural shift detection
Liquidity sweep identification for stop hunts and inducements
Session range mapping (e.g., Asian high/low)
Rule-based zone projection using displacement and retracement logic
Rather than plotting isolated indicators, every detection method feeds into a single structure model so that BOS, liquidity events, and zones are all derived from the same underlying market map.
Zone Generation & Entry Mapping
Zones are calculated from swing-to-swing displacement legs and projected using Fibonacci presets (50 %, 61.8 %, 78.6 %). Users can select:
Calculation method: Fibonacci, Point of Interest (POI), or both
Zone frequency: High (wider), Medium (balanced), or Low (deeper) retracement levels
Extension length: Forward projection in bars to match chart timeframe
This ensures zones are consistent, structurally relevant, and adaptable to different styles.
Inducement & Liquidity Filters
For refined context, setups can be filtered by inducement type:
Minor: Sweeps of current day/session highs or lows
Medium: Sweeps of previous day’s highs/lows
Major: Sweeps of weekly highs/lows
Filters may run independently or in combination, hiding zones that lack interaction with key liquidity levels.
QuickStrikes Session Filter
QuickStrikes is an optional filter that checks BOS and/or entry levels against the Asian session high/low:
V1 (BOS validation): BOS position relative to session range
V2 (Entry validation): Entry zone position relative to session range
V3 (Combined): Both BOS and entry must meet positional criteria
Multiple modes can be active simultaneously, and all selected conditions must pass for a setup to display.
Custom Visuals & Usability
Every plotted element — zones, BOS labels, inducement levels, arrows, risk/reward boxes — can be styled to match any chart theme. The optional visual panel provides an at-a-glance risk-to-reward display.
Disclaimer
This is an original, closed-source TradeX Labs tool built entirely from proprietary logic referencing known concepts (e.g., Fibonacci ratios, session ranges, swing detection) within a rule-based framework. It produces visual analysis only and does not predict price or guarantee results. Default settings are for illustration; traders should adjust to their instrument and timeframe.
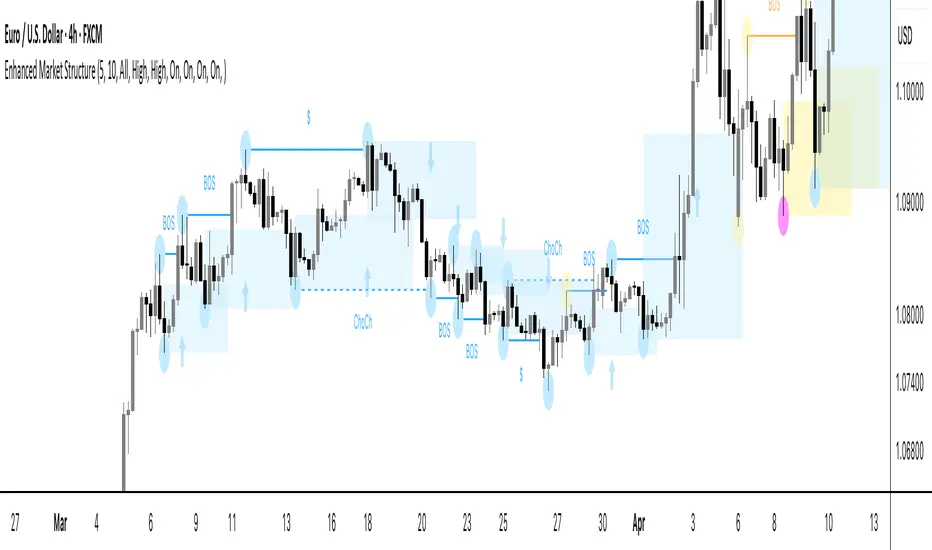
Enhanced Market StructureEnhanced Market Structure — Multi-Timeframe Liquidity & Structure Engine
This invite-only tool is a purpose-built market-structure framework that blends multiple analytical layers into a single, rule-driven visualization. It is not a generic mashup — each component is custom-coded in-house and interconnected to provide traders with a contextual map of price action across timeframes.
Purpose & Scope
The script consolidates structural shifts, liquidity events, and high-value zones from higher-timeframe analysis (e.g., 4 H, Daily) into the active trading chart. It draws on price-action concepts such as displacement, liquidity sweeps, and retracement zones, but implements them through its own coded logic, allowing traders to read structure without manually scanning multiple charts.
Core Framework & Interactions
Rather than running unrelated indicators side-by-side, all components here feed into each other:
Swing Engine — A zigzag-style pivot detector filters out low-quality swings using displacement thresholds. These swings anchor structural break logic and define leg boundaries for retracements.
Structural Logic — BOS and CHOCH events are generated from swing shifts and displacement confirmation, then validated against liquidity-sweep checks.
Liquidity Mapping — Stop-hunt wicks and sweep zones are automatically flagged to add confluence to break events and rejection patterns.
Retracement & Zone Builder — Custom Fibonacci presets (50 %, 61.8 %, 71.8 %) project consistent high/medium/low-risk entry zones. These zones are classified as external, internal, or microstructure, and extend forward to track price interaction.
Multi-Timeframe Overlay — Higher-timeframe structure remains visible while working on lower execution charts, preserving narrative context during intraday decision-making.
Every module is built from scratch so that structural events, sweeps, and zones all share the same internal data model — meaning they are synchronized rather than “bolted together.”
Visual Outputs
BOS / CHOCH labels with directional color-coding
Liquidity-sweep markers and rejection tags
Bullish/Bearish zones by structural type (external, internal, micro)
Optional Fibonacci overlays on displacement legs
Zone contact arrows marking price interaction (informational only, not trade signals)
Settings Overview
Key adjustable parameters include pivot sensitivity, zone extensions, type filters (all/external/internal), risk-tiered entry zones, internal-structure display, contact arrow toggles, BOS/CHOCH styling, higher-timeframe selection, and optional Fibonacci overlays.
Disclaimer
This script is original in design and execution. While it references well-known concepts, all calculations and visual logic are proprietary. It provides visual analysis only and does not generate or recommend trades. Default parameters are for demonstration; users should adapt settings to their own instruments and timeframes.
Fractal Suite: MTF Fractals + BOS/CHOCH + OB + FVG + Targets Kese Way
Fractals (Multi-Timeframe): Automatically detects both current-timeframe and higher-timeframe Bill Williams fractals, with customizable left/right bar settings.
Break of Structure (BOS) & CHoCH: Marks structural breaks and changes of character in real time.
Liquidity Sweeps: Identifies sweep patterns where price takes out a previous swing high/low but closes back within range.
Order Blocks (OB): Highlights the last opposite candle before a BOS, with customizable extension bars.
Fair Value Gaps (FVG): Finds 3-bar inefficiencies with a minimum size filter.
Confluence Zones: Optionally require OB–FVG overlap for high-probability setups.
Entry, Stop, and Targets: Automatically calculates entry price, stop loss, and up to three take-profit targets based on risk-reward ratios.
Visual Dashboard: Mini on-chart table summarizing structure, last swing points, and settings.
Alerts: Set alerts for new fractals, BOS events, and confluence-based trade setups.
