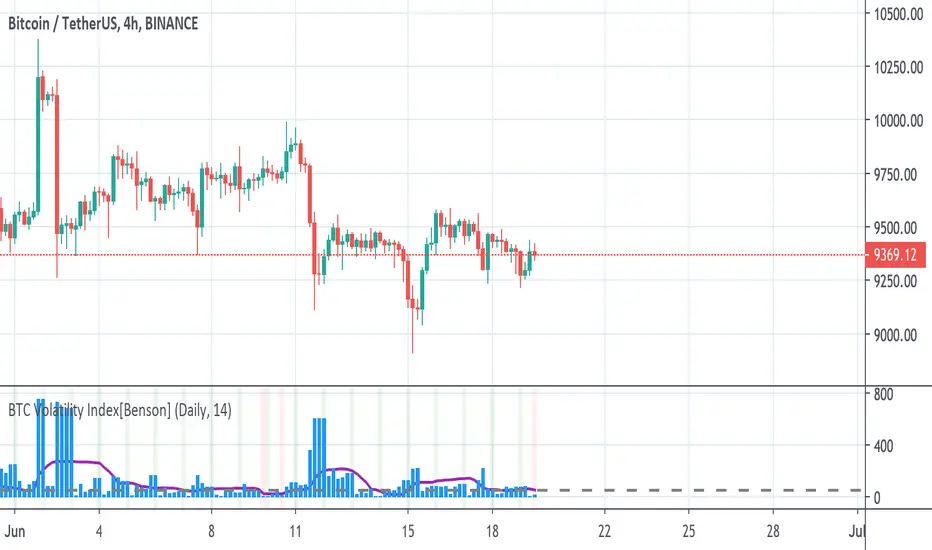
BTC Volatility Index[Benson]This indicator is for choosing the best timing to long BTC move future on FTX.
The basic idea is that when BTC's price volatility Index is relatively low(under 50 in 4hr timeframe or under 200 in D timeframe), it's more likely to have huge volatility afterwards, which it's a good time to long BTC's move future.
Green background --> Move future expected strike price
Red background --> Good timing to long BTC move future
Bitcoin (Mata Wang Kripto)
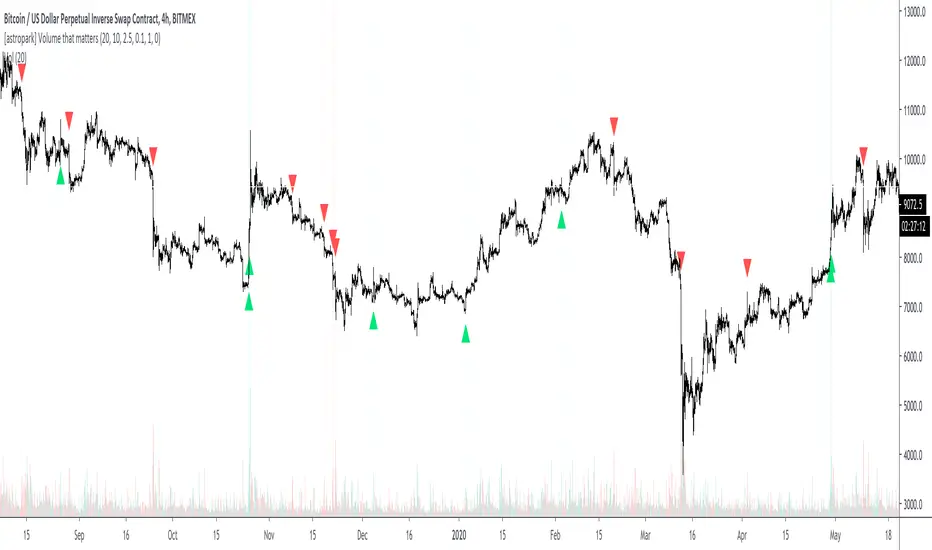
[astropark] Volume that mattersDear Followers,
does volume say something about market makers and what will happen in near future?
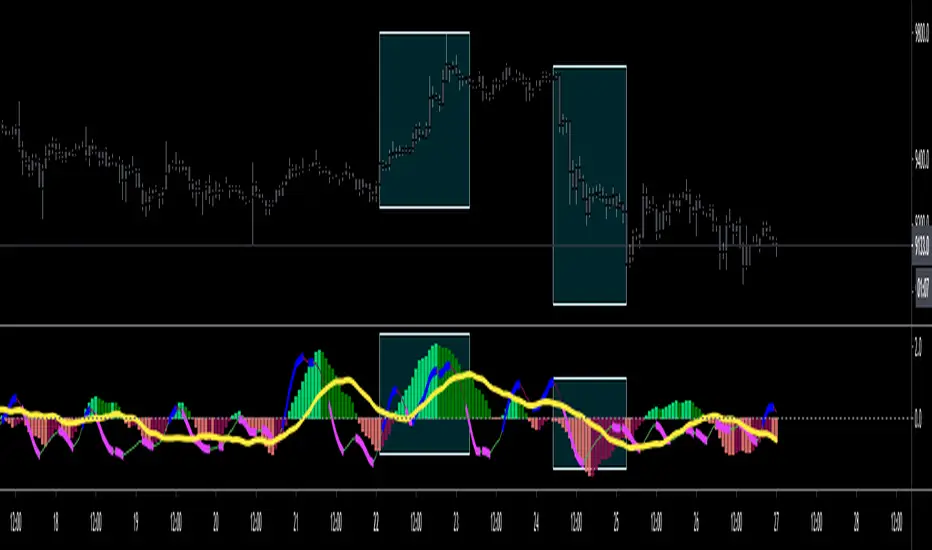
Today a new Price Action Tool , the "Volume that matters" indicator.
When a Market Maker executes his/her orders, there is no way he/she can do it without giving us some footprints: volume!
Specific Volume spikes happen as
reactions at support or resistance range , as well as at supply and demand zones
market makers' actions
trend switching in short-term and mid-term future
They can be both bullish or bearish , but the real problem is that not all, but only a few volume candle matters ! And this tool will filter them for you.
This indicator works
on every timeframe (eg. 15m, 30m, 1h, 2h, 4h, 6h, 1D, ...), the higher, the better!
on cryptocurrencies (eg. XBTUSD, ETHUSD, ETHBTC, both USDT and BTC markets, ...)
on forex (eg. EURUSD, GPBUSD, JPYUSD, ...)
on stocks (eg. AMZN, FB, TSLA, GOOG, NFLX, ...)
on commodities (eg. GOLD, SILVER, OIL, ...)
This indicator has following options:
edit volume filter and period analysis
edit filter based on fixed or percentage volatility change
edit filter based on candle value size
show a suggestion of possible entries and stoploss
You can enhance your trading by using it together with my "Engulfing that matters", my "Pinbar that matters" and my "Breaker Blocks (BB) and Supply/Demand Order Blocks (OB)" indicators, so you can easily spot confluences and have more confidence in trades.
Here my Engulfing that matters indicator
Here my Pinbar that matters indicator
Here my Breaker Blocks (BB) and Supply/Demand Order Blocks (OB) indicator
Here below some examples on how to use the indicator.
BTCUSDT 1D
ETHUSD 4h
LINKBTC 1h
EURUSD 4h
AMZN 1h
XAUUSD 4h
Here below an example of suggested entries and stoploss
This is a premium indicator , so send me a private message in order to get access to this script .
MultiWave v2 | CryptoProToolsThis is a release highly requested in our Discord server.
Finally we have an update / official release of our original MultiWave indicator
On top of the standard signals (displayed as the dots on chart) and alerts we now also have "trend signals" with various options (displayed as the triangles on chart).
These new trend signals still use the same multi wave algorithm but trigger differently for some quite nice results.
Also added the option for smoothing on all three wave plots. There are 10 levels of smoothing to choose from and each plot can be tuned with different levels of smoothing.
For access and further information about this or any of our other indicators please click the link to our website below.

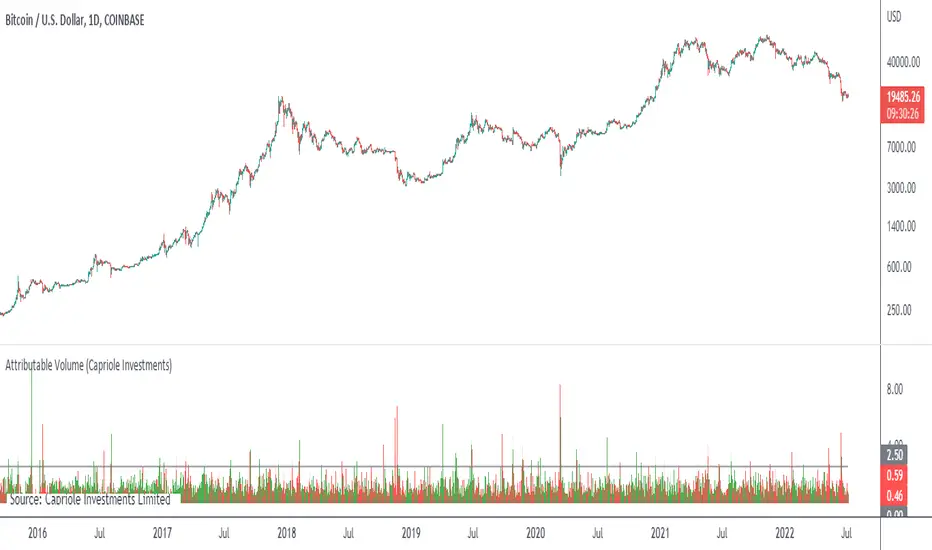
Attributable VolumeA volume indicator which calculates "Attributable Volume”, the portion of volume which contributed to the direction in which the candle moved.
Attributable Volume is calculated as: Total volume excluding the "counter wick" volume.
Where for a green (up) candle, the "counter wick" volume is the top wick volume.
In theory, Attributable Volume should better represent the effort of directional thrust of each candle.
By default, this indicator displays “Attributable RVOL”, but can be set to:
Attributable RVOL
RVOL
Attributable Volume
Volume
Note: RVOL = Relative Volume, the current volume divided by the Volume moving average. RVOL can be used to identify major moves, and potential starts/ends to trends.
MAPS - Momentum ConsensusA re-imagining of Bill William's well known Awesome Oscillator. This indicator works similarly to Bill's but from my experience, it's able to detect divergences more frequently and with better accuracy.
Use the link below to obtain access to this indicator
Altcoin Bullphase"Altcoin Bullphase" is an indicator to check if altcoins are currently in a bullphase/altseason.
The indicator is checking if Bitcoin is above or below a certain type of Moving Average and paints the color of the candles on the chart and tradingpair of your choice either green or gray for above or below the Moving Average.
NOTE: You have to disable the border color of the candles or use grayscale to get the look from the preview.
Default setting is 20 week moving average as it has the best history of calling an altcoin season.
Altcoins generally do really well when Bitcoin is above the 20 week moving average and don't do well when it falls below.
This indicator makes it easy to compare the performance of altcoins in these different phases and helps deciding on the future trend of a coin.
This script works for any altcoin, currency or stocks. Even Oil if you like to do that.
You can choose the type of MA between SMA , SMMA , EMA , WMA and VWMA .
You can set a static timeframe from 4h, 1D, 3D and 1W.
You can set any MA from 20 to 200.

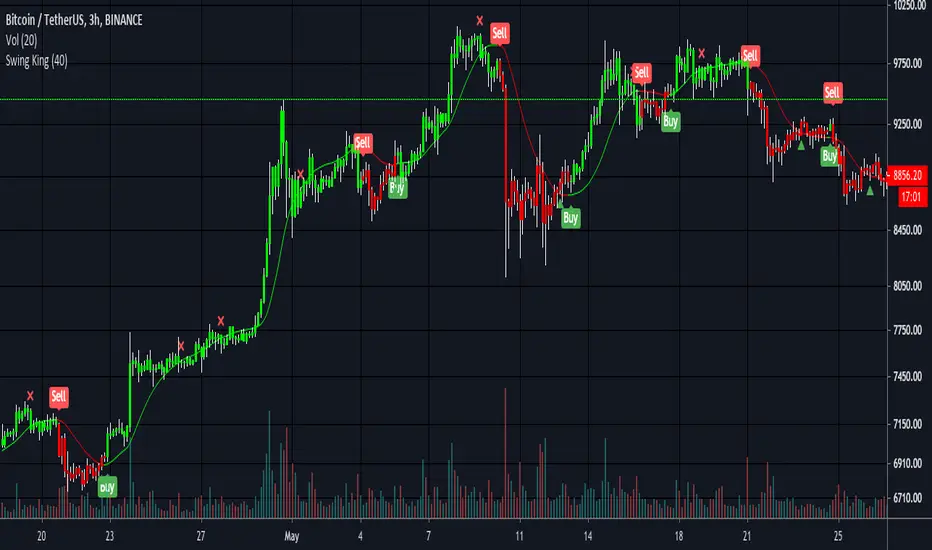
Swing King v1Utilising short and medium term trends, Swing King is perfect for riding the crypto waves. Built with the aim of smashing Bitcoin’s buy and hold return. After 5 months (Jan 2020 to May 2020) of testing and tweaking, Swing King is ready for release.
Setup with default Bitcoin settings, Swing King returned 289% in the 5 months of testing compared to buy and hold return of 29%. That’s by longing and shorting 100% of equity at 1x leverage.
Results of 5 months of testing:
1 bitcoin → 3.02 bitcoin
$7,340usd → $28,589usd
Backtesting on Ethereum had similar results. In 6 months it turned 10 eth into 14.5 eth and doubled the bitcoin value - compared to a buy and hold value of 31%.
These results were achieved with:
- Using 0.2% fees and slippage for worst case scenario
- Not using Heiken Ashi candles to fake backtest results
- No stop loss and 30% long take profit
Expect to be in trades for days and keep your losses small while letting the winners run.
Also includes trend weakening signals for manual take profit zones (cross is bullish trend weakening and triangle is bearish trend weakening) and colour coded barcolours to keep trading simple.
Green = all signals met to long
Red = all signals met to short
DM for access and pricing. Places will be limited.
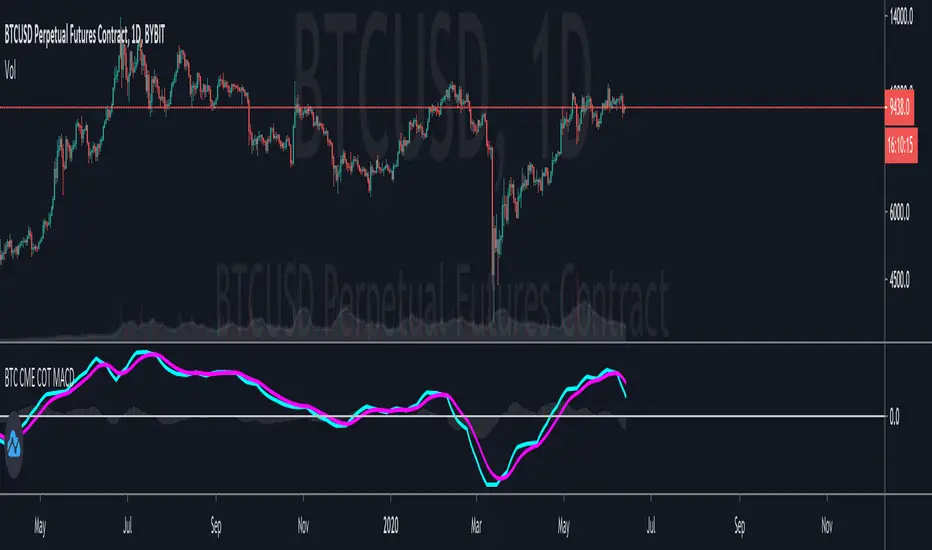
Bitcoin CME Retail vs Professionals MACD
This is an interesting study using the data provided by the Bitcoin CME Commitment of Traders report.
The MACD plot the difference between the Retail Traders positions and the Professional Traders positions.
The general idea is that Professional Traders have a better read on the market than Retail Traders.
The signal line helps to identify the trend that it is moving in.
I believe that this plot helps to visualize the overall market sentiment better than the raw COT data.
Try it out and let me know what you think!
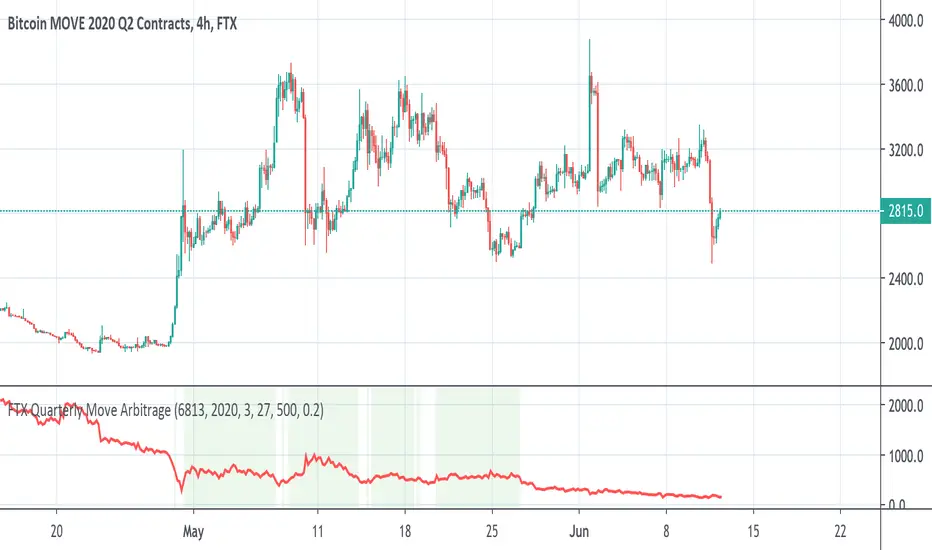
FTX BTC Quarterly Move ArbitrageThis script is for arbitraging BTC's volatility on FTX.
We use 3 factors to detect the best timing for arbitraging:
1. BTC Quarterly Move current price
2. BTC Quarterly Move strike price
3. BTC current price
When green background appears, long BTC and short BTC move.
When red background appears, short BTC and short BTC move.
Cracking Cryptocurrency - IchimokuCracking Cryptocurrency Ichimoku
The Ichimoku Cloud is designed to measure both momentum and trend. This script is optimized for **Cryptocurrency** by default but the settings can easily be adjusted from the Input Window to trade on any asset.
The core of the Ichimoku Strategy can be broken down into two facets, depending on whether you prefer to trade short-term or long-term. The Ichimoku is a trending indicator by default, it will not catch bottoms or tops. It is a momentum indicator .
Features & Functions
Multiple Time Frames Feature: With this feature, you can view the Ichimoku of a different time frame than you are currently viewing. This is very useful for looking at daily support and resistance (Kumo, Chikou) but wishing to trade a different strategy (Price Action, Moving Averages, etc.) on a lower time frame.
Short-Term Strategy
Revolves around Tenkan and Kijun crosses. Should the Tenkan crossover the Kijun, that is a bullish indication, and a signal to buy or go long.
Conversely, should the Tenkan crossunder the Kijun that is a bearish indication, and a signal to sell or go short.
In the settings, you can choose to plot Tenkan/Kijun crosses. With this option selected, several things will occur when Tenkan/Kijun crosses happen.
1. The current bar will change colors depending on whether the signal is a buy or a sell. Buy = Aqua, Sell = Fuchsia
2. A dot will appear on the Tenkan. Buy = Green, Sell = Red
3. A label will appear above or below bar indicating the correct decision. Buy = Buy, Sell = Sell.
Long-Term Strategy
Revolves around price closing above or below the Kumo Cloud itself. Should price close above a bearish Kumo Cloud, that is a bullish indication, and a signal to buy or go long.
Conversely, should price close below a bullish Kumo Cloud, that is a bearish indication, and a signal to sell or go short.
In either case, it's important to understand what the cloud breaks are representing. They are representing a potential shift in the dominant trend. Ichimoku attempts to identify when that shift happens, so we can get on the side of the emerging trend.
In the settings, you can choose to plot Kumo Cloud Breaks. With this option selected, several things will occur when Kumo Cloud breaks happen.
1. The current bar will change colors depending on whether the signal was a buy or a sell. Buy = Aqua, Sell = Fuchsia
2. A label will appear above or below bar indicating the correct decision. Buy = Buy, Sell = Sell.
---
Please note, that the Kumo Cloud Breaks indicate stronger signals, and thus more weight should be given to them than TK Crosses. However, depending on what time frame you are trading on, Kumo Cloud breaks are a rarer occurrence than TK Crosses.
---
Additional Features
---
The Chikou (Lagging) Spam is run through a Zero Lag filter. The reason for this is aesthetic. The smoothing can be disabled in the input windows.
The purpose of the Chikou Span is to identify Support and Resistance.
If you have any questions, success or failure stories, or seek advice feel free to send me a private message here on Trading View. Trade safely.

Cracking Cryptocurrency - Exponential Moving AveragesCracking Cryptocurrency - Exponential Moving Averages
This is the preferred EMA Indicator of Cracking Cryptocurrency Traders. We have based our statistical levels of support and resistance , trend, and momentum utilizing Fibonacci Numbers for our EMA inputs.
This script utilizes the Key Numbers of 8, 13, 21, 55, 100, and 200 as we have found those to work the best for Bitcoin and other Cryptocurrencies.
Features and Functions
Multi-Time Frame Function
Multiple Source Rendering
Multiple Smoothing Options
Adjust Look back Length
Plot Custom Signals
Multiple Time Frame Feature
Do you want to watch the EMA's of a higher or lower time frame while analyzing the price action of a different time frame? With this indicator, it's quite easy! Just select the desired Time Frame to display your EMA's and they will automatically change without affecting the price action you're currently looking at, or having to change your Time Frame Resolution. This has been upgraded and simplified with a drop-down menu for selecting your desired Time Frame.
Plot Crossovers
Want to keep it simple? Select Plot Crossovers and this script will display optimum times to buy and sell based on Trending Momentum utilizing your selected EMA crosses. Highly effective, back-test it and see!

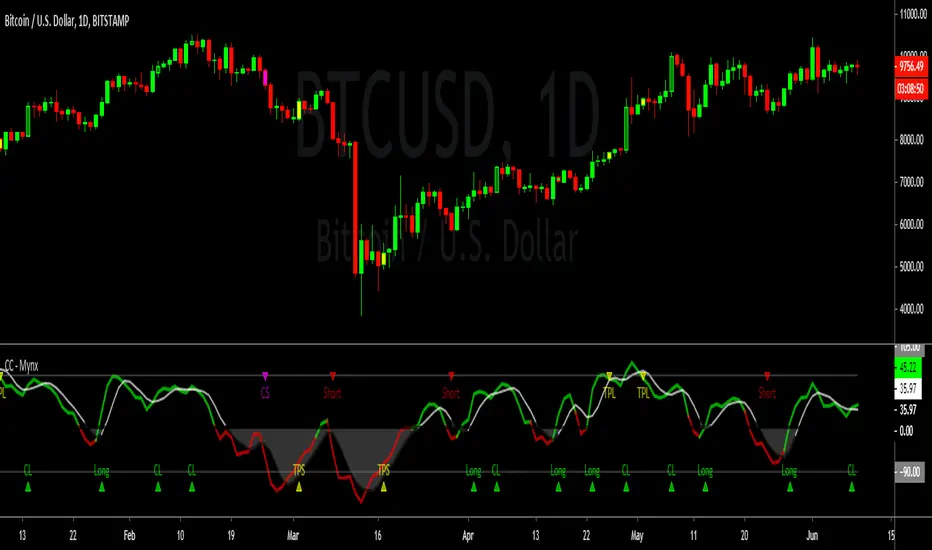
Cracking Cryptocurrency - MynxCracking Cryptocurrency - Mynx
Mynx is a powerful trend-following indicator which logic built in to facilitate nuanced aspects of PTP strategy. Continuation Trades, Early Exit Signals and Full Take Profit Signals are all built into Mynx. Mynx is designed to identify when the market is signaling that a trend is beginning as well as signalling when you may safely re-enter into a pre-existing trend. It also tells you where to exit prematurely to avoid significant capital loss on a losing trade, and when to take full profit in order to get out of a position at maximum profitability.
Should you have difficulty adding it you can search for 'Cracking' in the indicator window of your Trading View Platform, and it will appear along with the rest of our indicators.
As you will notice, Mynx is similar in nature to Time Transformation, in that it is both a Centered Oscillator and a Line Cross Indicator. This allows a wide range of possibilities which we will exploit to extract profit out of the market.
The most important line is the BPM or Mynx Line. This is going to be the thicker, brighter colored line on our indicator that will switch from green to red depending on the dominant trend. The color changing feature of this line will denote where our indicator is in relation to our zero line. If our BPM Line is green, then price is trading above our zero line, if red than it is trading below. Therefore we can quickly see what our last signal was, and whether our indicator is bullish or bearish depending upon the color of our BPM Line. If Green, we are in long territory, if red we are looking for shorts.
Our second area of importance in this indicator is our Noise Line and Area. This is the black or white line which will change color depending on where Noise is relative to our zero line. Black if above the zero line, meaning we are in long territory, and white if below, indicating we are in shorting territory. The area between the zero line and the Noise Line is shaded black or white as well, and denotes no-trade zones for us. If our BPM Line is within our Noise Area, we are not in a trade. We are only in a trade when our BPM Line is breaking away from Noise Line, either to the upside or the downside. When BPM curls back and re-enters our Noise Area, that is an indication to exit our position regardless of our Take Profits or Stop Losses.
Our Zero Line is indicated by a thick black line for easy of identification, which will be our primary signal generator when our BPM Line crosses above or below it, and our faint gray lines are going to be our Overbought and Oversold levels respectively. These will play a function in how we take profits.
Settings
Let's take a look at the settings of our Mynx Indicator.
The first field we will see is our BPM Source, how many beats per minute we want in our cycle length. The default is ten, and through back-testing I find this to be the optimum level.
Our Noise Filtration level corresponds to our Noise Line and Area. Again, I find the default settings as I have programmed them work best on all time frames, however you might find optimum signals by playing around with these settings. As in all things, nuance and experimentation is what excellence is borne of.
We can adjust our Oversold and Overbought Parameters, making it easier or harder for us to get a Full Take Profit Signal from this indicator. We can also adjust our Base Line. Keep in mind, our Base Line is going to be an Exponential Moving Average and here we can adjust the length of our desired Base Line.
To incorporate our Multi-Time Frame feature, below this section we can see that the default option will be to use a Base Line of the current time frame. If however, we want to trade on a Lower Time Frame and reference a base line of another time frame, we can simply un-check that box and input the desired Time Frame of the Base Line we wish to reference.
Now for the true appeal of Mynx in user friendliness, below this we can see that we have full control of the signals we want Mynx to generate for us. By default, we have enabled Mynx's best signals, Trending Signals. We can choose to plot Continuation Crosses and Reversals Within the Trend, both of which are trades we are allowed to take and I recommend taking in a proper PTP system. We can choose to use Mynx as a reversal indicator, to plot Raw Reversals against the trend, which I do not recommend enabling unless you want to by pass PTP entirely. We can choose to plot when Mynx gives us a Full Take Profit signal, a signal to take full profits on our position. We also have the option to plot for early exits. The Option for Sensitive Stop Loss is the same as early exits, and will plot an exit signal every time the BPM Line drifts back into the Noise Area. These are fairly easy to see upon bar closes, so I left it disabled by default. If you enable it you will get a visual signal to exit your position upon a bar close.
One final note, we can adjust the source upon which Mynx is basing her signals. By default, this value is hl2 , which I found in back-testing to be the most efficient with minimum draw down. However, there is a higher profit potential with HLC3 and OHLC4, but be warned that with that extra profit potential comes the risk of more draw down. The draw down settles out in the end, however there will be months where you drastically under perform Alpha, where as hl2 keeps you consistently outperforming the market at all times. This is a very personal choice, and I leave it upon you to make the right one.
In our Style Tab, we can adjust our Color Scheme to better accommodate the way that you trade. I have done my best to be very concise and detailed in labeling to make this task easy.
Strategy
Please let me know of your success stories with Mynx, as well as any features you think would be helpful to add. If you notice any errors within it, please notify me so I can fix them. I have back-tested this strategy many times in many different settings, and it consistently outperforms the market and generates Alpha. I now place it within your hands to achieve the same results. Trade Safely.
Cracking Cryptocurrency - Quadrigo Position SizingCracking Cryptocurrency - Quadrigo Position Sizing
This indicator is designed to work in conjunction with our position sizing calculations pursuant to the Quadrigo Indicator.
This indicator will allow a trader to input their Account Balance and desired Risk % that they have decided, through their statistical analysis, provides them the greatest Return on Equity balanced against minimal draw down.
Once inputted, the Data Window will display the recommended USD Position Size. It will also pull the current price of Bitcoin, so that a recommended BTC Position Size will be calculated as well, making orders very easy to enter on exchanges that deal in BTC values for order value.
This indicator is optimized for the aesthetics of traders using TradingView's mobile app. With a simple glance you can determine your proper position size for any trade. This is helpful because the larger Quadrigo indicator can take up a lot of screen real estate when on mobile version.

Cracking Cryptocurrency - QuadrigoCracking Cryptocurrency - Quadrigo
An objective method of determining an initial Take Profit and Stop Loss, based on true market volatility and not arbitrary price levels. This indicator gives the user a powerful range of input variation, from Average to Median True Range and a myriad permutations of smoothing and look back lengths, to build an objective value from which to measure profit and stop levels.
This indicator also automatically calculates a recommended position size based on our position sizing methodology. Simply input your capital amount and desired risk level. This indicator will display your optimum position size in USD or BTC, even giving you the flexibility to select your desired exchange for BTC/USD conversion calculations.
Features & Functions
Set custom multipliers for Take Profit and Stop Loss Levels.
Select between Average or Median True Range Calculations.
Select smoothing type and look back length for True Range.
Input custom True Range Level for dialing in precise measurements.
Position Size Calculator.
Aesthetically pleasing display of Take Profit and Stop Loss Levels.
Aesthetically pleasing dashboard display of all relevant trade information including Potential Loss, Distance to Stop Loss, and TR Percentage, among other data.
Indicator displays quantity of position to be removed at each take profit for convenient order setting flow.
---
Purpose
To give clear objective stop losses and take profit levels based off price volatility rather than arbitrary price levels, percentage points, ticks, pips, etc.

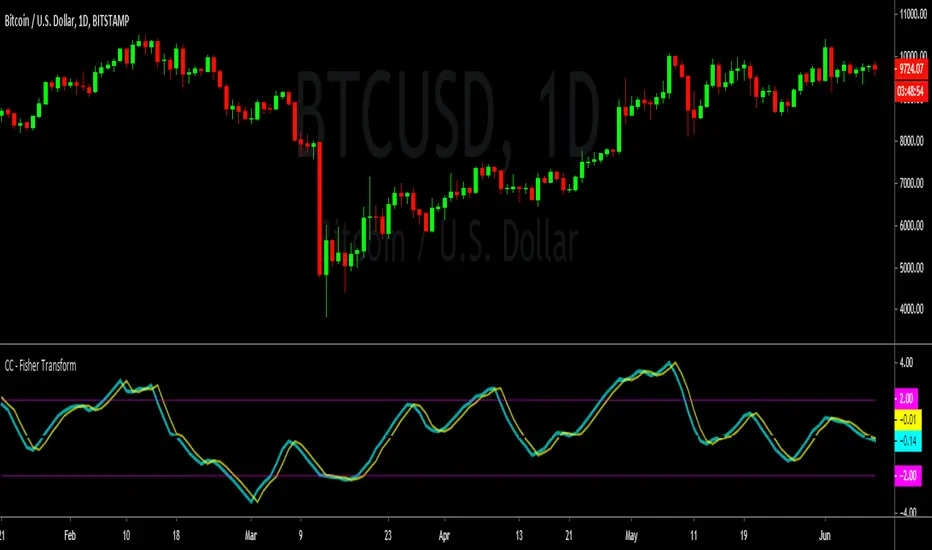
Cracking Cryptocurrency - Fisher TransformCracking Cryptocurrency - Fisher Transform
A modern spin on a classic. John Ehler's formulas helped transform a generation of traders from working with traditional indicators such as Stochastic and moving average filters to applying frequency and wave theory to their price chart analysis. There are few tools as powerful as Ehler's Fisher Transform , which transforms the behavior of price in a Gaussian Distribution, or a Normal Probability Distribution. This allows us to attain a bell curve of price, with our outliers clearly and objectively identifiable as well as accurately indicate trend direction by bisecting our wave into peaks and troughs.
Features & Functions
Simple and Clean. Only the data you want, no unnecessary information cluttering your work flow.
Adjustable Sources. Select which data source you want to compile your data from from an easy drop-down menu.
Adjustable Triggers. Standard versions of the Fisher have been unable to innovate on the Trigger Line, a vital part of utilizing this to generate trade signals and setups. In this version, choose and adjust your own Trigger and Smoothing Filter based on tried and true implementations.
Adjustable Thresholds. Most versions of the Fisher do not truly allow the customization of the algorithm to suit the asset you are analyzing. All thresholds in this version are fully adjustable to customize this indicator to work for you, not against you.
---
Purpose
To remain true to Ehler's original vision of the Fisher Transform while providing traders a functional and efficient indicator with modern innovations and conveniences.
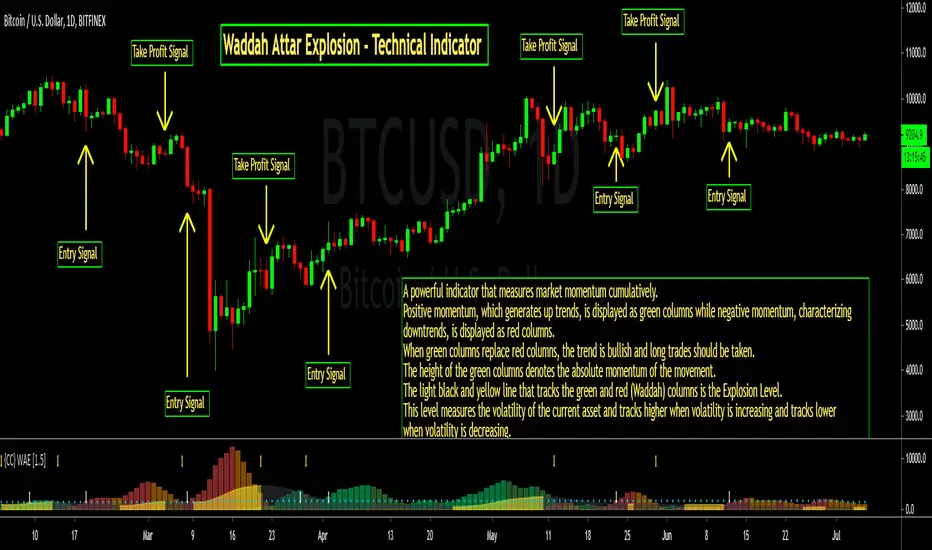
Cracking Cryptocurrency - Waddah Attar Explosion Cracking Cryptocurrency - Waddah Attar Explosion
An entry indicator that analyzes momentum and volume . This indicator is very sensitive and works very well on lower time frames for scalping, and higher time frames for confirming explosive movements or shifts in trend or rising directional momentum in the market.
This indicator can be used as an Initiator, Confirmer, or Vol. Filter. It's multiple components make it an extremely effective tool in any trader's tool belt.
Features & Functions
This indicator can be customized by adjusting the sensitivity levels, lengths, and multiplier. However, I find that the settings that I have made as default work very well. However, as with all indicators, nuance and customizing your settings to your asset class and time frame will yield greater results.
False Positive Filter - Enabling this, as it is by default, will dramatically change this indicator's sensitivity. This is designed to analyze long-term momentum and reduce the occurrence of "false positives". However, the trade off will be reduced reaction speed.
Entry Strategy - Print alerts and trading signals for many different permutations of entry strategies available with this indicator. Explosion Level Crossovers, Color Flips, Rising Explosion Level Cross, and Rising Explosion Level.
Exit Strategy - Print alerts and trading signals for many different permutations of exit strategies available with this indicator. Explosion Level Cross, Receding Delta, Color Flip, Falling Explosion Level.
Bar Coloring - This indicator colors the bars to indicate a buy or sell signal, as well as printing Up and Down arrows in the indicator pane itself. This can be disabled in the settings window.
Alerts - This indicator is programmed with Buy and Sell alerts, available from the Alerts Window.
---
Purpose
To identify likely turning points in the market, the existence of powerful momentum to confirm a directional bias, or the introduction of high volume or volatility into the market.
Cracking Cryptocurrency - Base Line What is the Base Line?
The Base Line functions as a powerful filter to our primary and continuation signals. With this indicator, we aim to provide you the best method of testing multiple Base Lines to determine what will be the best variant to fit within your trading structure.
Should you have difficulty adding it you can search for 'Cracking ' in the indicator window of your Trading View Platform, and it will appear along with the rest of our indicators.
Settings
Let's take a look at the settings of our Base Line Indicator.
Our initial Base Line Settings allow us to input the Smoothing Type, Length, Source, and Time Frame (Multi-Time Frame Function) desired. There is another option here for Channel Multiplier. There is a Keltner Channel surrounding the Base Line, you can adjust it's width with this setting.
There is a checkbox to allow the indicator to repaint when viewing higher time frame data on lower time frames. By default, this indicator will not repaint. Only if you, for some reason, want it to (for example for testing live strategies). The other aesthetic option will color the bars based on Base Line trend.
Below this are the Take Profit and Stop Loss options. By default, these will not plot. If you desire to see recommended Take Profit and Stop Loss Levels, enable the first checkbox in this section. You can select from Average True Range or Percentage types of TP and SL. You can adjust their parameters in the settings here.
Then we arrive at True Range Settings. You can select between an Average or Median, adjust look back length and Smoothing Type. You also have the option to input a custom value. This is especially helpful when trading prior to candle close, or directly after candle close to lock it to the previous candle's closing value.
Finally you can plot the Entry Qualifier. It will automatically determine trend based on close relative to the Base Line, however you can Override this with the boolean option.
Finally, two No Trade Zone conditions. Candle Size will not take trades where the absolute value of the candle was greater than the ATR multiplier you set here. Qualifier Violations alert you when candles are closing above/below your Trade Qualifier.
Strategy
This indicator's primary function is to act as a trending filter. However, it can be used for Reversal Bounces, Initiations, and Continuations all on it's own. We encourage you to test this as a robust part of your own trading strategy!

CONSOL SPOT BITCOIN OBVA better OBV analysis tool hardcoded for combined Spot Bitcoin Exchange Volume.
Will dynamically change with Timeframe
Won't Dynamically change with the ticker.
Exchanges:
STAMP BTCUSD
COINBASE BTCUSD
COINBASE2 BTCEUR
COINBASE3 BTCUSDC
COINBASE4 BTCGBP
BINANCE BTCUSDT
BINANCE2 BTCUSDC
BINANCE3 BTCPAX
BITFINEX BTCUSD
KRAKEN XBTUSD
KRAKEN2 XBTEUR

Hello VWAP "Beta"This is my 1st indicator, and my attention is to plot the VWAP "Volume-weighted average price" using the SMA "Simple Moving Average" over time... IE over the last 50,100,200 bars and just the VWAP... All of them in just one line... I have made it when I have been using the BTC/US chart, but it should work for stocks/forex or any other chart that you want to use...
I am not completely sure about this indicator and I do want to add more to this, that is how come I am posting to the community to show what I have done and people can use it and if they are open to it give me feedback or tips to make it better...
Happy trading...

[astropark] VWAP Crosses [alarms]Dear Followers,
today a new Swing and Scalping Strategy based on WVAP , mainly designed for Bitcoin and High-Cap Cryptocurrencies, like Ethereum. It works also on Forex and Stocks.
It works great since 15m and above till 1D. I suggest you to use it on 15m, 30m or 1h timeframes .
VWAP or "Volume Weighted Average Price" is a volume-based indicator similar to a moving average.
This trading indicator is used to identify market resistance and support levels and is represented as a weighted average price for the treaded volumes.
My strategy will help you identify main support-resistance level to be careful of and it will trigger a buy or a sell depending on how price will intereact with vwaps.
green means we are in a bullish trend, in fact it start with a "buy" signal
red means we are in a bearish trend, in fact it start with a "sell" signal
blue means we are in a moment where trend may change, so be careful and always remember that taking profits is awesome and have a stoploss is a must in trading
The user who wants to use this strategy, especially via an automated bot, must always set a stoploss (example 150$ from entry on bitcoin) or use a proper risk management strategy .
This is not the "Holy Grail", so use it with caution. It's highly suggested to use a proper money management .
This script will let you set all notifications you may need in order to be alerted on each triggered signals.
The one for backtesting purpose can be found here below:
This is a premium indicator , so send me a private message in order to get access to this script.

[astropark] Fair Value GapsDear Followers,
today a new epic tool, the "Fair Value Gap (FVG) Finder" .
Fair Value Gaps are quite important to trade, as they represent both volume and trading unfilled gaps, which most of the time are filled and then price reverse .
This indicator will let you set alerts on when a new FVG is found and when it is filled.
Traded together with Breaker Blocks (BB) and Supply/Demand Order Blocks (OB) , you can easily spot important points where to start a short or a long trade.
Here my Breaker Blocks (BB) and Supply/Demand Order Blocks (OB) indicator
Here below some examples on how to use the indicator.
On Bitcoin
On EURUSD

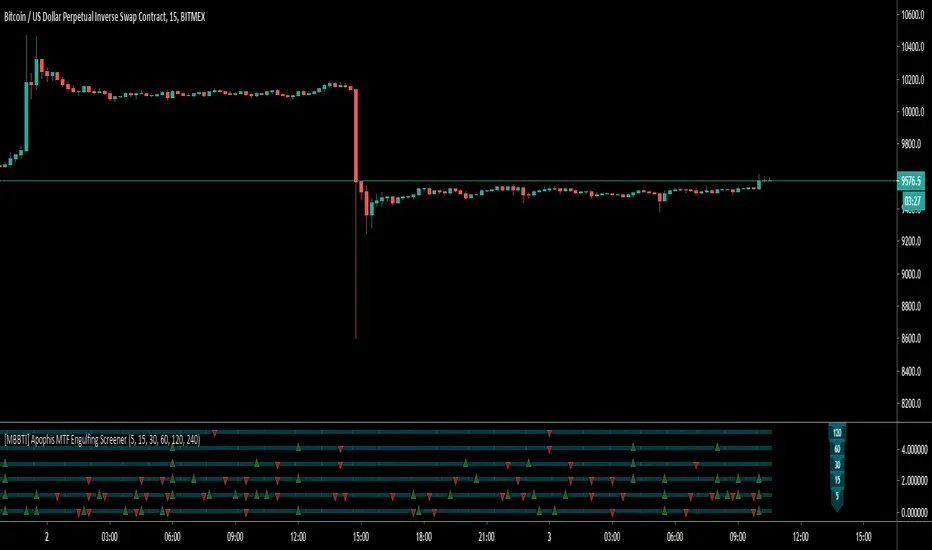
[MBBTI] Apophis MTF Engulfing ScreenerHello Traders,
Apophis MTF Engulfing Screener is based on Daveatt's Engulfing Screener and will screen for engulfing candles on multible time frames. It can help detecting not obvious engulfing candles.
How it works?
- choose your preferable time frames
- green triangle up -> bullish engulfing on this time frame
- red triangle down -> bearish engulfing on this time frame
Contact me if you have any questions or change requests
Wuuzzaa
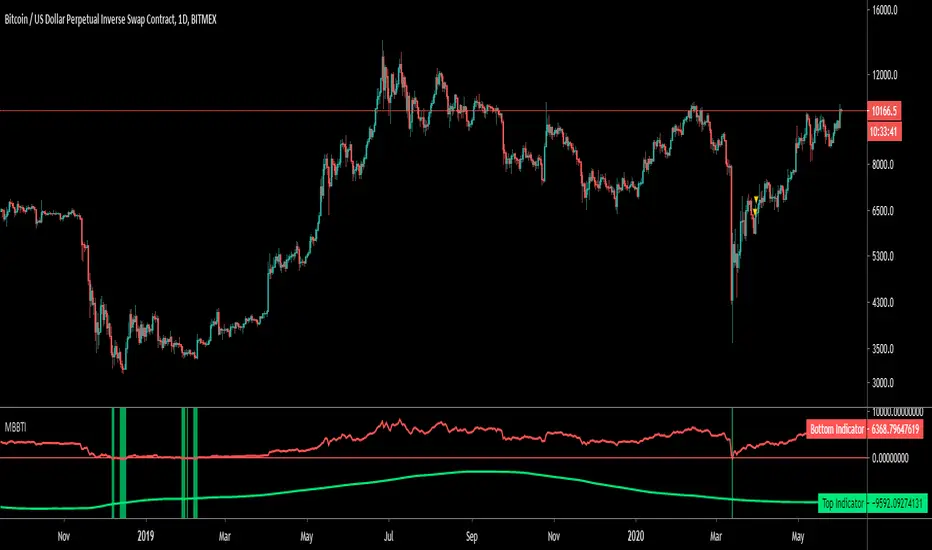
[MBBTI] BTC Thot
Hello Traders,
Thot is indicator which utilizes moving averages to indicate the potential high or bottom.
How it works?
- it utilizes different moving averages and weighting them with fibonacci multiples.
- some crosses proved indicating highs and lows in the past
- red indicates potential high
- green indicates potential low
- only good on daily chart
- check BLX for past performance
Note: This is based on past performance an not quarantining any future performance.
Contact me if you have any questions or change requests
Wuuzzaa