Bitcoin SpreadThis indicator display the current lowest and the highest value of btc on a set of exchanges for a define type of market.
Bitcoin Spread was originally made by @DayTradingItalia, i have bring his indicator to pine v4, add add some stuff to it:
5 Type of BTC Market : USDT Swap, USD and Futures (current/next contract)
Spread value
Bitcoin (Mata Wang Kripto)

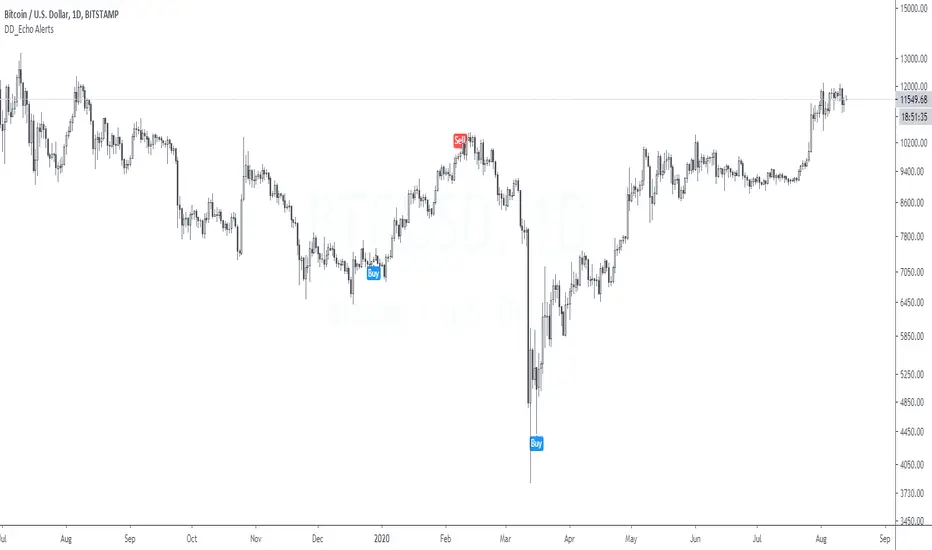
DD_Echo AlertsDD_Echo is a buy/sell trading strategy based on sentiment analysis such as fear and greed, Bitmex premium and quantity theory of money.
The performance metrics are as follows:
Net Profit: 412%
Sharpe Ratio: 1.27
Profit Ratio: 2.55
Hit Rate: 100%
If you want to access this, please DM me.
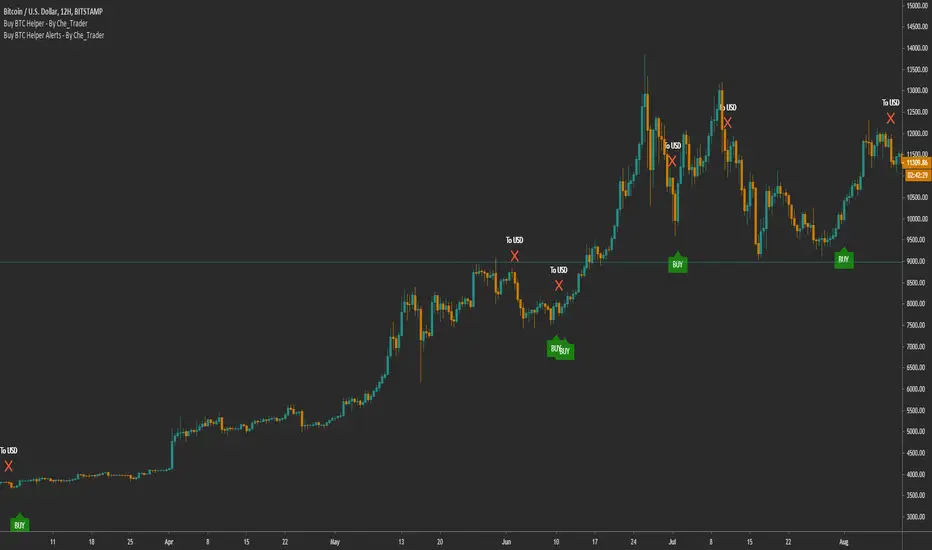
Buy BTC Helper -* Buy SPOT, sell to USD -Alerts- By Che_TraderThis is the alert version of my strategy
"Buy BTC Helper - Buy SPOT, sell to USD (BTC-ETH) - By Che_Trader"
For more information visit the link below
*****************************************************************************************************************************************************************************
To get access, you can send me a PM here or at a link in the tradingview profile.
*****************************************************************************************************************************************************************************
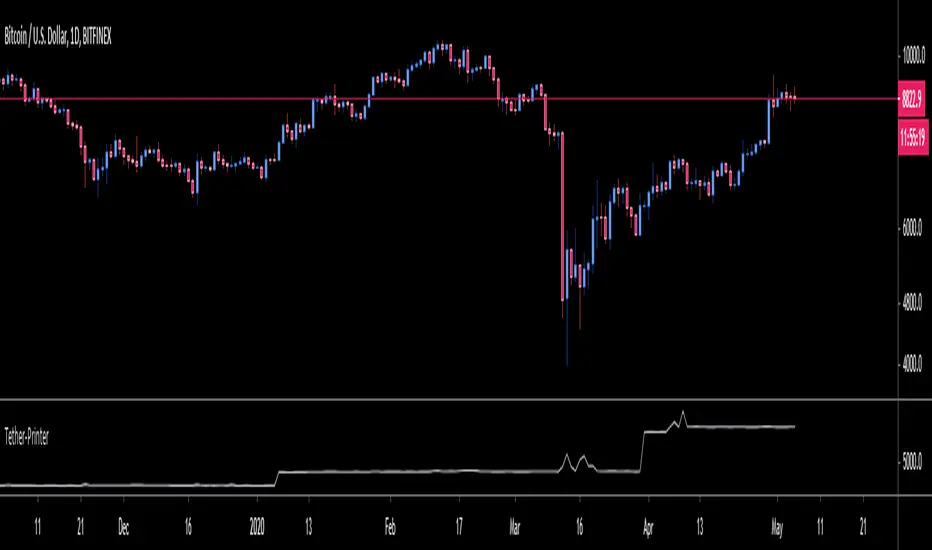
OneGeenCandle - Tether-Printer**************** OnegreenCandle - Tether Printer ************************
Shows the total market cap of USDT (US Dollar Tether) currency. Helpful for swing trading longer timeframes and indentifying new supply in the crypto market.
Buy the dip in Bull Market by BensonBuy the dip in Bull Market by Benson
This indicators is used for showing buying timing in bull market, buy BTC when the index is below 0.
牛市作多指標 By Benson
在指標下穿零軸時買入 BTC

OasisTrading OHL Levels This indicator is free to all Oasis Trading Group members.
Open, High, and Low levels for D, W, M, 90D, 12M.
Labels and Alerts coming soon.
For Access or Questions: Private message us. Thank you.

msoro daily DCATool to estimate PnL of your investment if you put in a fixed $ amount daily into btc for past year. It takes input as 365 days which can be changed as per need.

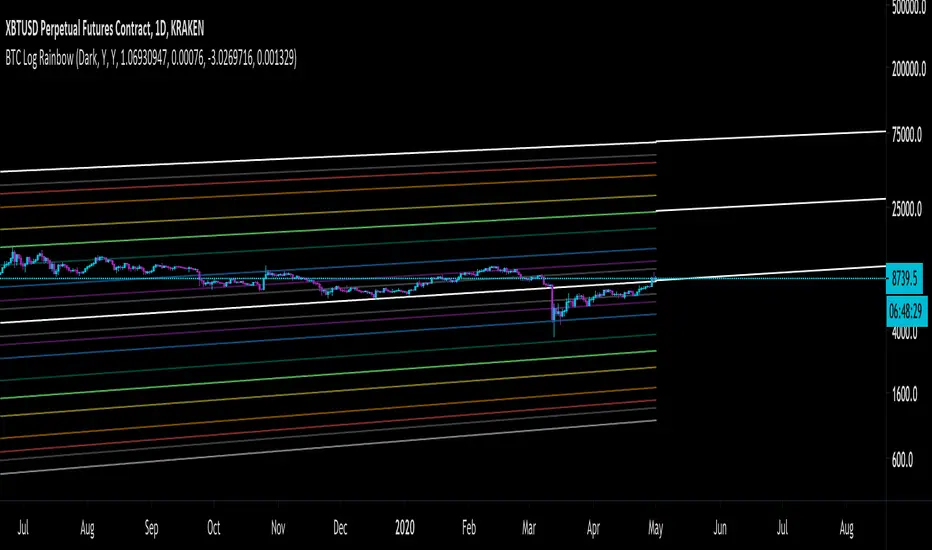
Bitcoin Fibonacci Log RegressionThe "Zero Line" is the calculated logarithmic regression of Bitcoin over the last decade.
The rainbow above the Zero Line are the Fibonacci multiples from 0 --> 1 of the log regression (0.236, 0.382, etc.)
The rainbow below the Zero Line is identical, except that the multiples are negative (-0.236, -0.382, etc.)
For the first time ever, Bitcoin broke through the Zero Line (the natural regression) when it dumped on March 12-13. It looked at though the regression was invalidated when, in fact, it simply made an unprecedented move to a lower Fibonacci multiple.
Enjoy.
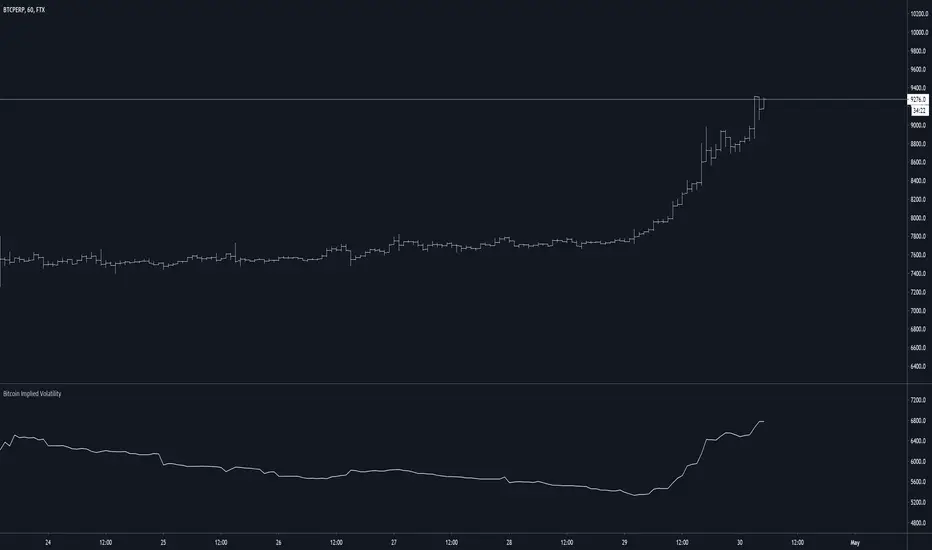
Bitcoin Implied VolatilityThis simple script collects data from FTX:BVOLUSD to plot BTC’s implied volatility as a standalone indicator instead of a chart.
Implied volatility is used to gauge future volatility and often used in options trading.
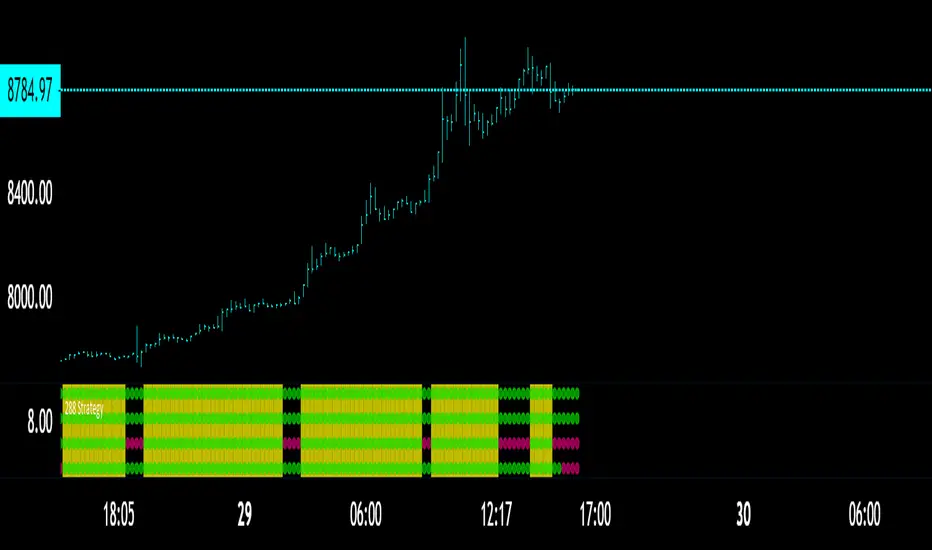
The 288 StrategyThe classic 13-55 crossover with the 220 being main trend
What I added here was two other variables
A fixed momentum for the time frame youre in, the momentum in the chart is the 30 minute while we are on the 13 minute.
A variable momentum for whatever TF you desire
Lower variable means more trades since momentum will flip more often
Higher means more of a trend playing algo
You may also mark the momentum algos OFF if you wish to use the STANDARD 13-55 / 220 Technique
In which you would just look for all 3 to hit to enter a trade AND just 2 to flip to exit/Take Profit
Back Ground will flash YELLOW for BULL
and
PINK for BEAR when all triggers are met.
To attain access DM me here or if you follow me on Twitter you can there as well!
CHEERS
The MATRIX: Ultimate Crypto Position FinderThe Position Finder is a visual representation and additional feature of the "MATRIX Ultimate Crypto Position Strategy" and it should therefore be used alongside this script.
***You can find the main trading strategy script on our profile page***
-------------------------------------------------------------------------------
-The Position Finder is a tool that allows the user to see multiple triggers at the same time on a single chart of the "MATRIX Ultimate Crypto Position Strategy".
The Position Finder consists of 3 parts, namely an entry, a re-entry and an exit part (from top to bottom). Each of these three fields is made up of several green, black or red horizontal lines in which each line corresponds to a specific trigger.
-An entry or re-entry signal is valid once all individual triggers turn dark GREEN at the same time (for the top and middle matrix fields respectively). When this happens a bright GREEN vertical line is formed. The main trading strategy script will also print "Long Entry" label. While BLACK color indicates that a certain trigger is not valid. Yes, we know. It sounds very complicated, but once you understood it, we promise it will be the most simple and dare we say, an interesting tool to use.
-An exit signal is made once a single trigger turns RED. The main trading strategy script will also print a RED colored "Long Exit" label. While BLACK color indicates that the exit signal is not triggered.
-------------------------------------------------------------------------------
For those who are interested in the rationale of why a certain entry or exit signal was made a list with triggers can be found below. It contains the complete set of triggers for the entry, re-entry and exit signals from top to bottom.
Entry Trigger List:
1: Evaluation of short term trend: Ichimoku kinko hyo indicator, conversion line related to base line.
2: Evaluation of longer term trend: Ichimoku kinko hyo indicator, price related to the ichimoku cloud.
3: Confirmation of the longer term upward trend: Ichimoku kinko hyo indicator, lagging span related to ichimoku cloud.
4: Confirmation of short term upward trend: Ichimoku kinko hyo indicator, price related to conversion line and base line.
5: Evaluation of longer term trend projection: Ichimoku kinko hyo indicator, projected ichimoku cloud shape.
6: Confirmation of short term trend: Ichimoku kinko hyo indicator, lagging span related to the price.
7: Confirmation of short term trend: Ichimoku kinko hyo indicator, lagging span related to the price (alternative method).
8: Confirmation of the longer term trend: Ichimoku kinko hyo indicator, lagging span related to ichimoku cloud (alternative method).
9: Confirmation of the longer term trend: Moving averages.
10: Confirmation of sufficient momentum: Macd indicator.
11: Evaluation of overbought or oversold conditions in the price: RSI indicator.
12: Evaluation of price equilibrium: Ichimoku kinko hyo indicator, price related to ichimoku cloud , conversion line, base line.
13: Confirmation of general trend: Vortex indicator.
14: Evaluation of price equilibrium: Ichimoku kinko hyo indicator, price related to ichimoku cloud , conversion line, base line (alternative method).
15: Evaluation of volatility: Choppiness index indicator.
16: Evaluation of volume: Volume indicator.
Re-Entry Trigger List:
1: Confirmation of short term upward trend: Ichimoku kinko hyo indicator, price related to conversion line and base line.
2: Evaluation of short term trend: Ichimoku kinko hyo indicator, conversion line related to base line.
3: Confirmation of the longer term upward trend: Ichimoku kinko hyo indicator, conversion line and base line related to the ichimoku cloud .
4: Confirmation of sufficient momentum: Macd indicator.
5: Confirmation of sufficient momentum: Macd indicator (alternative method).
6: Evaluation of overbought or oversold conditions in the price: RSI indicator.
7: Confirmation of sufficient momentum: Macd indicator (alternative method).
8: Confirmation of general trend: Vortex indicator.
9: Confirmation of the longer term upward trend: Ichimoku kinko hyo indicator, price related to the ichimoku cloud .
10: Evaluation of bullish/bearish territory.
Exit Trigger List:
1: Confirmation of short term trend reversal: Ichimoku kinko hyo indicator, conversion line related to base line.
2: Confirmation of neutral territory: Ichimoku kinko hyo indicator, price related to the ichimoku cloud .
3: Confirmation of bearish territory: Ichimoku kinko hyo indicator, price related to the ichimoku cloud .
4: Evaluation of extremely overbought conditions in the price: RSI indicator.
5: Confirmation of bearish divergence signals.
-------------------------------------------------------------------------------
Reminder: Use this trading strategy at your own risk and trade responsibly. We are not responsible for any financial loss using this strategy.
***The script is invite-only, message us to get script access***

Wick SniperThis indicator is free to all Oasis Trading Group members.
The Wick Sniper was created to catch volatile moves that are extended from the mean. It uses an advanced ATR formula to follow price like a band, with an upper deviation and a lower deviation. I have also added a 1 candle offset so that the moves are not in "hindsight". Feel free to experiment with the inputs to find what is best for your asset.
For Access or Questions: Private message us. Thank you.

eha MA CrossIn the study of time series, and specifically technical analysis of the stock market, a moving-average cross occurs when, the traces of plotting of two moving averages each based on different degrees of smoothing cross each other. Although it does not predict future direction but at least shows trends.
This indicator uses two moving averages, a slower moving average and a faster-moving average. The faster moving average is a short term moving average. A short term moving average is faster because it only considers prices over a short period of time and is thus more reactive to daily price changes.
On the other hand, a long term moving average is deemed slower as it encapsulates prices over a longer period and is more passive. However, it tends to smooth out price noises which are often reflected in short term moving averages.
There are a bunch of parameters that you can set on this indicator based on your needs.
Moving Averages Algorithm
You can choose between three types provided of Algorithms
Simple Moving Average
Exponential Moving Average
Weighted Moving Average
I will update this study with more educational materials in the near future so be informed by following the study and let me know what you think about it.
Please hit the like button if this study is useful for you.

Stochastic Pop and Drop Signals [Bitduke]It's a long/short signals for modified Stochastic Pop and Drop strategy.
About
It's the strategy of 2 indicators: Stochastic Oscillator to define the bias and Average Directional Index to confirm it.
Signals
Strategy flips long / short depending of indicator signals. There can be multiple signals of the same type, for example, 2 longs in a row, only the first of them matters, others you should handle in your websocket script or manually.
Testing
Tested on different sources for data, oscillator periods and different levels in relation to the crypto market.
So, it shows good results with two tight thresholds at 55 and 45 level.
The bar chart below the defining the bullish and bearish periods (green and red) and gives a signal to enter the trade (purple bars).
Backtesting
Backtested on XBTUSD , BTCPERP ( FTX ) pairs. You may notice it shows good results on 3h timeframe.
Relatively low drawdown
~ 10% (from 2019 to date) FTX
~ 22% (4 years from 2016) Bitmex
Bitmex 3h (2017 - 2020) :
i.imgur.com
FTX 3h (2019 - 2020):
i.imgur.com
Possible Improvements
- Regarding trading algorithm it would be good to check with strategy with ADX somehow. Maybe for the better entries
- As for Risk Management system, it can be improved by adding trailing stop to the strategy.
Link: school.stockcharts.com

Theft Indicator - BOOM Buy/Sell SignalsWhat is our indicator?
Theft Indicator - BOOM is a script that shows entry levels on a condition that is met with our special algo. The algo consists of crossovers, which are not visible but we take pride in the effort we have put to make this indicator have a high success rate as long as you have a scalping target price set.
Does it Repaint?
Our indicator does NOT re-paint. Although while setting an alert it may pop up the repaint alert, please take into consideration that once a signal is fired on a "CLOSED BAR", our signal will never disappear, they do not repaint.
What Markets is it usable with?
You can use it in any market, Forex, Stocks, Crypto, Indices. All time frames work, not all trades will be profitable (this is how trading is, you can take a loss sometimes). But the Majority is profitable if you use a stop loss and target price.
How to use:
Simple plug and play it to your chart, in addition to a few other indicators we will recommend to you (we still have not published them yet), and this will confirm your trades. You can also connect TV alerts with a bot and let it run. Please be aware that SLIPPAGE time is important, If you run a bot on this indicator you HAVE to know that the buy/sell price will be on the bar AFTER the Candle close (For example: the BUY/SELL alert is on a candle, the buy/sell your bot or you will execute WILL be in the following candle depending on your trading system. We advise you to not leave the bot to trade on its own, you have to monitor and have a specific syntax that we will help you with creating according to your trading style.
P.S: This is not financial advice, we are just sharing our indicator that we know has good results, and it will take time for people in -ve profiles to recover losses and for the profiting to be more profitable. We use a specific trading method that only works with it
You can contact me for more information about the indicator, Goodluck :)

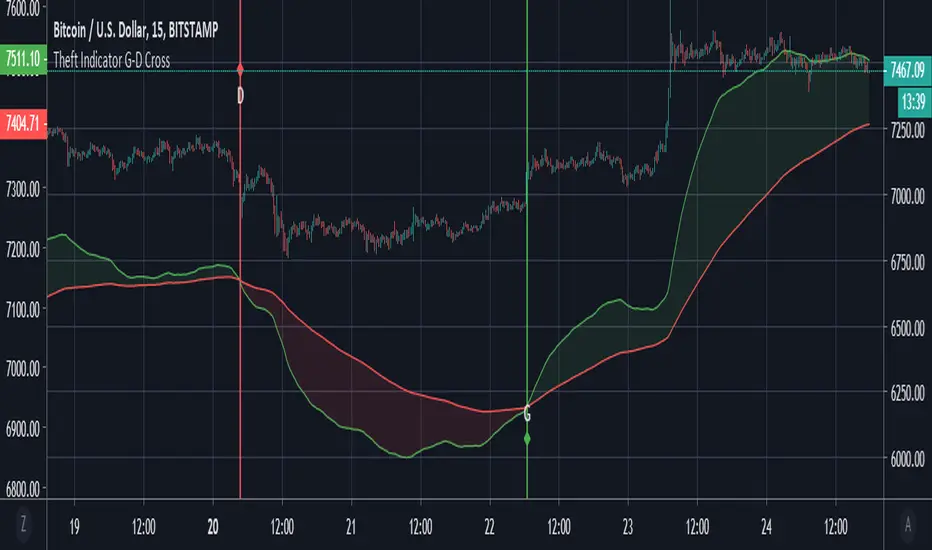
Theft Indicator - Golden/Death CrossThe golden cross and death cross used here is favorable for low time frames. We believe it is a good scalping option to use it. It works well with forex, stocks and crypto.
How is it used? - Just apply it to the chart, and take trades on the labels signaled. G = Golden cross || D = Death Cross.
The indicator is open for public use, but the source code is protected.
Enjoy it.
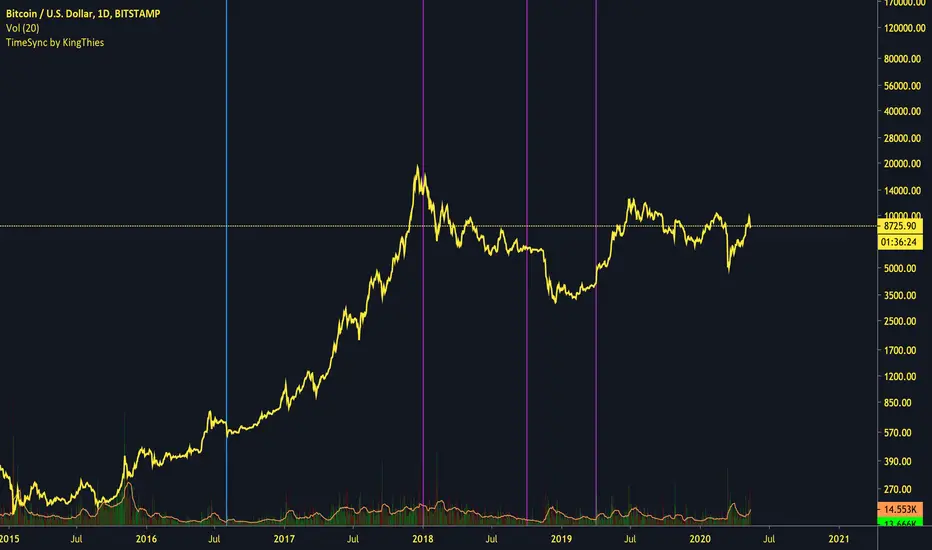
TimeSync by KingThies TimeSync by Kingthies
Written in Pine v4
Applies one function that was published in the Tradingview Pinescript Manual
The Motivation behind this script - Time is 50% of your chart. Many ignore it entirely. This should help give an idea on how to read it and incorporate it in their analysis.
TimeSync by KingThies takes a simple concept and turns it into a visual tracking system of when timeframes of significant impact, all close at the same time.
By utilizing several high time-frames, we see overlaps in periods and more significant events occurring when multiple periods close at once.
The TFs included are 3D,1W,2W and 1M. When users use the timeframes above intraday, the resolution for these HTF's is shown. When using the LTFs, anything lower than 1D/is intraday, the user sees a similar concept but comprised of the 4H, 6H,8H and 10H charts.
Users can adjust the settings to show the HTFs in sync AND also factor in if the event was on a business quarter or new year, which adds more significance to the occurrence.
By seeing when these periods end in sync, we can assume more volatility is present in a given market, presenting various opportunities for traders to take advantage of a given situation.
Apologies in advance for any questions that come up - I will do my best to reply or respond here on Tradingview.com.
Additional Resources for this topic can be found in my account signature, located at the bottom of this post.
Open Close Profit - [Alerts]This script comes with the following indicators and features:
Moving Average trend filter (Hull, ZLEMA, McGinley)
Pin Bar Filter
MACD indicator
Pump and Dump filter
Entry, Take Profit, and Stop Loss Alerts
And a few more indicators in the back-end to increase accuracy, optimize entries and filter out sideways PA
This script works really well as a scalper on lower Time Frames as well as on higher Time Frames. Besides that you can also use it on pretty much any coin or asset.
This script is not repainting. We advise to use alerts on “Once Per Bar Close”.
If you’d like to automate this script you can do that by using AutoView, ProfitView, ProfitTrailer, CryptoHopper etc.
Leave a message if you’d like to try it out.

Squeeze Momentum Strategy Signals [Bitduke]Description :
Signals based on transformed Momentum Indicator (leading indicator measuring a security's rate-of-change) with risk management system and ability and custom backtesting.
Usage:
Strategy flips long / short depending of indicator signals. There can be multiple signals of the same type, for example, 2 longs in a row, only the first of them must be taken into account.
Features :
Possible to change source: ohlc4, hl2 , hlc3, close
Enter your stop loss and take profit in %, NOT ticks
Working and robust even without take profit / stop loss
Yearly drawdown lower than 20%
Backtesting:
Backtested on BTCPERP ( FTX ).
It shows much better results on 1h timeframe (about 200% yearly, 55% in 2020) and relatively low drawdown to date.
Strategy doesn't repaint.

Bitcoin Stock To Flow Rainbow IndicatorHello everyone,
I have finished to create the Bitcoin stock to flow indicator, rainbow version.
It's a Bitcoin price prediction model.
What is Stock To Flow ?
Stock is the size of the existing stockpiles or reserves and flow is the yearly production.
The formula is : Stock divided by flow ( Stock_to_flow = STOCK / FLOW )
The supply of bitcoins is fixed in the source code.
What we know :
Blocks are created every 10 minutes ( average )
In 2009, 50 Bitcoins was created every 10 minutes , so 300 Bitcoins per hour, 7200 per day, 2628000 per year
The Halving happened each 210000 blocks , the average time between halving is around 1300-1400 days.
The mathematical formula that I used for the rainbow line is : exp(-1,84) * (Stock_to_flow ^ 3,36)
And the mathematical formula that I used for the " top price line " is : 1.2 * (Stock_to_flow ^ 3)
The rainbow line IS the prediction model .
We can observe that :
The price follow the rainbow line
After each halving, the price grow and touch few month after the rainbow line
When the price is between the rainbow line and the " top price line ", habitually, it's followed by a drop of the price below the rainbow line.
Special thanks to PlanB.

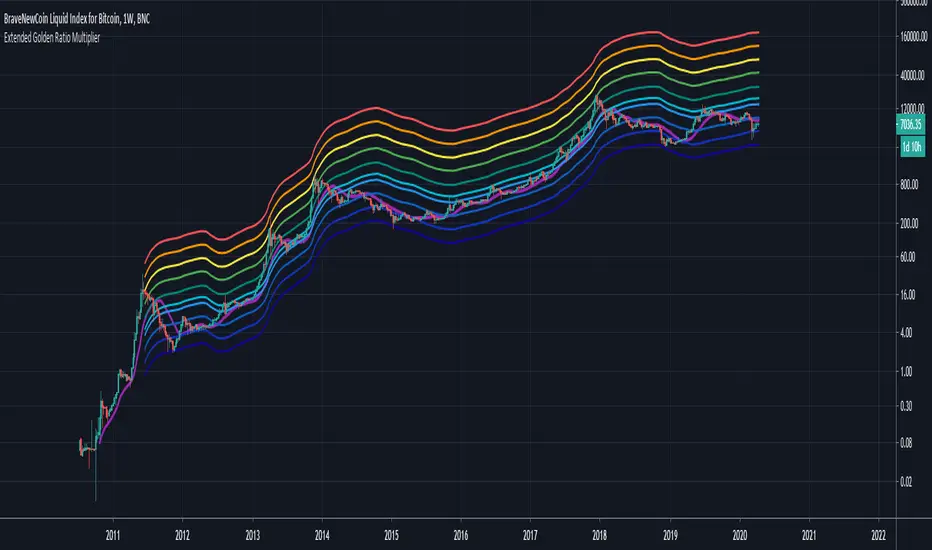
Extended Golden Ratio Fibonacci Multiplier + Pi Cycle TopHere I present the Golden Ratio Multiplier and Pi Cycle Top Indicator originally conceptualized by Philip Swift, and extend it. Due to popular demand for a nicer looking color scheme and added MAs & functionalities, I decided to publish this indicator, of course with free access for everyone as the discovery is attributed to Philip. The indicator works best for BLX (BraveNewCoin Liquid Index for Bitcoin) on daily (D) or weekly (W) timeframe. Other timeframes are not supported (and also generally not needed as this is a rather high timeframe indicator).
Added functionality:
- Additional Fibonacci MAs for Bottom: 0.618*MA(50W) and 0.382*MA(50W), which seem to be distinct high timeframe support MAs
- Pi Cycle Top and all Fibonacci MAs can be plotted or hidden individually
- Correct MA values for daily (D) and weekly (W) timeframes are automatically assigned, so you do not need to change anything when you switch between those timeframes.
It is generally said that Bitcoin's peaks always only reach a lower yearly Fibonacci MA. The next one to eye would be the 3*MA(50W) = 3*MA(350D) here plotted in dark green. Historically when the MA(16W) = MA(111D) (here plotted in magenta) line crossed the 2*MA(50W) = 2*(350D) line (plotted in cyan) from below a cycle peak is reached. This indicator might therefore be a good high timeframe indicator for Bitcoin trading. Of course this is no financial advice.
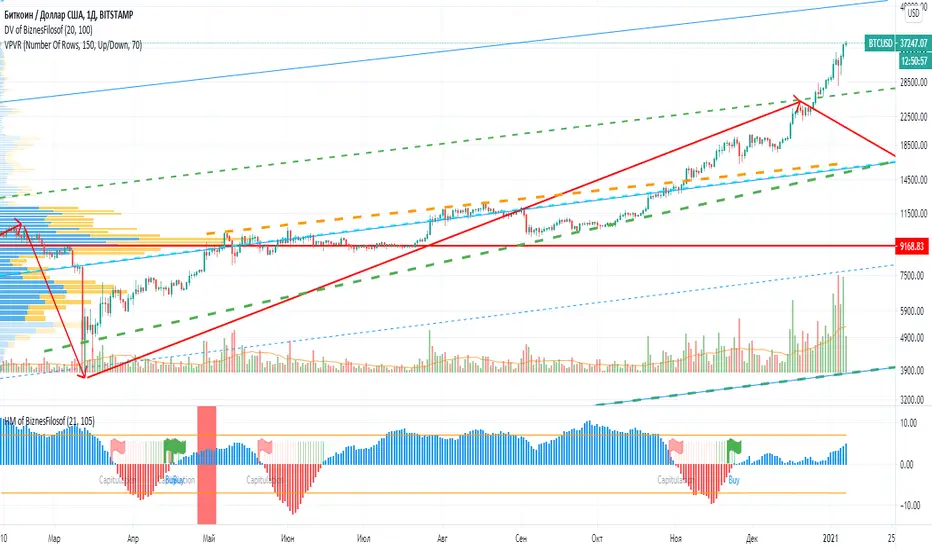
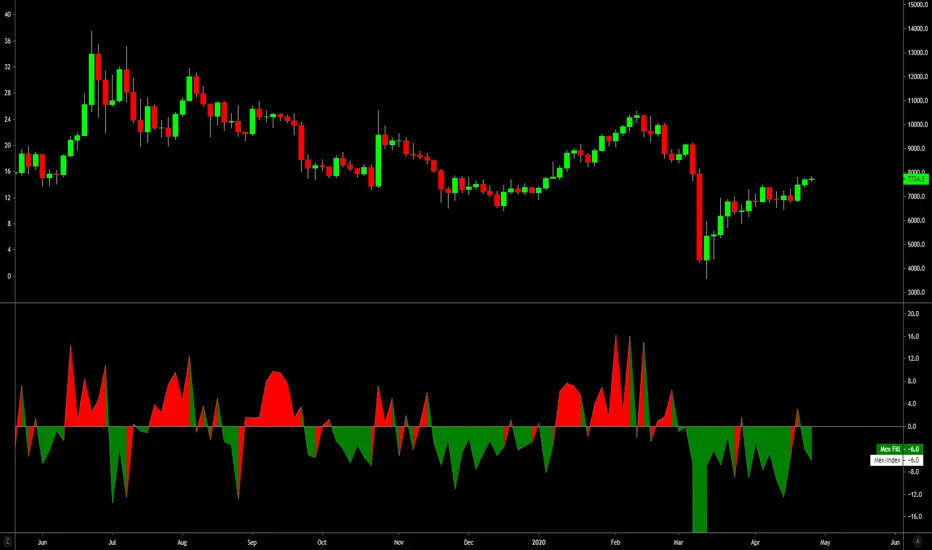
Hashrate Mining of BiznesFilosofIn addition to technical analysis, you also need to pay attention to fundamental analysis. Bitcoin has one of these indicators, it is the network hashrate. And it’s important to know when mining becomes disadvantageous. Those. when network participants turn off the equipment. And there are critical points that depend on the price and number of miners in the network.
When the blue bars of the indicator grow, then you can stand in long. When stools are reduced, then it is time to close positions or hedge risks in the derivatives market.
The vertical line indicates halving.
A red flag indicates a dangerous moment, and a green flag indicates the time of purchase.
The oscillator is based on fundamental indicators and the intersection of moving averages.
===
Кроме теханализа нужно ещё обращать внимание на фундаментальный анализ. У биткоина один из таких показателей, это хэшрейт сети. И важно зать, когда майнинг становится невыгоден. Т.е. когда участники сети отключают оборудование. И есть критические точки, зависящие от цены и количества майнеров в сети.
Когда синие столбики индикатора растут, тогда можно стоять в лонг. Когда столюики уменьшаются, тогда пора закрывать позиции или хеджировать риски на рынке деривативов.
Вертикальной линией обозначен халвинг.
Красный флаг показывает опасный момент, а зелёный флаг указывает на время покупок.
Осцилятор основан на фундаментальных показателях и пересечении скользящих средних.