Bitcoin (Mata Wang Kripto)

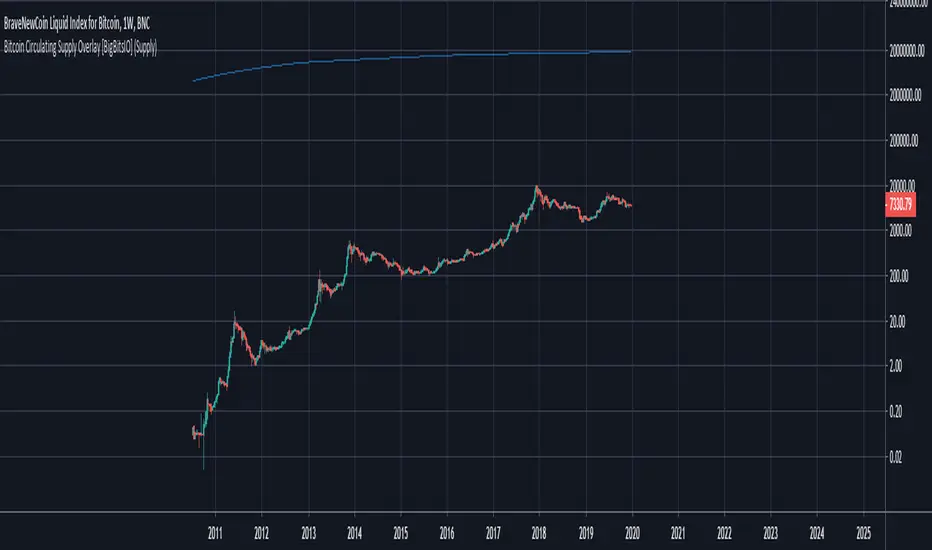
Bitcoin Circulating Supply Overlay [BigBitsIO]This script shows the estimated circulating supply of Bitcoin on any given day.
Features:
- Estimated Bitcoin circulating supply calculated daily
- Uses the Bitcoin reward schedule, past halving dates, and the next upcoming halving estimated date to calculate the current estimated supply.
- Optionally includes an option to use "Log Reduction" on the chart
*** DISCLAIMER: For educational and entertainment purposes only. Nothing in this content should be interpreted as financial advice or a recommendation to buy or sell any sort of security or investment including all types of crypto. DYOR, TYOB. ***
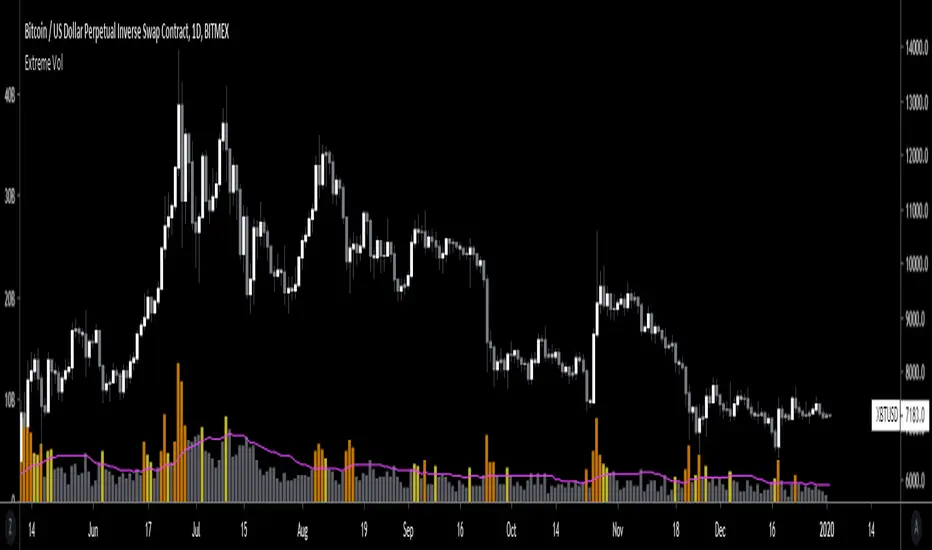
Extreme VolumeThis indicator colors volume bars that are significantly higher volume than the vol moving average ( SMA ). Utilizes two multiplier that can be adjusted by user. Defaults are that the indicator colors volume bars yellow if 20% higher than average, and orange if over 50% higher than average.
Reason why i created this indicator is i typically don't care about volume unless it is significantly higher than average. I find extreme volume useful for confirmation of a breakout, etc. This is why the rest of the volume bars are gray, they are still available for reference, but I dont pay much attention until volume is higher than average.
Also, when you load this indicator it will be in its own pane below the chart. To try and figure out how to add it to same pane as the chart was a huge pain in the ass. Once you figure it out it is pretty easy. I'll try to explain below...
Next to the indicator name you have the following options ... Hide, Settings, Show Source Code{}, Delete(X), and More (3 dots)
1) Click on "More" (3 dots)
2) Click on "Move To" then chose "Existing Pane Above"
3) Volume will likely be too large. Volume scale should be on left side, use your mouse to adjust volume smaller
4) Volume will likely be in the middle of your chart, click on it and drag it down.
Deribit Contango Calculator v3Same as XBT Contango Calc V3, however built specifically for Deribit Futures . See link to XBT Contango Calc V3 for full description.
Above is capture of how this indicator performed on December Futures Contract BTC27Z19, since I assume I will loose this as the main chart when I update to June contract
Current (Dec. 2019) futures contracts are as follows:
Blue = BTC26M20
Orange = BTC27H20

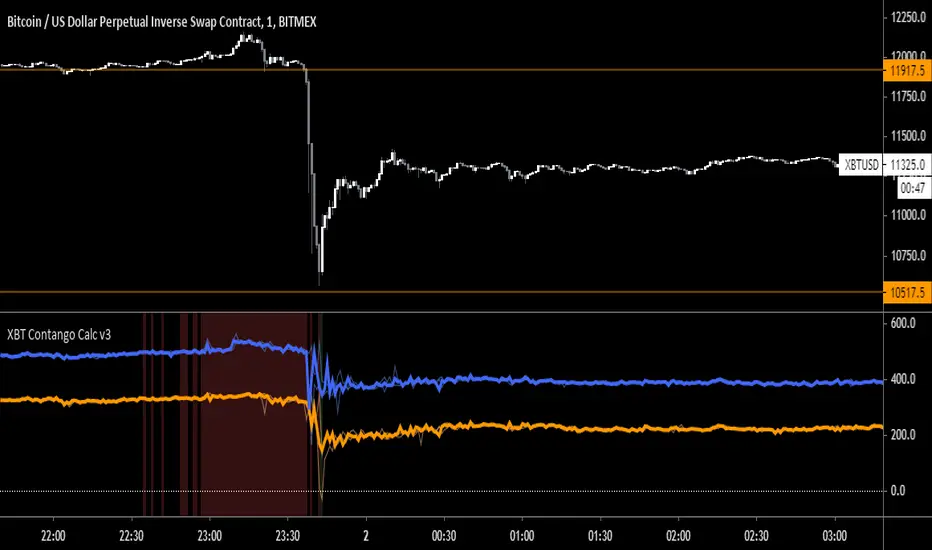
XBT Contango Calculator v3Since creating the first version of the XBT Contango Calculator, I found that the first version is good a calculating contango and backwardation in real time, however does not do a good job of capturing historical data of brief moves. Since backwardation moves are often brief, and since the first version Contango Calc was based on candlestick closes, it did not do a good job of recording the move after it occurred.
It took me a couple versions to try and fix this an eventually settled on version 3 which I have been using on my own for the last few months. You can see in the comparison chart above it does a much better job of capturing backwardation moves and extreme contango. Below is a comparison of how it performed vs. Version 1 during December futures XBTZ19
In addition I have added high/low lines that can be used to understand the amount that futures premium/discount has moved in a specific time frame. For example, the big drop Bitcoin had on September 24th, XBTZ19 went from +$273 contango to -$247 backwardation = $520 move! This move was in addition to the spot price move which was almost -$1,700 from high to low and -$1,100 from open to close. See below:
The high/low lines can also be removed from the chart by unchecking a box in the input tab.
The last update is the ability to lock the spot price to be XBT (index) no matter what chart you pull up. This can be useful if evaluation XBT futures correlation to other bitcoin derivatives such as GBTC or CME futures. You can also disable this feature in the input tab, which will then just calculate based on the current chart you are viewing.
Current Contracts (December 2019)
Blue = XBTM20
Orange = XBTH20
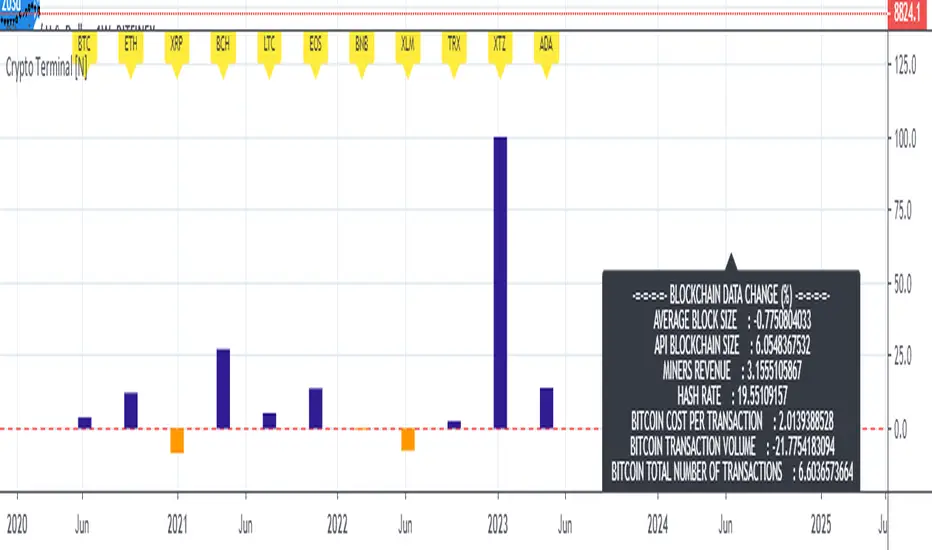
Live Mini Terminal 7 : Major Cryptocurrencies Change DataThis script displays relative data changes occurring in the adjustable period and/or adaptive automatic period in U.S Dollar based Major Cryptocurrencies.
This script was inspired by the data terminals used by commercial traders.
Period selection can be set in the menu.
This script uses the adaptive period algorithm used by Autonomous LSTM and Relativity scripts.
Or you can set the period manually from the menu.
For more information about adaptive period:
This script works only for 1 day (1D) and 1 week (1W) time frames.
Since usage of Blockchain Data, the most efficient time frame is 1 week (1W) .
Features
Value changes on a percentage basis (%)
The Info Panel contains percentage-based blockchain data changes.
CRYPTOCURRENCIES
BTC : Bitcoin
ETH : Ethereum
XRP : Ripple
BCH : Bitcoin Cash
LTC : Litecoin
EOS : EOS
BNB : Binance Coin
XLM : Stellar
TRX : Tron
XTZ : Tezos
ADA : Cardano
INFO PANEL
Average Blockchain Size change data
API Blockchain Size change data
Miners Revenue change data
Hash Rate change data
Bitcoin Cost Per Transaction change data
Bitcoin Transaction Volume change data
Bitcoin Total Number of Transactions change data
USAGE
The script can be used as an indicator by putting it under the chart as shown above.
It is necessary to enlarge to see clearly.
Since it is not often looked at,
such use is the best method for healthy interpretation.
Best regards.
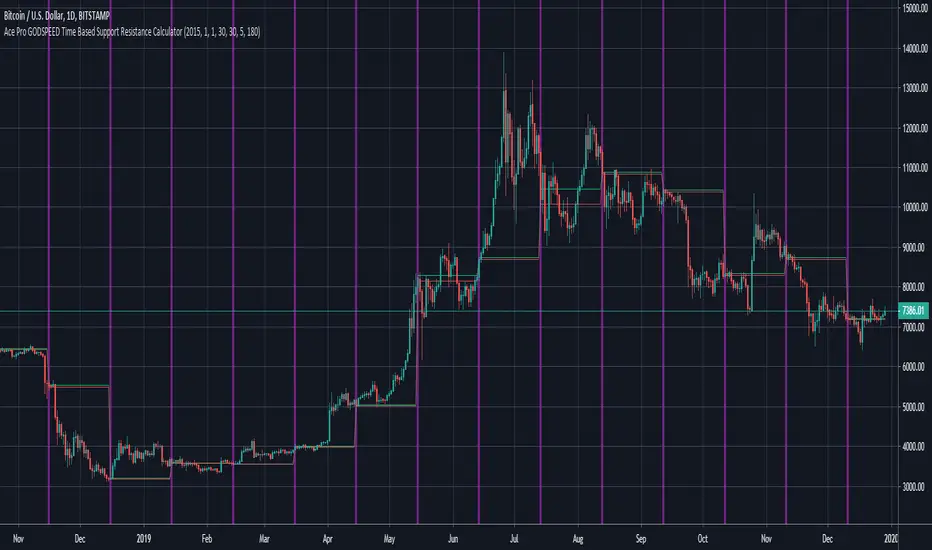
Ace Pro GODSPEED Time Based Support Resistance Calculator [FREE]The Ace Pro GODSPEED Time Based Support Resistance Calculator has two functions.
Please note that this indicator is COMPLETELY CUSTOMIZABLE - TRADERS CAN INPUT THEIR OWN VALUES TO CALCULATE S/R.
Function 1: It marks intervals of time on the daily time-frame with vertical lines as specified by the user
Function 2: It can mark support and resistances with horizontal lines as defined by a set of candles for a specified time interval
Function 1 Explanation:
To mark the intervals on the daily time-frame, traders should utilize the following options:
Start Year
Start Month
Start Date
Days Frequency
Traders can select the start date and duration of each interval. The indicator will automatically mark these intervals on the daily chart with a vertical line.
----------------------------------------------------------------------------------------------------------
Function 2 Explanation:
To mark support and resistances, traders should utilize the following options
Low Time Frame
Low Time Frame Value
High Time Frame Value
Low Time Frame = Specify the time frame on which you would like to VIEW the S/R lines
Low Time Frame Value = Select the value of the candle to take into account. For example, if you want the indicator to calculate using 5-minute candles, specify “5” as the input value. However if you want the indicator to calculate using 10-minute candles, specify “10” as the input value.
High Time Frame Value = Specify the total duration you would like S/R values calculated for before the indicator resets its calculation. For example, if you want each calculation to reset after 180 minutes, use the input value of “180”. However, if you want each calculation to reset after 90 minutes, use the input value of “90”.
IMPORTANT NOTICE: SOME EXCHANGES (CRYPTOCURRENCY) ARE MISSING DATA FOR CERTAIN DATES/PERIODS. THIS MAY AFFECT YOUR CALCULATION. THIS IS ESPECIALLY TRUE ON HIGHER TIME-FRAMES (SUCH AS THE DAILY). PLEASE DO KEEP THIS IN MIND.
Bitcoin Energy Value OscillatorBitcoin Energy Value as an oscillator against price.
Calculated as: (Bitcoin Price / Bitcoin Energy Value - 1) * 100


2-Year MA MultiplierIndicator built by lookintobitcoin specifically for identifying ideal Bitcoin buy and sell regions.
lookintobitcoin describes this indicator as:
"The 2-Year MA Multiplier is intended to be used as a long term investment tool.
It highlights periods where buying or selling Bitcoin during those times would have produced outsized returns.
To do this, it uses a moving average (MA) line, the 2yr MA, and also a multiplication of that moving average line, 2yr MA x5.
Note: the x5 multiplication is of the price values of the 2yr moving average, not of its time period.
Buying Bitcoin when price drops below the 2yr MA (green line) has historically generated outsized returns. Selling Bitcoin when price goes above the 2yr MA x 5 (red line) has been historically effective for taking profit."

Blockchain Fundamentals - Golden Ratio Multiplier GRMBlockchain Fundamentals - Golden Ratio Multiplier GRM
Intro
This strategy was put forth by Phillip Swift (a.k.a PositiveCrypto) as guidelines for bitcoins market cycles.
Description
The new insight comes when we multiply the 350 day moving average (which we will refer to as the 350DMA) by specific numbers. Those mathematically important numbers are:
-The Golden Ratio = 1.61803398875
-Fibonacci Sequence = 1, 1, 2, 3, 5, 8, 13, 21…
Using those three moving average lines (350DMA x 1.6, x2, x3) has allowed us to pick out almost every single intra-cycle price high in Bitcoin’s history.
The next numbers in the Fibonacci sequence are 5, 8, 13, and 21.
Remarkably, when we use these multiples of the 350 day moving average, they pick out each of Bitcoin’s market cycle tops going all the way back to the first price bubble in 2011.
Additions
I added the ability to select from a few types of moving averages and to change the base MA length. This will allow you to experiment and find your own potential correlations.
I also added the bottom most (yellow) line you can see which is the base MA minus the 0.618. This has been a great market bottom level for calling capitulation.
I also added in the ability to plot additional fibonacci and gann numbers.
I Also added some trade state logic when to long/short though its not perfect by any means but a work in progress.
👍 We hope you enjoyed this indicator and find it useful! We post free crypto analysis, strategies and indicators regularly. This is our 75th script on Tradingview!

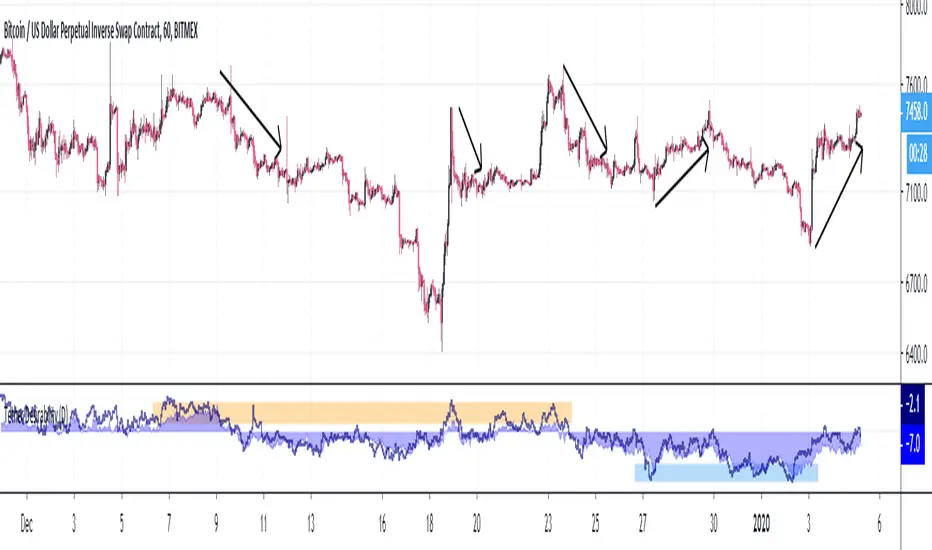
JM Momentum Moving Average CrossoverReuploaded.
Some people complained about noisy signals from previous gainzy inspired intraday indicator so have designed this one to be more robust. Is pretty good at capturing early trend changes in momentum. Have not backtested yet. Recommended for lower time frames, 1 hour and under, I like 45m.
How it works?
____________
Using custom fast and slow momentum factors it is simply a crossover of the two.
How to use?
____________
Wait for closing bar, if BUY signal is printed, momentum is trending upwards so longs are favoured. If SELL signal is printed, shorts are favored.

Odin's Volume and Volatility CompositeA simple indicator showing the ratio between Historical Volume and Historical Volatility.
It's meant to be applied to the BitMEX XBTUSD chart.
You can use this to develop profitable breakout strategies.


Bitcoin CoP - Overlay V1A good estimate of what it would cost in electricity to mine 1 whole bitcoin with your preferred mining equipment. The cost of production overlay allows to change a few ASIC related variables like hash rate, device wattage, and electrical cost by KW/h. Defaults are set for the Antminer S17 Pro, which hashes at 53 Th/s and consumes 2.1 KW at 7.5 cents a KW/h. The overlay also considers halvings and plots CoP in those events.
This overlay can include other business related costs via "Other Costs" as a percentage of electrical cost USD/KW.h. Keep that value to 0 if you don't want to include it in your overlay.
The bubbles in the chart example is when mining devices came online. Pretty interesting to see difficulty adjust as new hashrate is added to the network.

Bitcoin Production Cost OscillatorFor Trav,
Oscillator version of "Bitcoin Production Cost".
Based on raw data from CBECI.
Follow me to read more about the calculation logic.

Bitcoin Production CostBitcoin's Production Cost
Based on raw data from CBECI.
Follow me to read more about the calculation logic.

Bitcoin ASIC Cost [Tainoko]This indicator shows the break-even price of ASIC BTC mining.
The data can be customized, but the following four models are set as standard.
Antminer S9i
Antminer S15
Antminer S17
Antminer S17+

BTC Mining Cost - IndicatorBTC Mining Cost Indicator
- Adjust the Emission Rate after each halving, currently it's 12.5
- Current settings are for the Antminer S17 with an average cost of 12 cents per kWh
As you can see, a bounce usually follows when the price hits the cost of mining 1 BTC .
I would love to hear your feedback, and if you like it please gimme a thumbs up ❤️
Happy Trading!

BEST Mayer MultipleHello traders
I'm not a HODLer by any means. I know when to sell (or I think I know....) when an asset starts going against me too much.
Even if it's a "long-term" investment.
My mentor used to telling me this: "If a short-term trade becomes a long-term investment, then you're in for a hell of a ride".
I have no clue if Bitcoin/BTC will go back up or not - I don't even care because I'm an intraday trader.
What if BTC was actually a way to accumulate more fiat? Satoshi fooled us
I coded this Mayer Multiple according to the specifications below. By the way, I'm a big fan of Willy Woo. I've been monitoring all his work since I learned about crypto (10 minutes ago.... it's a joke come on)
charts.woobull.com
Scaling
To respect the Mayer's multiple model, I recommend to select the Logarithmic scaling as shown below
imgur.com
What Mayer's model says
Using the reference below, the model says we're in the oversold zone. But, we can be in that zone for months/years...
When a model says an asset could bounce in a 1000-7000 USD range... well... I don't know how I would be able to perform optimally with that insight. This is very subjective and not a recommendation.
Mayer's Multiple model reference
All the BEST
Dave

[astropark] Renko OBV divergencesDear Followers,
today a new great Scalper Tool , based on Ob Balance Volume (OBV) oscillator, which works from 1 minute timeframe Renko chart , which is the best and more secure timeframe to use on a Renko chart. But of course it works great on all timeframes (included the 1D timeframe), both on FOREX and on Cryptocurrencies!
This tool has some cool features:
it works on all timeframes , starting from 1 minute: so you can enjoy high-frequency trading by using a 24/7 running bot and a proper money and risk management strategy
it shows you both bullish and bearish divergences with a triangle up or down respectively
when it finds a strong bullish/bearish divergence , a flag will be displayed instead of a triangle
This script will let you set all notifications you may need in order to be alerted on each triggered divergence.
You may like to use it together with my Renko Scalper V2
and my Renko RSI Divergences indicator
On Bitmex/ByBit/Binance Bitcoin/USD chart best settings is Traditional Renko chart with 10$ box size, while 0.5$ box size is suggested on Ethereum/USD pair.
This is a premium indicator , so send me a private message in order to get access to this script.

Blockchain Fundamentals - Satoshies Per Dollar by Cryptorhythms🔗Blockchain Fundamentals - Satoshis Per Dollar by Cryptorhythms
Intro
SPD is a new metric I propose which can be used to determine general sentiment and help narrow down periods to DCA .
Description
In the most basic sense this indicator is simply showing you how many satoshies are equal to one US dollar . This can be a useful metric to keep stored in the back of your mind. It can also give you a new satoshi based perspective on bitcoin pricing.
I simply added an MA selection option to give a basic sentiment reading. You could also use the red areas as a modified DCA (i.e. only do dollar cost averaging when red zone is in effect.
The indicator is not really meant for buy/sell signaling but more as a reference
👍 We hope you enjoyed this indicator and find it useful! We post free crypto analysis, strategies and indicators regularly. This is our 71st script on Tradingview!
💬Check my Signature for other information
