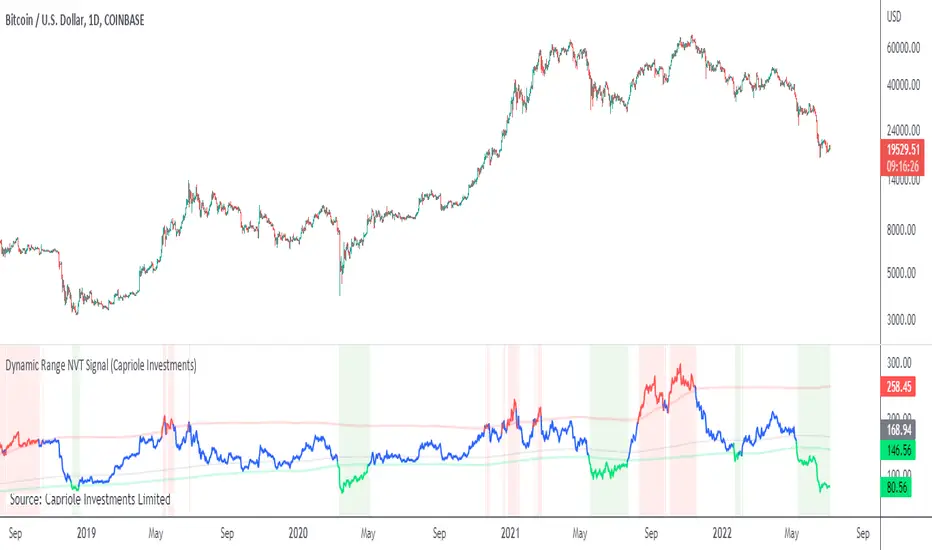
Dynamic Range NVT SignalABOUT DYNAMIC RANGE NVT SIGNAL
NVT Signal (Credit: Willy Woo and Dmitry Kalichkin) is akin to a "PE" ratio for Bitcoin , and can be used to identify when Bitcoin is overbought or oversold based on the relative value of transactions sent across the network.
This indicator includes a 2 year moving average and standard deviation to identify outlier values, instead of declaring a static high-low range for relative valuation.
THEORY
A dynamic "high-low" range was chosen for the following reasons:
- Bitcoin is only 10 years old, it is likely that relatively "high" and relatively "low" NVT values will change with time, as have PE ratios over the last century.
- Some transactions are now made off-chain (eg. Liquid Network's private side-chain which is used by many major exchanges). If this trend continues, we can expect "normal" NVT ranges to increase with time (as the relative portion of public on-chain transaction values decreases).
CALCULATION
- NVT = Circulating Market Cap / 90 average On-chain Transaction Value*
- Overbought (default): NVT > 2-year mean + 2*standard deviations. I.e. NVT Signal is in the top 2.5% of values for the prior 2 years.
- Oversold (default) NVT < 2-year mean - 0.5 * standard deviations.**
*Data source: Blockchain.info, estimated transaction value does not include returned to sender as change.
**Oversold under 2-year mean was chosen due to the skewness of NVT Signal, it is not normally distributed. For example: NVT Signal has never been less than the 2-year mean - 2* standard deviations. This may change in the future.
NOTES ON USAGE
- Use with care. Bitcoin can remain "overbought" or "oversold" for extended periods (eg. 2015-2016).
- As Bitcoin ages, the validity of NVT Signal will need to be monitored. Particularly with respect to potentially increasing use of side-chains, private transactions and potentially the lightning network.
- It is likely that a 2-year “look back period” for calculating mean and standard deviation will not be sufficient in the decades to come. As Bitcoin matures and stabilizes (some time in the future), a longer "look back period" should probably be used. To allow for this, the defaults for this indicator can be easily adjusted.
Bitcoin (Mata Wang Kripto)
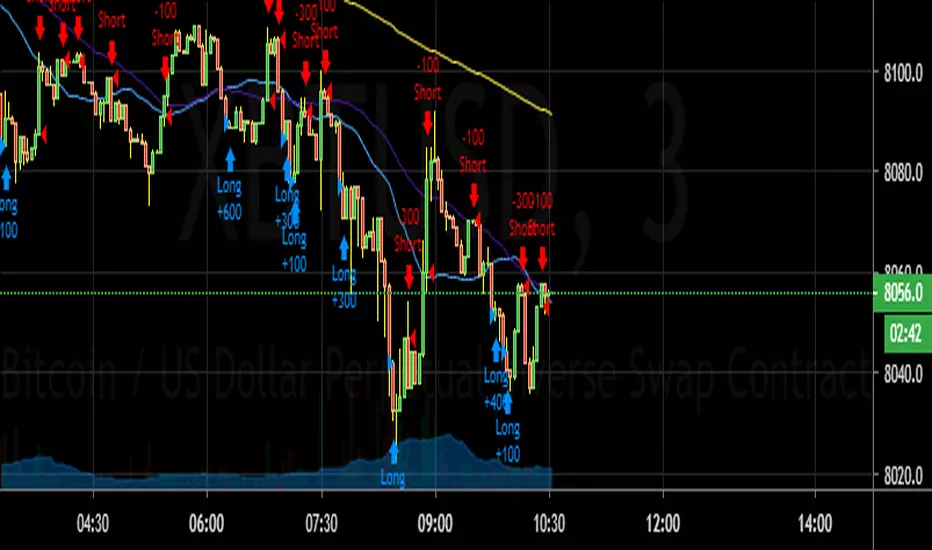
Sigwo Tech AI - 3m TF BitMex BotI’ve made a ROI of 600%+ (and counting) in 91 days using this bot and the ‘close when large’ method described below. First, some stuff. There are zero guarantees of the bot working well for you like it does me. Some is ‘guts’ and some is ‘damn this bot rocks’. I’m always open to help with advice. I will not listen to whining or otherwise unsavory words. This bot doesn’t substitute learning how to trade. Get a load of this Mango Sauce, it rocks!
You will need a few things:
TradingView account (free account will not work, but be Pro, recommend Pro+)
You will need an AutoView subscription (coupon: 5CPLM-4PY3Q-EEWJN)
You'll need a Bitmex or a Deribit account (bitmex - www.bitmex.com)
VPN (always a good idea when connecting to exchanges)
You need to email info@gojupiter.tech to gain access to the indicator. In the email, we need your TradingView username
Setup instructions:
Add the indicator to your 3m TF chart (not tuned for other timeframes)
Right click on an area of the 'Study STAI' indicator, click "Add alert on 'Study STAI'"
In the box that pops up, select the drop down "Short" and select the box 'Once per bar close'
In the 'Message' box, copy paste the following (no quotes):
"Short!
a=bitmexlive e=bitmex s=xbtusd b=short q=1000 l=10 t=limit"
l=leverage q=quantity of contracts in $ amount
Do the same procedure above to make 'Long' alert, but insert the below in the new 'Message' box.
"Long!
a=bitmexlive e=bitmex s=xbtusd b=long q=1000 l=10 t=limit"
Save the alert. You should now see the alerts in the left side of your browser and a green dot next to them. You are live and ready to rock!
Notes:
You must have a browser open for the orders to fire! You will still receive alerts, but the orders will NOT fire unless a browser is open!
Nothing is infallible. Bots should be checked 3-4 times a day to ensure orders are executing properly and to check if the orders are 'lopsided'. Alerts for price support/resistance should be set by you and checked when the alert comes in. This usually means you have a chance to close a nice large position in profit manually….yes there are some manual interactions you can take with the bot when necessary but it happens maybe 3-4 times a WEEK. This could be more, depending on the price action of the market. Example: Overnight, XBTUSD market was very sideways in a generally upward move. When I woke up, the bot had made a little money (0.0025 or so) but also accumulated a $34,000 short. The short was well positioned (9616) and the market was hovering around 9575. I closed $10,000 manually at 9575 and left the rest until we broke downward to 9540. This brought the bot back into a ‘neutral’ position to alleviate lopsidedness,or being to large in one direction or another. The point of this bot is NOT to make LARGE amounts on every trade….The point of this bot is to be profitable in little chunks by being quick and providing liquidity (0.025% rebate for limit order). Do NOT try to ‘pile on orders’ in the direction your bot is traveling! You WILL eventually lose big. I’ve done it twice, and then I stopped doing that. Over $30,000 lost on those 2 moves because I got greedy and tried to override the bot. (I’ve recovered those losses by letting the bot do its thing)
CLOSE manually do NOT OPEN manually!
Let the bot run 24x7 and leave the orders that are not hit alone...price action will eventually come back and pick it up.
*I reserve the right to remove your access if you are unsavory or I find you conducting unauthorized sharing. You will be warned at LEAST once before any punitive measures are taken.*
Cyatophilum H.A. Swing [ALERT SETUP]Hi guys, to celebrate the beginning of a new altcoins cycle, I created a Swing trade Indicator. (It's a joke, there will not be any altcoins cycle)
Cyatophilum Heikin Ashi Swing
This indicator will allow us to create one strategy for each pair and never miss those big swings ever again!
HOW BEAT BUY & HOLD WORKS
This kind of strategy is a safe long term investment , usually played in high timeframes such as 4H, 1D etc.
It is perfect for beginners in trading as the process is very simple: buy and sell when you receive the alert. The high timeframes allows to trade manually by receiving alerts on your phone or email, but you also can automate it if you prefer.
The primary goal of these strategies is to increase your capital faster than someone simply holding the asset .
The trades are made with no leverage and 100% equity . It is for those who want to grow their portfolio fast without risking to lose everything. You can use several strategies at once, in this case split your equity accordingly.
HOW DOES IT WORK?
The Heikin Ashi candles are very usefull. This strategy is built upon H.A. candles but is used on normal candles, because H.A. candles price are an average of real candles and we want to know the real price. I did the trick by recalculating the H.A. open, high, low and close with the original formula based on the real candles's ohlc. This allows me to use the strategy tester and backtest with real results.
HOW TO USE
Creating a signal is as simple as adding the indicator called to your chart and click "Set alert". Select "Once per bar close" for your alert options.
There are 3 alerts:
- BUY
- SELL
- BUY OR SELL (for free TV users)
Sample Backtest results
Bitcoin/Dollar
Ethereum/Bitcoin
Basic Attention Token/Bitcoin
> > Start using the indicator now < <
Note: This version is the ALERT SETUP. You can find the Backtest version on my profile scripts.

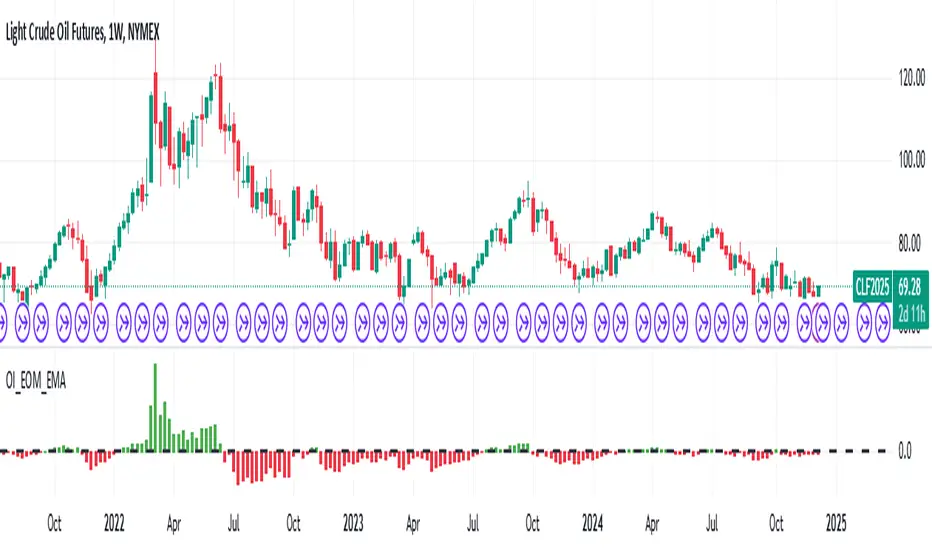
Open Interest Exponential Ease of MovementModified Ease of Movement :
* Open Interests used on Futures instead of Volume (Includes Bitcoin)
* Exponential Moving Average used instead of Simple Moving Average
* Division Number cancelled. (Division Number gives wrong signals inside strong trends.)
NOTE : This code is open source under the MIT License. If you have any improvements or corrections to suggest, please send me a pull request via the github repository github.com
Stay tuned. Best regards !
[BERA] SUper BOSSHey beras and bulas, this is another gift for you! work in sync with KNIFE CUT script
Please message me if you like my indicators. Thanks you.
This indicator work in sync with KNIFE CUT, check it.
SUper BOSS
Is a special indicator with 2 metrics you can use for be a better trade and stop losing money entering useless positions.
using also KNIFE CUT you will get up to 4 parameters you can compare, for enter only good trades.
This indicator can:
Supports and resistances area as point of reference.
OverBought, Oversold candles
Green line is a LONG, Red line is a SHORT.
4H example, work with all timeframes also for excellent 15m scalping.
SEE? many opportunities.
Tried this with 15m timeframe trading ALGO MOON or DOOM and the result is incredible.
With SUper BOSS and KNIFE CUT, you will earn money in any timeframe!
I may find 15 trades a day with this system.
See price history.
You not believe? i believe.

[BERA] KNIFE CUT
Hey beras and bulas, this is my gift for you!
Please message me after you tried my indicators.
This indicator work in sync with SUper BOSS or SB , check it.
KNIFE CUT
Is a special indicator with 2 metrics you can use for be a better trade and stop losing money entering useless positions.
This indicator can:
The Area in the center measure "Market cycles" check below, and "BUY PRESSURE", check the reaction with the price action, impressive? i know.
About the bars green or red, are trend bars, compare it to the price action and you can see that these bars catched all uptrends and downtrends.
(you can change also resolutions of background bars, current H4 resolution if you watch lower timeframes.)
*BUY PRESSURE / TREND BACKGROUND BARS
*MARKET CYCLES
This script work with every exchange and pairs, also forex.
See price history.
You not believe? i believe.

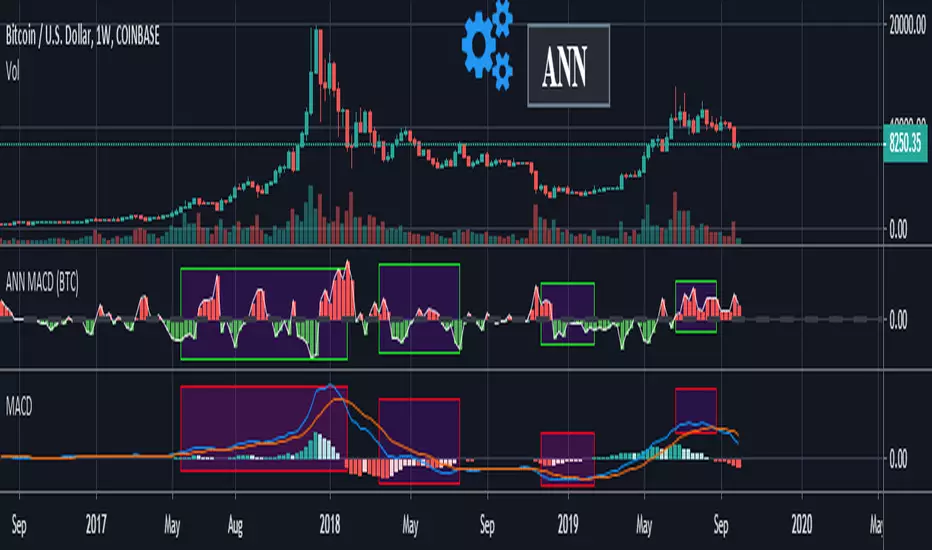
ANN MACD (BTC)
Logic is correct.
But I prefer to say experimental because the sample set is narrow. (300 columns)
Let's start:
6 inputs : Volume Change , Bollinger Low Band chg. , Bollinger Mid Band chg., Bollinger Up Band chg. , RSI change , MACD histogram change.
1 output : Future bar change (Historical)
Training timeframe : 15 mins (Analysis TF > 4 hours (My opinion))
Learning cycles : 337
Training error: 0.009999
Input columns: 6
Output columns: 1
Excluded columns: 0
Grid
Training example rows: 301
Validating example rows: 0
Querying example rows: 0
Excluded example rows: 0
Duplicated example rows: 0
Network
Input nodes connected: 6
Hidden layer 1 nodes: 8
Hidden layer 2 nodes: 0
Hidden layer 3 nodes: 0
Output nodes: 1
Learning rate : 0.6 Momentum : 0.8
More info :
EDIT : This code is open source under the MIT License. If you have any improvements or corrections to suggest, please send me a pull request via the github repository github.com
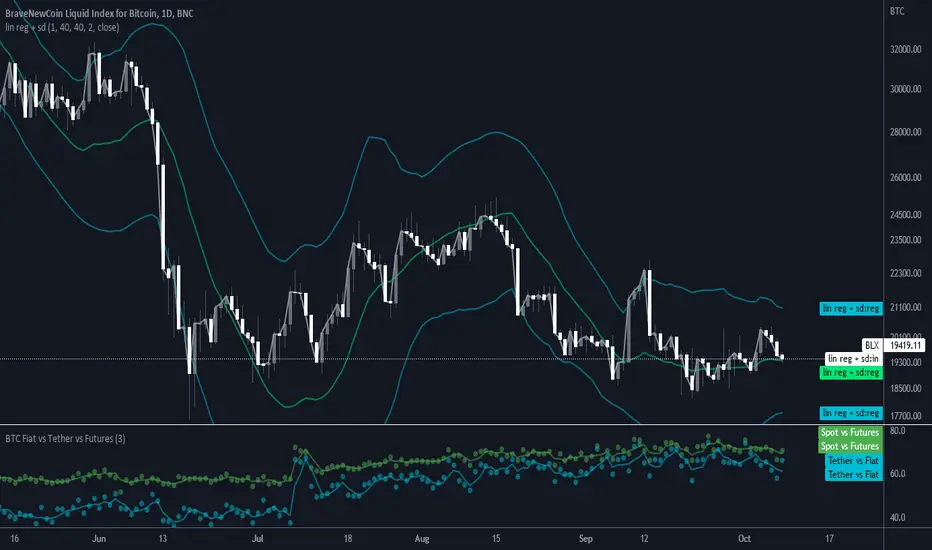
BTC Volume Fiat vs Tether vs FuturesFutures = BYBIT+ BITMEX
Fiat = KRAKEN + BITSTAMP + BITFLYER + COINBASE
Tether = HITBTC + HUOBI + BINANCE + BITFINEX
Spot = Fiat + Tether
Tether vs Fiat = 100 * Tether / (Tether + Fiat)
Spot vs Futures = 100 * Spot / (Spot + Futures)
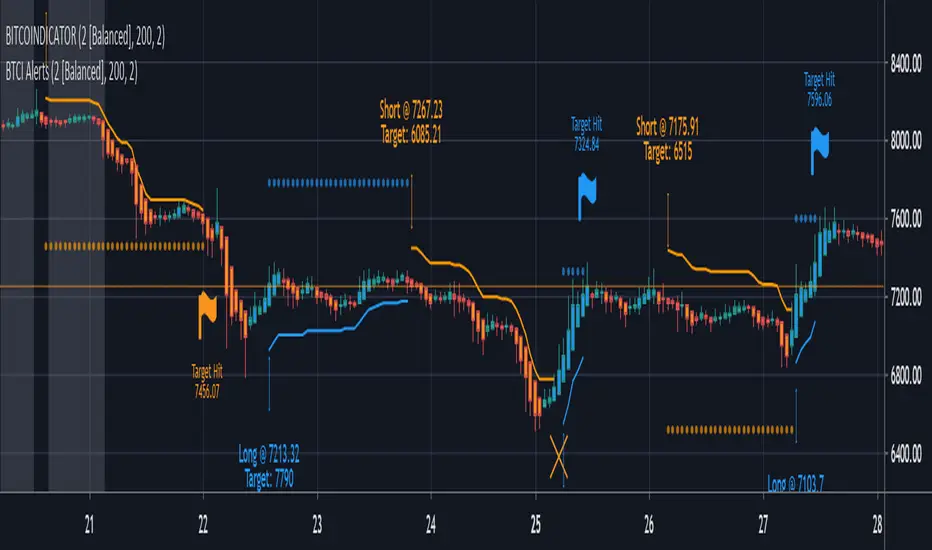
BITCOINDICATOR AlertsAdd this indicator to your chart to set up alerts for BITCOINDICATOR.
Alerts will tell you when to buy long and when to sell short.
They can also be used simply as entry/exit notifications or trend confirmation.
Unless you are a day trader, we recommend you only set up alerts for higher time frames to limit notifications.
How to use:
- In the top right of your chart, click the alarm clock symbol.
- Click the set alert "+" symbol next to Manage Alerts.
- In the pop-up box, change the condition to BTCI Alerts.
- Choose the alert you want - Buy Long or Sell Short.
- Choose ONLY either Once Per Bar or Once Per Bar Close.
Note: If you choose Once Per Bar, you will receive an alert the instant the trade condition is met. However, if the trade condition is unmet again in the same bar and stays unmet until the bar closes, the real-time price label generated by BITCOINDICATOR will have flickered out and the trade signal will be invalidated. This option is for more aggressive traders as it gets you into the trade earlier, but adds some risk.
- Adjust additional inputs and a custom message (we recommend to add your time frame to your message if you have multiple alerts set up).
- Click Create
*Bitcoindicator Alerts is part of the Bitcoindicator package and should only be used with BITCOINDICATOR.
For detailed information on Bitcoindicator and how to add it to your charts, please visit:
www.bitcoindicator.com
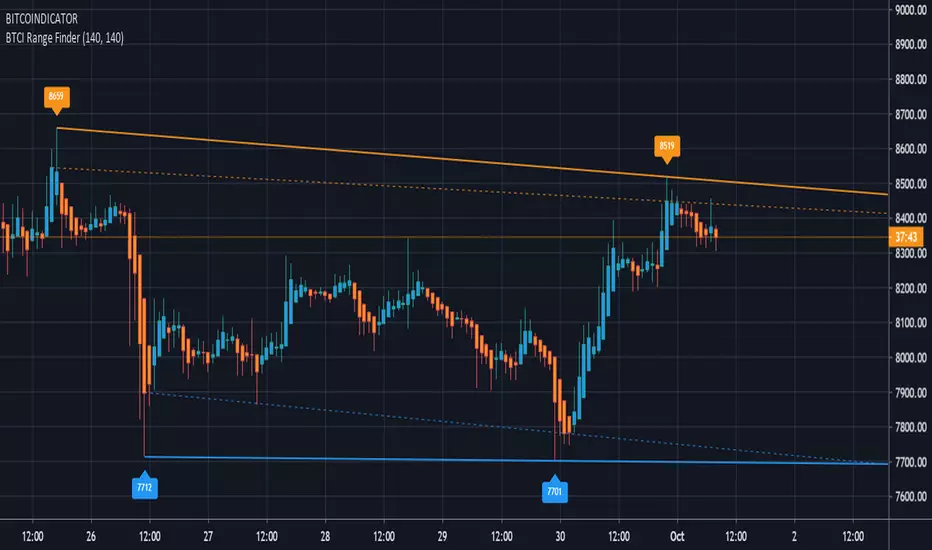
BITCOINDICATOR Range FinderShows the current trading range and market direction, with clear Support and Resistance zones.
Eliminates the need to manually draw trend lines and add price labels.
How to use:
Adjust the "Draw support/resistance from how many bars back" inputs to find an accurate trading range according to your timeframe and trading strategy.
Example (chart above): Bars back values are both set to 140. The left resistance label "8659" targets the "high" of the upper half of the bars back input (71-140). The right resistance label "8519" targets the "high" of the lower half of the input (0-70). The supports work the same way but target the "lows".
The dotted lines are drawn from the two "highest closes" (resistance) and the two "lowest closes" (support) over the same input range and can be used to create support & resistance zones.
Side note: the colored bars come from the BITCOINDICATOR indicator with the labels and symbols removed.
This indicator works for ANY chart and all markets.
*The Bitcoindicator Range Finder is part of the Bitcoindicator package.
For detailed information on Bitcoindicator and how to add it to your charts, please visit:
www.bitcoindicator.com
BITCOINDICATORAll-in-one indicator designed for Bitcoin (any BTC/USD pair), and works well for all Crypto/stable coin pairs. It utilizes individual trade signals from price momentum, EMA crossings, periodical VWAP, volume divergences, and market volatility to create a checklist that when filled, generates easy-to-read, real-time trade labels.
For detailed information on Bitcoindicator and how to add it to your charts, please visit:
www.bitcoindicator.com

Nitro LOTUSWelcome to the Nitro LOTUS.
This indicator does NOT repaint!
How to use: Wait for the candle to close before taking a signal. You can also set alerts with this indicator!
BULL = Buy alert
BEAR = Sell alert
DM if you have any questions!

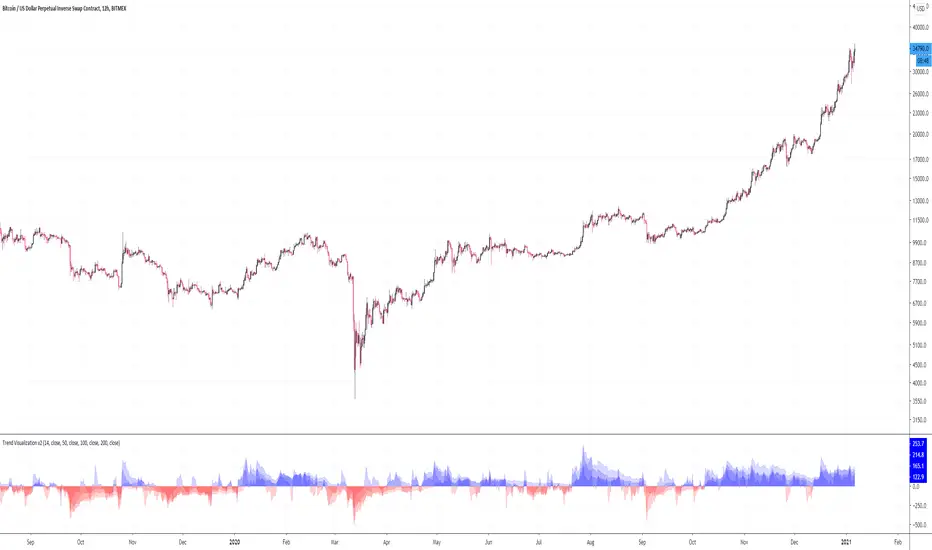
CL Trend VisualizationA trend strength indicator for visualizing momentum. Built from 5 different CCI periods and their averages.
Experimental.
Bitcoin Network Value to Transactions [aamonkey]Cryptoassets have been quite turbulent in the past few weeks.
At times like this, it is especially important to look at the fundamental foundations of cryptoassets.
This indicator is based on the Network Value to Transactions , or NVT .
Definition:
NVT = Network Value / Daily Transaction Volume
Because this indicator is pulling the Daily Transaction Volume for BTC it can only be used for BTC and the daily timeframe.

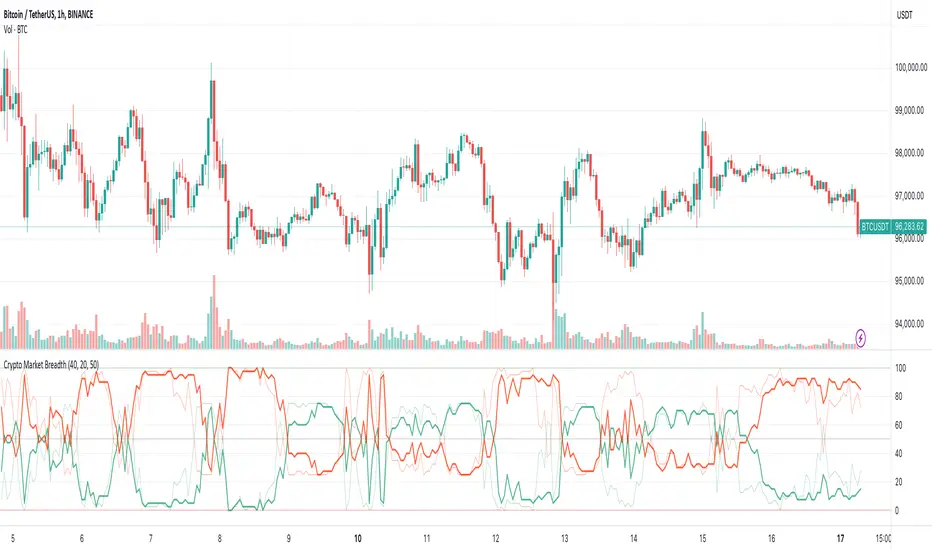
Crypto Market BreadthThis is the "Crypto Market Breadth" indicator from
I updated it to latest symbol so that it resolves again:
removed: BINANCE:NPXSUSD
added: BITFINEX:LEOUSD
Also helpful for automatic trading with WolfBot.org and TradingView Integration
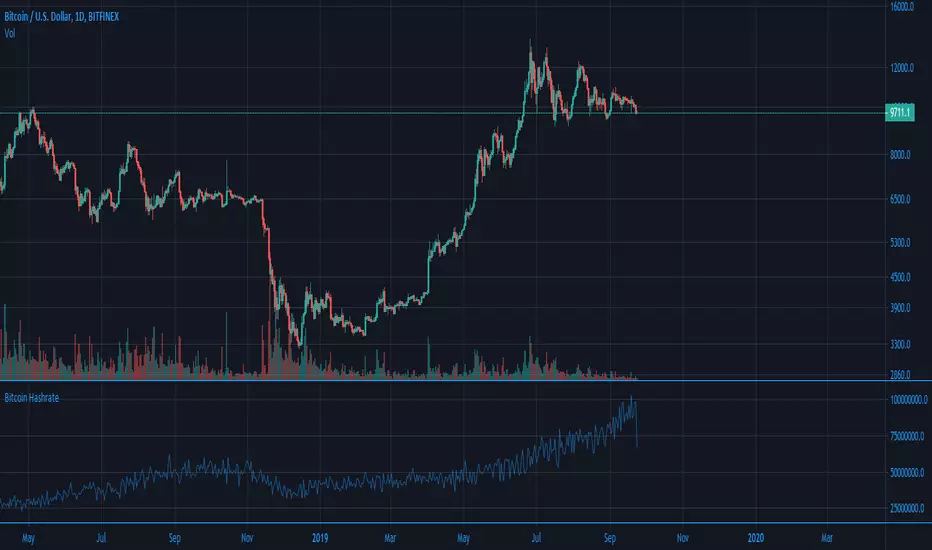
Bitcoin OnChain Metrics @BTC_JackSparrow (O)A series of plots representing Bitcoin on chain metrics like tx volume , hash rate, difficulty and way more from Blockchain.com
How to use? Up to you
Some sources update live, some sources update EOD (end of day)
To use as a non overlay, right click and move to new pane

Ori Bitcoin Number of Transaction per BlockThis indicator shows Bitcoin Number of Transaction per Block . Have options to toggle line/trend view, log on/off and smoothing for line view.

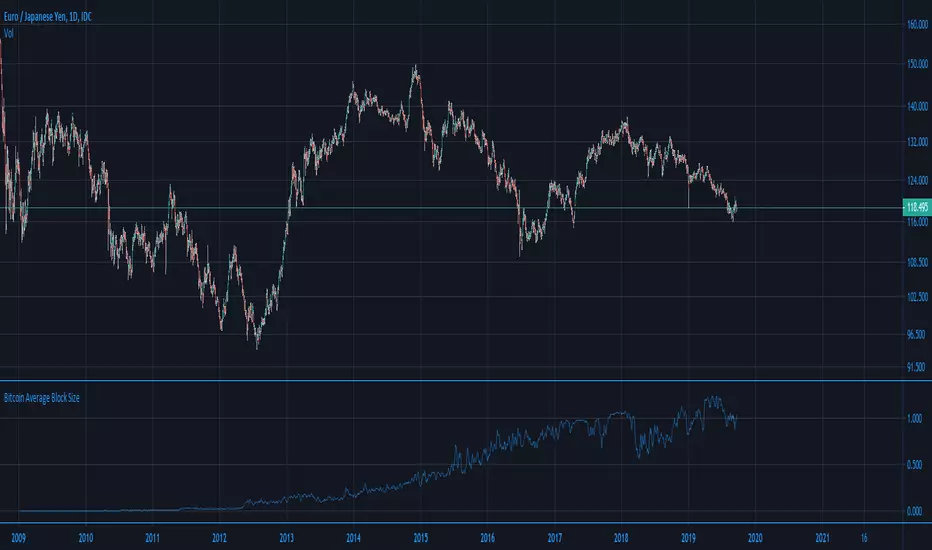
Ori Bitcoin Average Block SizeThis indicator shows Bitcoin Average Block Size . Have options to toggle line/trend view, log on/off and smoothing for line view.
Ori Bitcoin Cost Per TransactionThis indicator shows Bitcoin Cost Per Transaction . Have options to toggle line/trend view, log on/off and smoothing for line view.

Ori Unique Bitcoin Addresses UsedThis indicator shows number of unique Bitcoin addresses used . Have options to toggle line/trend view, log on/off and smoothing for line view.

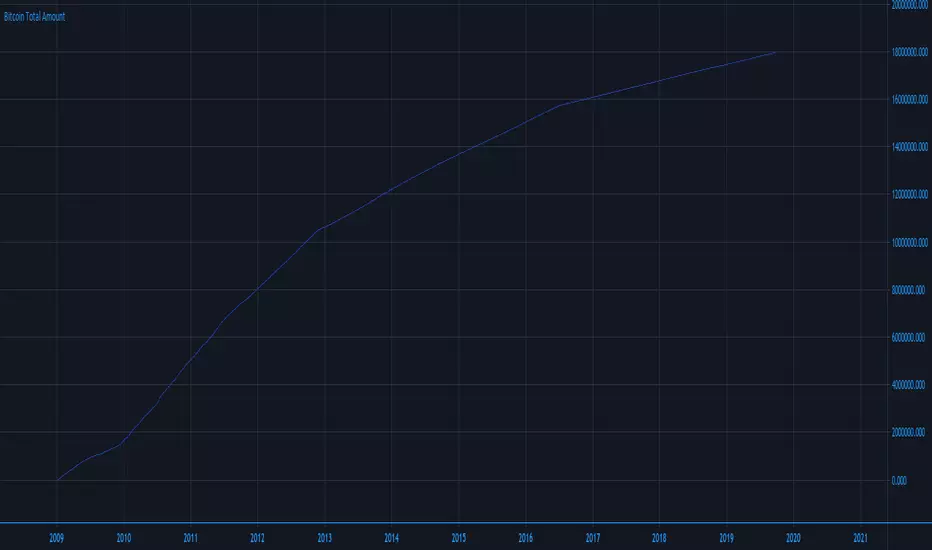
Ori Bitcoin Total AmountThis indicator shows total amount of Bitcoin. Have options to toggle line/trend view, log on/off and smoothing for line view.
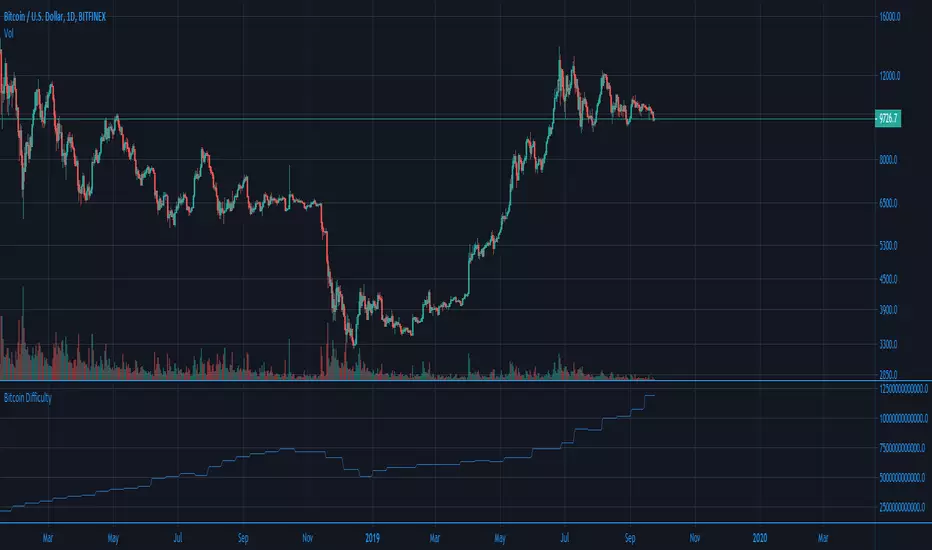
Ori Bitcoin DifficultyThis indicator shows Bitcoin Mining Difficulty. Have options to toggle line/trend view, log on/off and smoothing for line view.
Ori Bitcoin HashrateThis indicator shows Bitcoin Hashrate. Have options to toggle line/trend view, log on/off and smoothing for line view.