Bitcoin (Mata Wang Kripto)

msoro daily $1 DCAPlots the dollar value of total btc accrued over the past year by buying 1 dollar's worth daily.
Black line is the breakeven level.


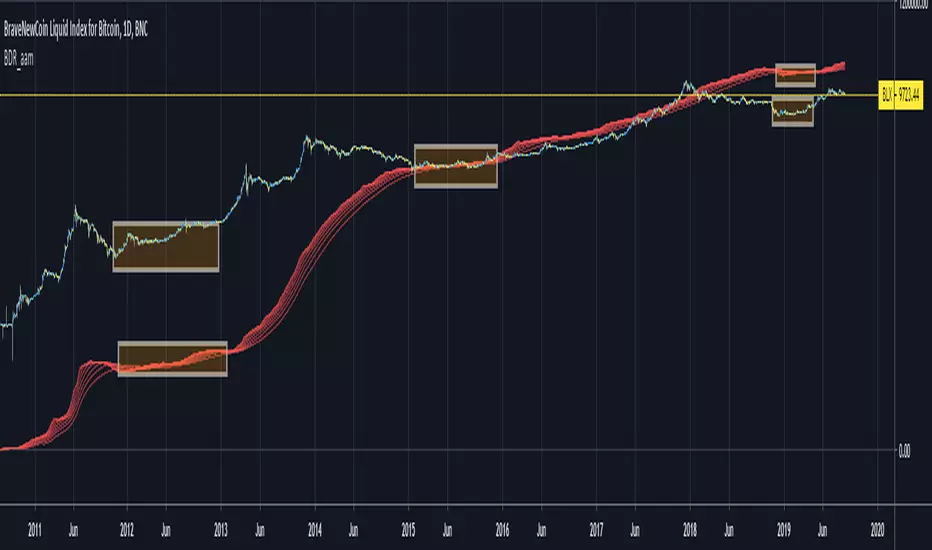
Bitcoin Difficulty Ribbon [aamonkey]This is another tool to find big cycle bottoms that is very unknown yet effective.
The Difficulty Ribbon speaks to the impact of miner selling pressure on Bitcoin`s price action.
When network difficulty reduces its rate of climb, miners are going out of business, leaving only the strong miners who proportionally need to sell less of their coins to remain operational, this leads to less sell pressure and more room for bullish price action.
The best times to buy Bitcoin are zones where the ribbon compresses.
The ribbon consists of simple moving averages of Bitcoin network difficulty so the rate of change of difficulty can be easily seen.
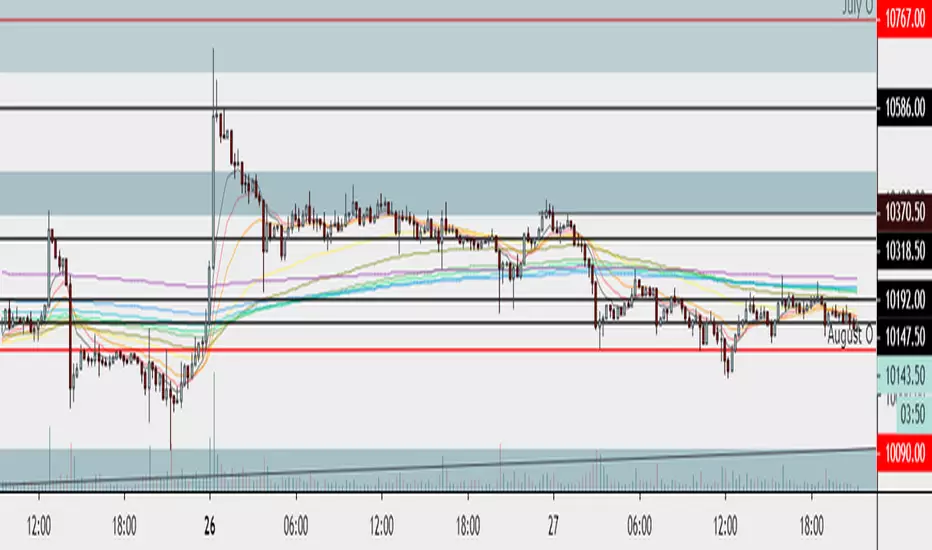
BullShrimp's 10EMAsA simple bundle of EMAs with some odd numbers that I found good confluence on 15min, 1h, 4h, 12h, 1d, 1w on BTC and on ALTS.
Works good for dynamic S/R on LTF and high probability target on MTF and HTF.
Try it out during your scans.
Lemme know what you think.
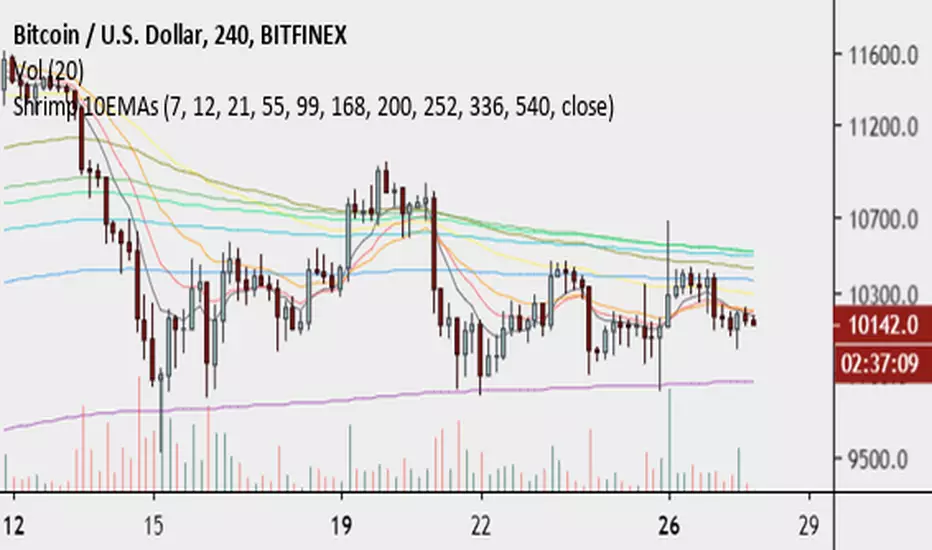
Shrimp 10EMAsA simple bundle of EMAs with some odd numbers that I found good confluence on 15min, 1h, 4h, 12h, 1d, 1w on BTC and on ALTS.
Works good for dynamic S/R on LTF and high probability target on MTF and HTF.
Try it out during your scans.
Lemme know what you think.
Your CRYPTO Screener - MACD 0 LAG editionHello traders
What's good?
1 - Quick introduction
This script is to demonstrate a proof-of-concept - showing you again what you thought wasn't possible might become (with some tricks) in the realm of possibles !!!.
I get requests for people who want a custom screener because the native TradingView Stocks/Forex/Crypto screeners don't allow to plug external indicators. (example: www.tradingview.com
This is entirely true and I have also good news for you, we can hack the system one more time. As Hackerman would say, "IT"S HACKING TIME !!!" (ref : KUNG FURY . (#geek #reference #done #for #today)
What if you could build your own personalized screener based on your custom indicator? "No Dave stop smoking, that's not possible, go back to eating your baguette". Say no more, let me present you my new script called YOUR CRYPTO Screener (MACD 0 LAG)
2 - What is a MACD ZERO LAG?
We'll all agree this indicator is NOT in the TradingView screeners so I'm not cheating here :)
A MACD ZERO LAG is a MACD that .... suspens.... wait for it.... DOES NOT lag.
The traditional MACD is based on exponential moving averages and as moving averages are lagging, then the MACD is lagging also. I'll spare you all the maths behind the MACD ZERO LAG but in short, this is a way more reactive indicator than the traditional MACD
I shared before the version that I personally use for my own trading : MACD 0 LAG nTREND coloring
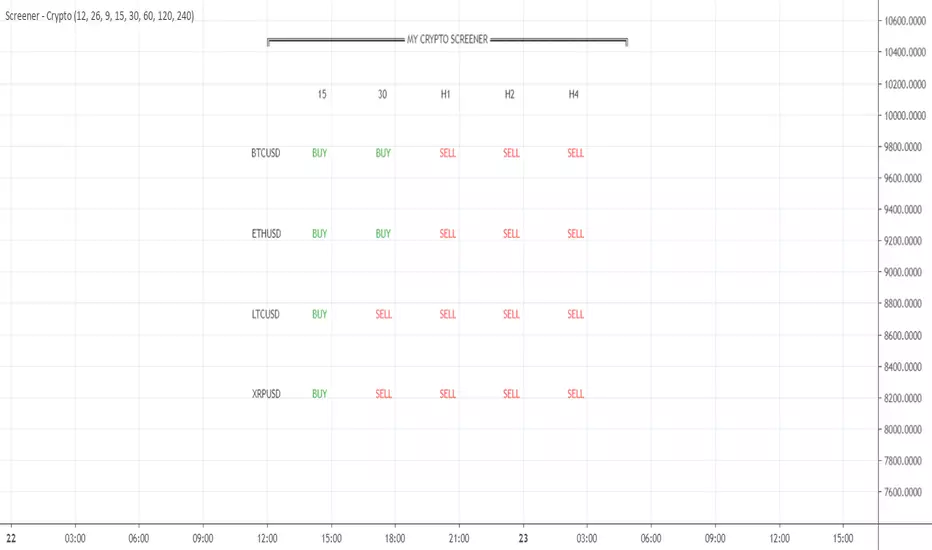
3 - Crypto Screener specifications
If I could do a screener as complete as the native one, this would be wonderful but ... we cannot and this is due to technical reasons. To call indicators from different timeframes, I have to use the security function. And we're limited to 40 security calls per indicator.
That explains why I selected 4 crypto assets and 5 timeframes and the MACD zero lag output for each asset/timeframe - which gives a total of 4 * 5 * 2 = 40
You'll be able to select from the interface the 5 timeframes that you want for your screener
In this script, you'll get a :
- BUY whenever the MACD ZERO LAG for your asset/timeframe is green.
- SELL whenever the MACD ZERO LAG for your asset/timeframe is red.
4 - Can you hack it even more?
If you want to add other timeframes or assets, you can either, change the code or add the indicator on another chart.
I made the source code generic enough so that you can update it yourself easily
Example:
Chart 1 will list BTCUSD, ETHUSD, LTCUSD, and XRPUSD in m5/m15/m30/H1/H4 and Chart2 could list BTCUSD, ETHUSD, LTCUSD and XRPUSD in H6/H8/H12/Daily, etc...
Once again the sky (and your computer RAM capacity) is the limit
5 - Can you super hack it even more?
1/ This script is only a proof-of-concept that you can build your own custom screener. Imagine having the Algorithm Builder and being able to connect it in a single click to a custom screener using your own configuration :)
How coooooooooooooooool would that be!!!
This screener version will be available on my website in a few weeks along with all the tools I'm spamming you about since the beginning of July (#shameless #self-advertising)
2/ For a nicer scripter, let's keep in mind that TradingView just enabled Webhooks this week. This will allow my company to offer custom screeners design and hosted on your own website. Those screeners will be for sure nicer than the indicator version
That's it for today and for this week
I won't even touch the laptop this weekend and will enjoy life a bit
Love you all
Dave
____________________________________________________________
Be sure to hit the thumbs up. Building those indicators take a lot of time and likes are always rewarding for me :) (tips are accepted too)
- If you want to suggest some indicators that I can develop and share with the community, please use my personal TRELLO board
- I'm an officially approved PineEditor/LUA/MT4 approved mentor on codementor. You can request a coaching with me if you want and I'll teach you how to build kick-ass indicators and strategies
Jump on a 1 to 1 coaching with me
- You can also hire for a custom dev of your indicator/strategy/bot/chrome extension/python
Bitcoin Difficulty RibbonThe Bitcoin Difficulty Ribbon is based on Willy Woo's implementation and it gauges the selling pressure experienced by Bitcoin miners.
The Bitcoin Network Difficulty is a measure of how complicated it is to find the next block, compared to the ease of finding the easiest possible one.
When the difficulty decreases it's a hint that the mining sector is experiencing difficulties and the longer it contracts, the more miners might get out of business.
During these contracting times, the Difficulty Ribbon narrows and becomes a significant proxy to recognize cycle bottoms.
Default settings: Daily Time Frame and SMA mode.
Credit: Willy Woo

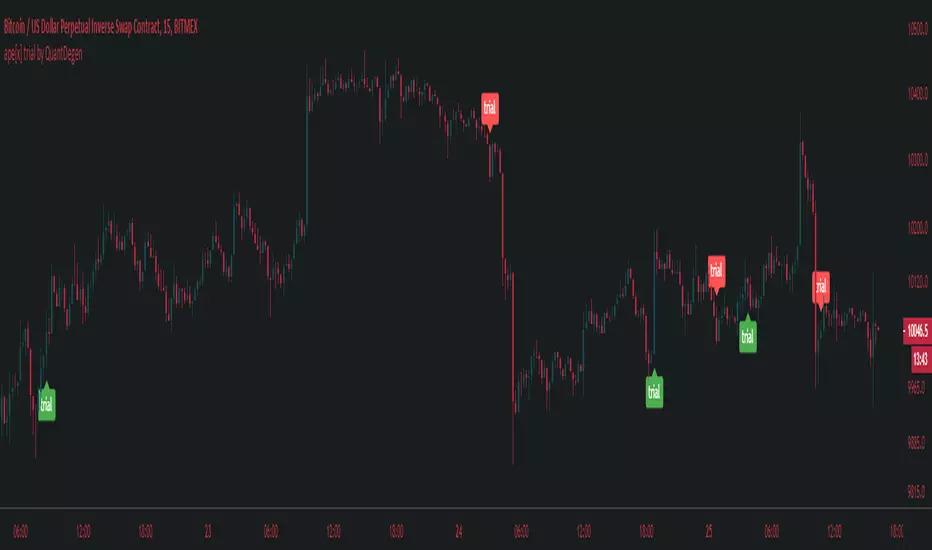
ExpressHow to use this indicator: This is an all-around indicator that is capable of being used on any chart. From 5m time frames up to 1 Day time frames.
There are BULL/BEAR signals which represent BUY/SELLS. You can set alerts with this indicator as well.
No back tester is currently provided with the Express.
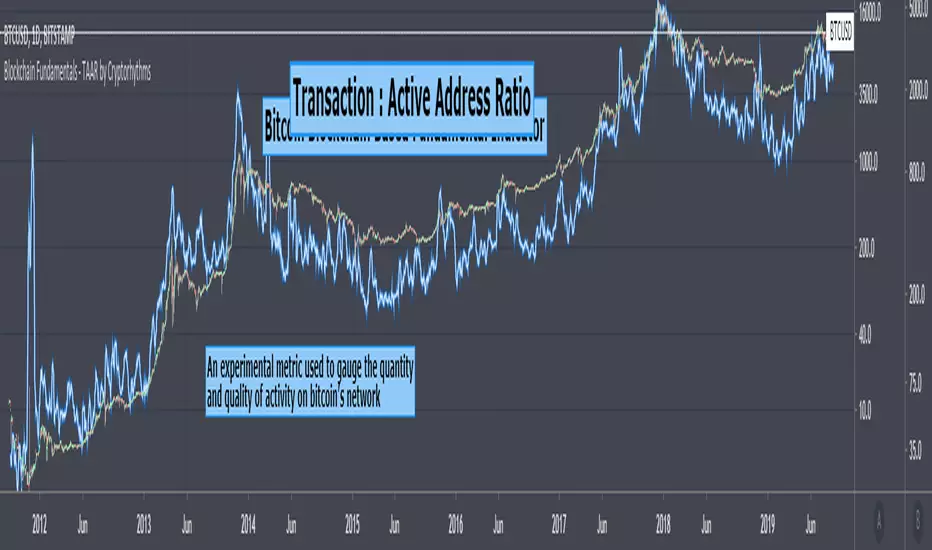
Blockchain Fundamentals - TAAR by CryptorhythmsBlockchain Fundamentals - TAAR (Network Transaction Vol : Active Address Ratio) by Cryptorhythms
Link to Instructions Page / Idea will be linked below.
Q: Why are we separating instructions from the indicator page?
A: Well Tradingview recently instituted a change that only open source script authors can gain rep for their efforts. Any script that is protected or invite only no longer gets points, even if its still free for anyone to use.
We (respectfully) disagree and feel that it is unfair. We ask everyone to like the IDEA (linked below) for this script if you want to support our efforts to keep releasing free (but protected source) indicators.
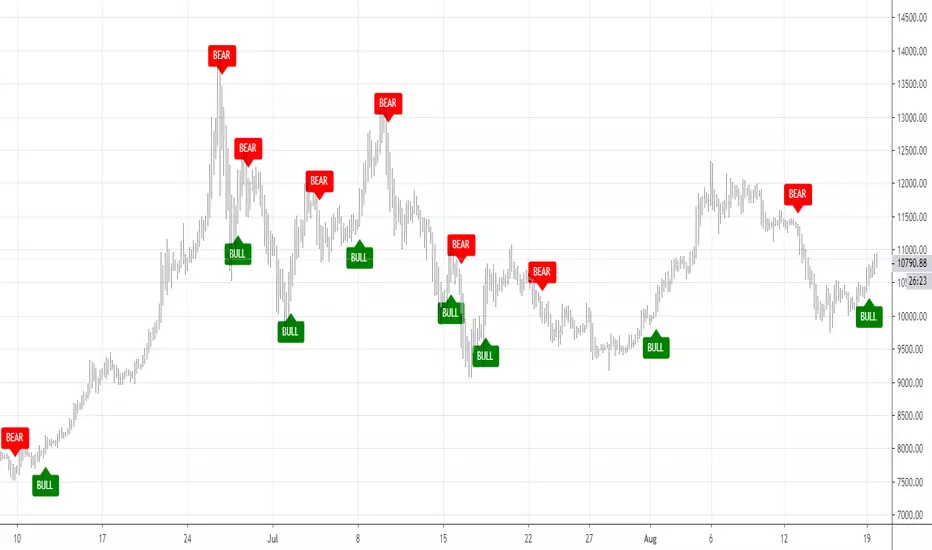
Classic MaverickWelcome to the Classic Maverick.
How to use: Apply to any chart, on any time frame. You will see BULL and BEAR signals on the chart. A BULL signal represents an entry/buy in, and a BEAR represents an exit/ sell.
You can use the Maverick to scalp on low time frames such as the 5m, 15m, 30m etc. Or use the Maverick on higher time frames such as the 1hr, 2hr, 4hr.
You can use regular candles but Heikin Ashi are recommended for better accuracy.
Settings alerts: You can easily set buy/sell alerts by selecting Maverick in the set alerts tab and selecting BULL for buy alerts and BEAR for sell alerts.

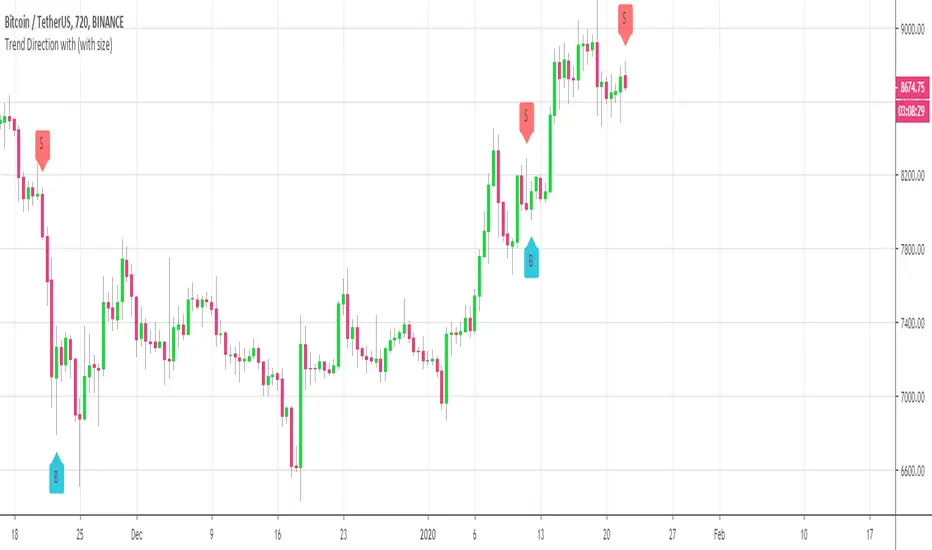
Customizable Trend DirectionHi everyone
Publishing this as a few clients want to try it out
It's basically a proof-of-concept to show that size and text can be manipulated :)
Size and text and label vertical position are udpatable
Will publish an open-source script today or tomorrow hopefully
Dave
BitcoinMF RSI + EMA Combined MemecatorA script combinig RSI + EMA + important levels of RSI
For more follow BitcoinMF on TV, Discord and Telegram.
DYOR
NOT FINANCIAL ADVICE.
good Luck and Trade Safe

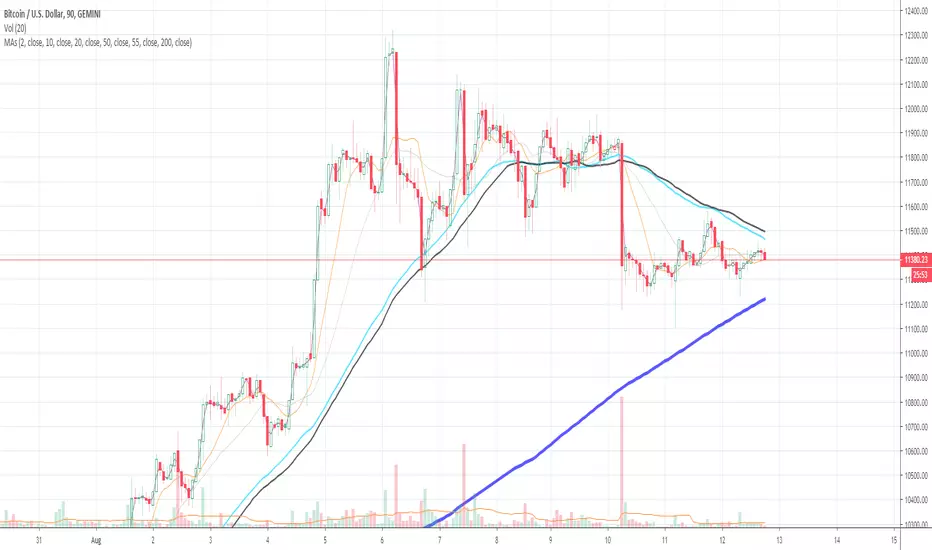
Moving Averages (2, 10, 20, 50, 55, and 200)This allows you to plot multiple moving averages under one indicator. This plots the 2, 10, 50, 55, and 200 moving average. You can turn each one off or on as needed through the settings gear icon.
Blockchain Fundamentals - Difficulty Ribbon by CryptorhythmsBlockchain Fundamentals - Difficulty Ribbon by Cryptorhythms
Link to Instructions Page / Idea will be linked below.
Q: Why are we separating instructions from the indicator page?
A: Well Tradingview recently instituted a change that only open source script authors can gain rep for their efforts. Any script that is protected or invite only no longer gets points, even if its still free for anyone to use.
We feel that is unfair so we ask everyone to like the IDEA (linked below) for this script if you want to support our efforts to keep releasing free (but protected source) indicators.

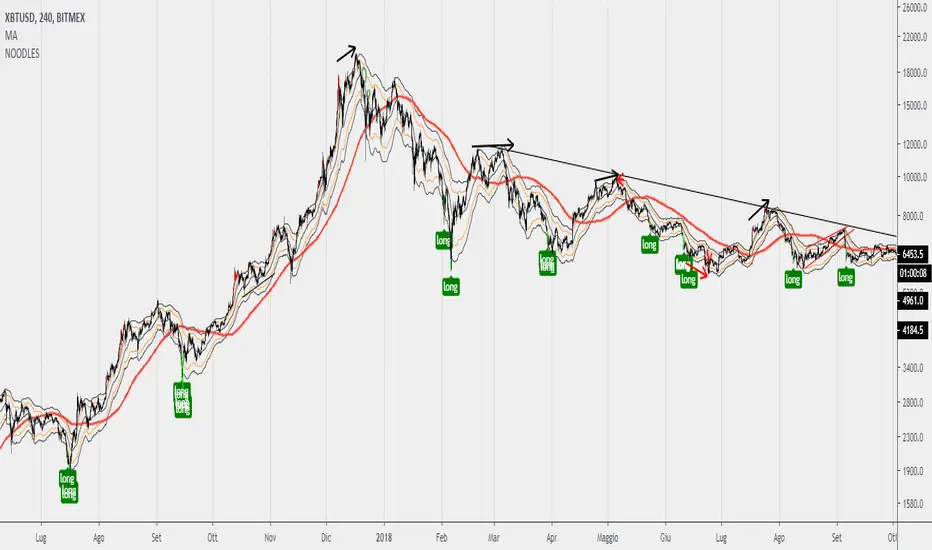
Noodles ema bands + BUY/SELL signal CandleEma bands as support and resistance based on 12/26.
+Buy and Sell signal candle (green and red)
This script work better on 1 hour timeframe. for altcoin change setup from source: ''LOW'' to ''OPEN''
CoinStudio Signals Full (read the description)CoinStudio Signals Full displays long and short, as well as reasonable targets and allows to set custom alerts based on them.
Possible targets are flagged as "C" for the most previously occurred signal. These targets indicate chances to sell before an expected reversal.
If the signals switch from let's say Short to Long and there are no targets between them, it either means the signal failed or the target is falling together with a new signal.
CoinstudioSignals work for any asset (crypto, stocks, gold , silver , etc.) and work for every time-frame.
However, daily and 4hr usually give the best results.
To add this script, please send me a message and ask for an invite!

CS Signals Lite (read the description)CoinStudio Signals Lite displays long and short entries.
Additionally, the Full version supports custom alerts based on the signals.
To get access to the full version and alerts, please message me for an invite.
The signals work for any asset (crypto, stocks, gold , silver , etc.).
In principle, the signals work for every time-frame but depending on the asset some work better than others.
However, daily and 4hr usually give the best results.

CS Signals Full (read the description)CoinStudio Signals Full displays long and short entries and allows to set custom alerts based on them.
The signals work for any asset (crypto, stocks, gold, silver, etc.).
In principle, the signals work for every time-frame but depending on the asset some work better than others.
However, daily and 4hr usually give the best results.
To enable this script, please head to our Discord and ask for an invite:
discord.gg

Bar RatioBar Ratio is an indicator tool that provides real-time likelihood of the current bar closing up or down (green or red).
Technical status, volatility and time are key elements in this indicator.
From the open of a bar, a ratio of 50% is assumed before changes from factors are considered.
The factors that change the likelihood of a bar closing up or down and their relative weight are listed below.
Micro-Trend observed over the last 20 bars - up to 2.5%
Macro-Trend observed over the last 70 bars - up to 2.5%
Current bar price against beginning of Micro-Trend - up to 2.5%
Combination of significant change above average volatility and move against direction of Micro-Trend - up to 2.5%
Combination of significant change above average volatility and move against direction of Macro-Trend - up to 2.5%
Previous bar direction up to 10 consecutive bars - up to 3.75%
Current status of bar (higher or lower) - up to 3.75%
Significance of change against average volatility - up to 5%
Time until bar close - up to 25%
Total: 100%
If all factors are synchronised, the likelihood of the bar closing up or down can be indicated at a probability of 100%.
While the practical ability for this to be used for trading is limited, the tool can be useful for choosing when it is safe to open a trade.
Time is a key element as the likelihood of the bar remaining at current status by the close of the bar is constantly increasing.
The accuracy of this tool is incredible and should be noted as it's primary trait.
You can find and use this indicator on any time-stamp or security such as Cryptocurrency, Forex, Stocks or Indices.
The Bar Ratio can be located by searching in your public indicator library at the top of your chart and adding it to your screen.

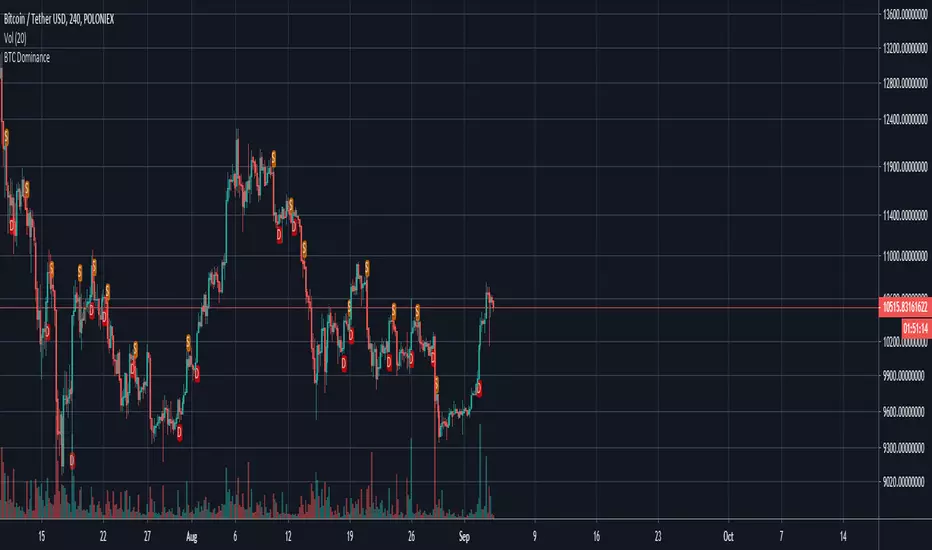
BTC Dominance IndicatorThis script calculates the BTC dominance and adds markers as overlays on top of your crypto chart.
A red "D" means "BTC dominating" and an orange "S" means "BTC submissive". In both cases further price actions are imminent.
You can use this script for any crypto asset to see how it performs while btc is dominating.
If you are for example trading a BTC paired asset, then this can give you a warning if BTC starts to dominate (BTC paired assets tend to dump if BTC dominates).
On the other hand, you can use this as signal on USD paired cryptos if BTC dominates as USD paired cryptos tend to go with BTC.
It is recommended to use additional indicators with this as it is not meant as buy/sell signalling tool.
MaverickWelcome to the Maverick.
How to use: Apply to any chart, on any time frame. You will see BULL and BEAR signals on the chart. A BULL signal represents an entry/buy in, and a BEAR represents an exit/ sell.
You can use the Maverick to scalp on low time frames such as the 5m, 15m, 30m etc. Or use the Maverick on higher time frames such as the 1hr, 2hr, 4hr.
You can use regular candles but Heikin Ashi are recommended for better accuracy.
When using Heikin Ashi, I have included a real price line which shows the actual price of the asset/chart at the close of each candle.
Settings alerts: You can easily set buy/sell alerts by selecting Maverick in the set alerts tab and selecting Bull for buy alerts and BEAR for sell alerts.
To gain access to this INVITE ONLY script, please join the discord for a free trial: discord.gg
