FOMO_V2_Trend_Cloud// Currently in Testing.
// Official information will be published when back testing is complete.
Bitmex

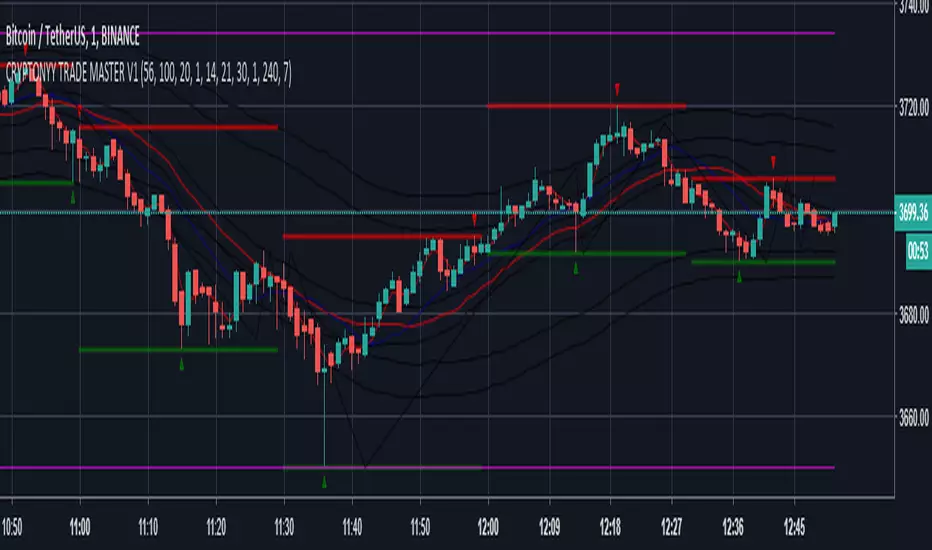
CRYPTONYY TRADE MASTER V1THIS SCRIPT IS ONLY MADE FOR BITMEX TRADERS.
IT WORKS ON 1MINUTE TIMEFRAME SMOOTHLY.
ADVANTAGES:
1. AUTO BUY/SELL SIGNALS.
2. 95% ACCURACY.
3. U WILL NEVER BE IN LOSS BECAUSE WE DEVELOPED THIS WITH OUR PERSONAL VOLATILITY INDICATOR.SO IF MARKET GOES OPPOSITE IT WILL GIVE U THE SIGNAL BEFORE YOUR LAST ENTRY PRICE.
4. DOUBLE CROSS INDICATOR.
5. MUCH VOLATILE=INCREASE THE SIGNAL ACCURACY.
6. 1MINUTE TIMEFRAME IS BEST TO TRADE WITH THIS SOFTWARE.
THOSE WHO WANT TO BUY THIS OR WANT DEMO COMMENT BELOW,I WILL MESSAGE YOU.
XBT swing-SCALPER-- with alerts-- COIN OBSFor backtested strategy:
This is the same strategy, with alerts for bots.
strategy takes much into consideration,
swings, rsi, mfi, with some safety nets.
For actual use, send me a DM.

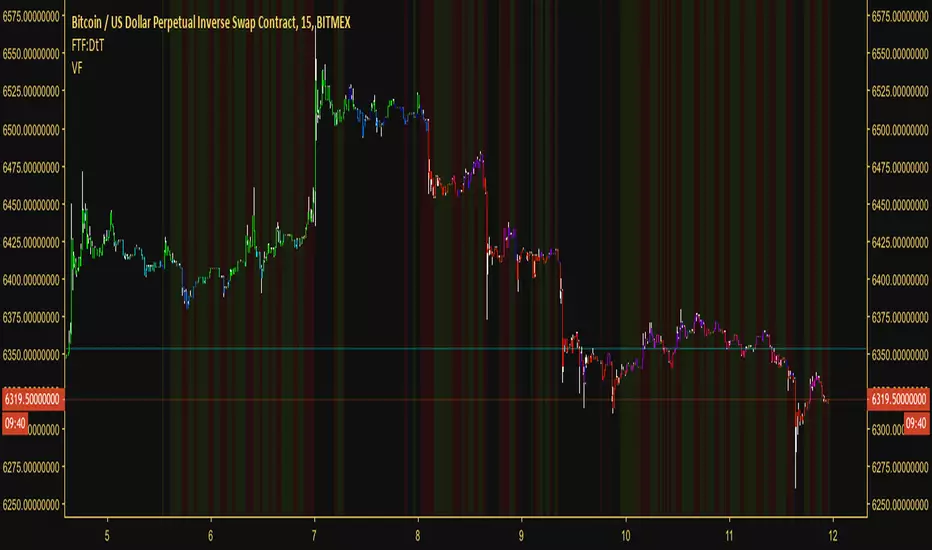
Trend is your friendThis indicator evaluates the trend based on crosses of two McGinley moving averages. It paints candles accordingly (it does not repaint), so you can see what the indicator is saying more clearly and stay in your trade until you see a period of consolidation or a reversal. You can control how far away those moving averages need to be for you to consider it a trend. If this distance is not met candles color is not changed and it shows you that the market is in a period of consolidation. I also added visualization of RSI, so you can have an easier time finding appropriate profit targets. For stop loss I would recommend placing it a couple points above or below the previous high / low that is located above / below you final target for entry. You can also use a certain percentage that works for you. I tried adding a stop loss based on ATR, but I did not like the results. Using market structure is a better choice in my opinion.
Here is a basic trading strategy for the default settings:
Wait for the indicator to start printing a series of green or red candles. After that you can enter a long or a short around moving averages. Another valid place to entry is the specific RSI zone. If we are in an uptrend buying when RSI is oversold can be beneficial as you expect market to recover. I do not recommend changing RSI from 14. Vice versa for the downtrend. It gives you an edge as you know at what price RSI will be oversold and allows you to place trades in advance. Pretty neat! You need to realize that no indicator or strategy can give you an exact entry. There will always be some margin of error. What I wanted to say is that if there is a strong trend up and you buy around your key moving averages and when RSI is oversold you entered in good places and there is a pretty good chance you will make money.
Time frame settings:
If you want to use tighter stop losses I would recommend sticking to 15m. Do not go lower. It is not worth the stress. 1h and 4h seems to be very good as well, but expect your stop losses to be wider. What I personally tend to do is display 15m, 30m and 1h and compare it. Think of it as a short, mid and long term. That way you can see things little bit better.
Examples:
1H chart BTC
4h chart EUR / USD
1D chart NASDAQ
15m chart BTC (Daytrading)
That last chart shows that even if you were longing while the trend was about to change you still had a good chance to close it with a little profit and switch to short easily. The default settings is what has worked the best for me. Feel free to change them as you see fit and do not forget to let me know if you find something that works better :)
Notes:
Either disable wick display or change it to a neutral color like gray for both green and red candles. Unfortunately pine script does not allow wick painting, so if you have red / green wicks it will look terrible. If RSI visualization makes your candles look too small you can go to settings and disable the display of individual RSI levels. You will still be able to see the zones, but the scale won't be affected.


FOMO_Momentum_ScalperIndicator is easy to work with.
The histogram indicates the momentum.
Nothing fancy but signals are pretty accurate
Dark Green Bars on Histogram - Buying opportunity (Momentum of dump is decreasing)
Dark Red Bars on Histogram - Selling opportunity (Momentum of pump is decreasing)
Works best on 1m chart for those great scalping opportunities. Signals are based on increasing Buy/Sell momentum against the direction of the movement.
Haven't tested on any instrument except BTC.
Haven't tested for divergences but it should do the job.
P.S. It doesn't give too many signals as it waits for extreme conditions.
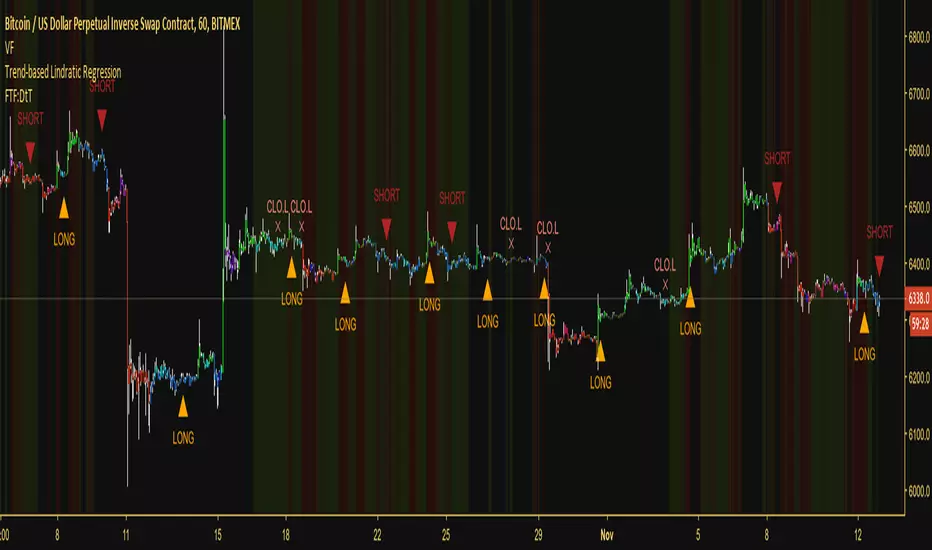
Trend-based Lindratic RegressionThis is an effective trend-following script that uses a finite volume element, linear regression, quadratic regression and multiple EMAs to define appropriate times to enter and exit the market. It can be applied to any asset that has volume data available for it.
As it follows the trend it's a very low-risk strategy, but it's not made to catch and ride reversals. It would rather close a long at the top and close a short at the bottom, although this means you can expect not to be stopped out on any trade you take.
Works on any timeframe, although I did create this with the intention of scalping, so shorter timeframes are recommended.
Combined with a volatility filter, this would be a very effective script, allowing you to stand away from the market during flat periods and trading with the trend during exciting periods.
Access to the script will be grated for 10$ of most low-fee cryptocurrencies, as well as BTC. If you're interested reach out to me through TradingView or, alternatively, contact @overttheraibow through Telegram.
If there's enough demand for it, I will also create a strategy version of this study which will be given for free to those who purchased the script. As always, maximum 250 places available.
Good luck!
RSI Multi Time Frame [Jigga]This indicator simply displays RSI on 4 time frames. You can configure individual RSI lengths as well. The first two RSIs are more visible to prevent clustering. It is possible to define oversold / overbought areas and the script displays the middle line as well.
A couple of use cases:
Comparison of 7, 12, 18 and 24 RSIs on a given time frame
Comparison of 14 RSI on 30m, 1h, 2h and 3h time frame (Default settings)
Please, always use a proper stop loss and risk management.
Here you can see it in action:
BTC - BitMex
BTC - BitMex

RSI Bands Multi Time Frame [Jigga + LazyBear]This is a modified version of LazyBear's RSI Bands script. I added the possibility to display multiple RSI bands, so you can see the zones, where it is viable to enter a long or a short. You can also use different time frames, so you can visually see where any specific value of RSI is for your given time frame. This gives you a lot of possibilities. Default settings use 1h time frame and the most common reversal areas for RSI. Feel free to change the settings as you see fit. If the script makes your candles too small, you can go to style and turn off individual RSI bands. After that you will still be able to see the zones, but the scale of your chart won't be affected.
It also displays the middle line, which shows you the current trend and can prevent you from entering a long, when RSI is oversold during a strong downtrend or a short, when RSI is overbought during a strong uptrend.
Do not forget to use a proper stop loss and risk management.
Here you can see it in action in different markets:
BTC - BitMex
NASDAQ Composite - Stocks
EUR / USD - Forex

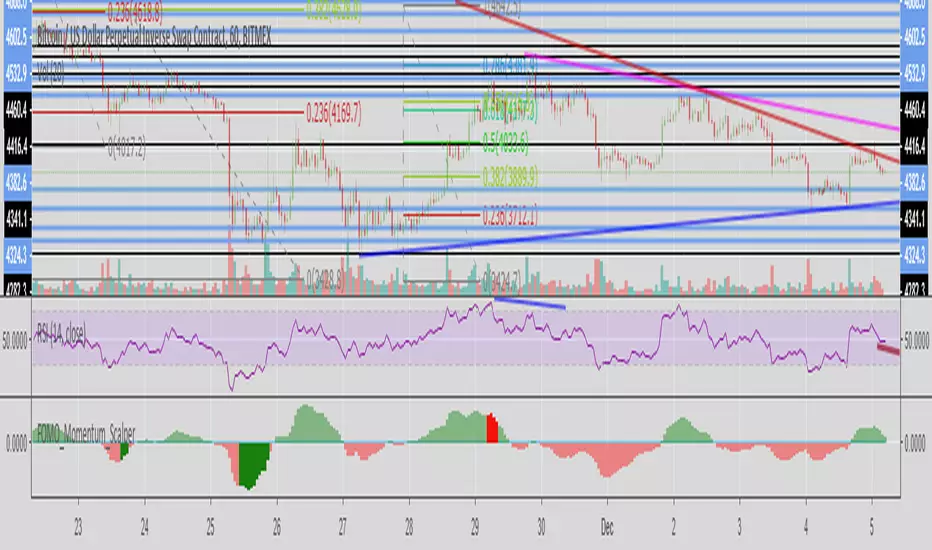
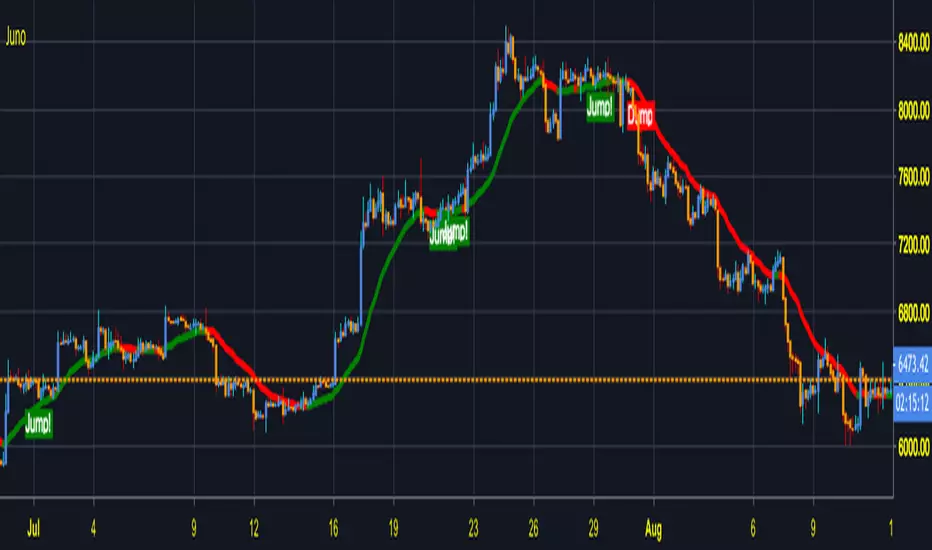
Juno ReactorJuno Reactor Its a Indicator base on Accumulation Distribution Method
What u can expect ? JUNO REACTOR REACTION !!! This indicator its perfect for those who like adrenaline and Leverage in Bitmex XBT
wont be many signals to Trade for long time frames but the ones u have will be EPIC !!!
If u want more Signals just go to smaller time frame But Strategy best result its at 3H ,
Calculating The Volume the Hidden Orders and Regular & Hidden Divergence to find the perfect setup before a BIG JUMP TO THE MOON!!
Initial Capital from February of 2017 of 100$
Netprofit 1 Million%
Backtest Calculate without Leverage
Strategy 3h TimeFrame Backtest
i68.tinypic.com
i64.tinypic.com
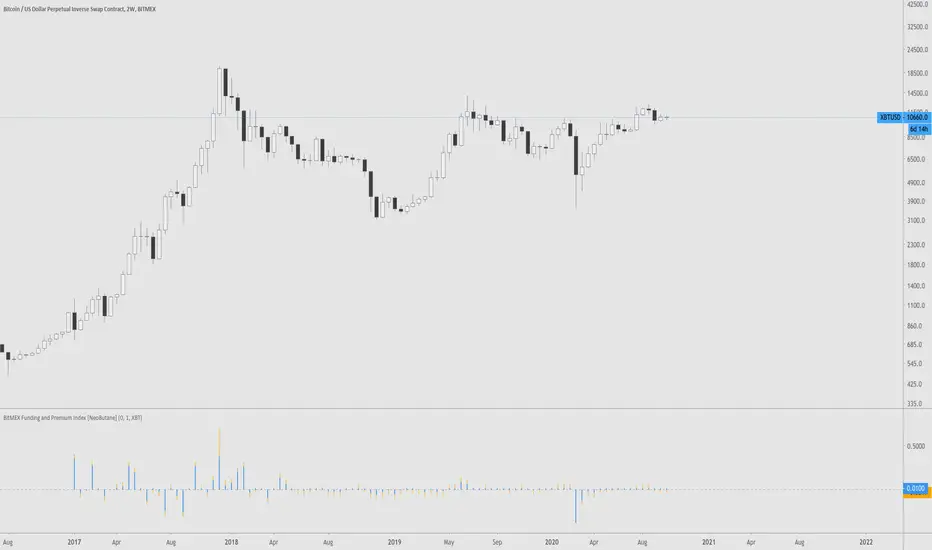
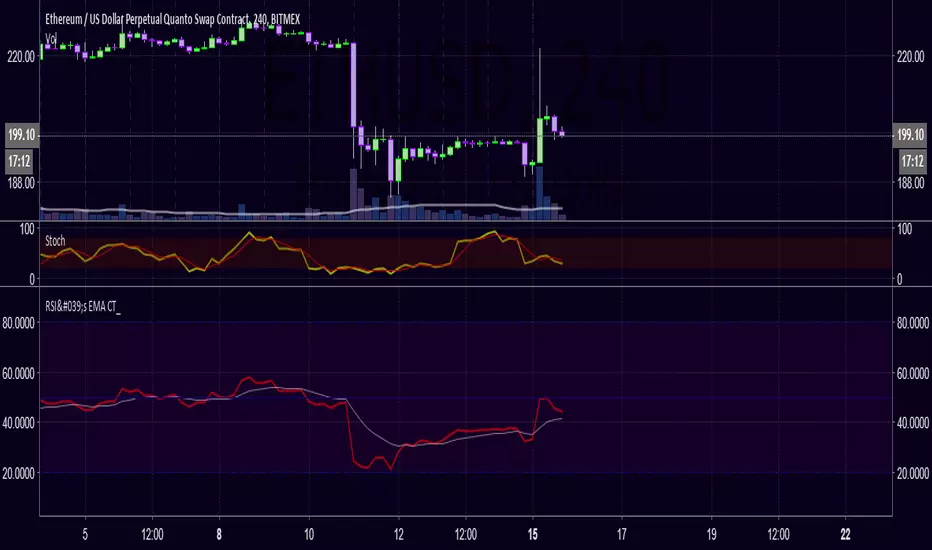
BitMEX Funding and Premium Index [NeoButane]This is a simplified version of the funding toolbox with only final funding and the premium index. As you can see, Ethereum funding makes zero sense.
RSI's EMA by @cryptoTrader_RSI Indicator with EMA of RSI. Great Confirming Signals. Modified version of CM_ and lazyBear. *RSI is red
MTF MTF Fibonacci H LinesA Multi-Time-Frame and Core Trading Indicator for my next Fibonacci bitBull Bitcoin Bot. It Automatically draws Support and Resistance from the Golden Ratios found in the Fibonacci sequence. Also plots a Zig-Zag from the Highs and Lows of the selected Time-frames. xbtusd bitmex futures

Bitmex BTC FuturesBitmex / Bitcoin indicator.
Just a simple overlay to visualise the contango / backwardation on Bitmex btc futures products so you know which to take position in, at a glance.
There are two selectable instruments (I have Dec18 and Mar19 selected already). By default the one with nearest settlement date is plotted with a filled coloured band from current price, the other plots a cross symbol.

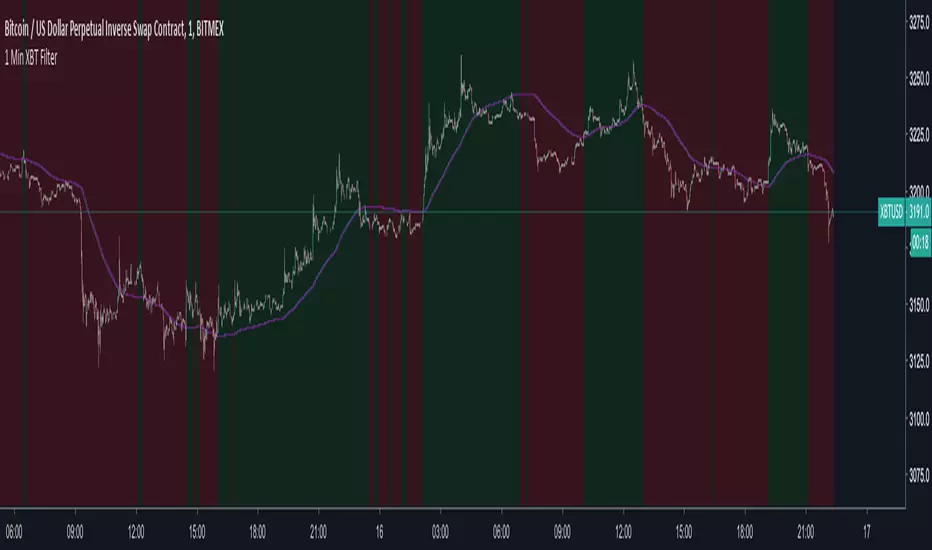
Volatility FilterOver the past few weeks (as of today, which is: 12th of October 2018) there has been little to no volatility in most of the major cryptocurrencies. What volatility does come in comes and goes very quickly. It's difficult to discern good and bad moments to be in a trade. As a result I decided to create a volatility filter based on Hurst exponent market phases, Bollinger Band width, moving averages, volume and the average true range. The results are the above.
You can use this indicator against any asset or within any market. It actually reaps excellent results against the DJI and XAUUSD One of my suggested uses for it is if you're scalping, only enter a position when there is volatility (when there's no background color present). If you're swinging, only enter a position when there's low volatility (when the red background color is present).
Another way to use it (although this isn't intended, just incidental) is to take a position in the direction of the first bar after the red background has gone/after low volatility has passed. So if we get a declining candle when we exit a low volatility zone, short. Otherwise long. This is the experimental side of it though.
However, this indicator won't tell you what direction to trade in, so in order to get use from it I suggest having a trend filter and a trigger. Luckily these two things are in most traders' arsenal. If not, take a look at my other script which is a timelessly brilliant trigger for buying and selling:
Something else to consider is that the volatility is relative. If we go through a period of incredibly high volatility then afterwards we can sometimes expect the volatility filter to plot a red background even though there is still acceptable volatility left in the market. The volatility at that point is much less than the volatility beforehand.
With all that said, this easy-to-read tool will help you avoid flat periods when scalping and, conversely, help you determine good times to enter a swing trade. For those who had difficulty trading the markets as of late due to volatility, this indicator is perfect for you
Access to the filter is provided for 10$, payable in most low-transaction-fee cryptocurrencies. Access is limited to 250 customers. For more information message me through TradingView or message @overttherainbow through Telegram.
Have a nice day and good luck trading.
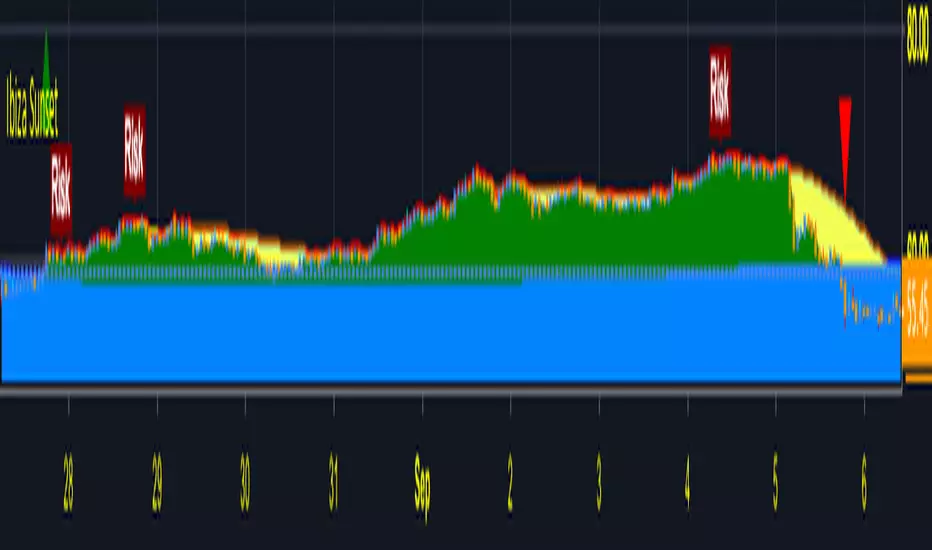
Ibiza SunsetIbiza Island as giving me so much on Holliday With my Ibiza Sunset Strategy. So i decide to share my Ibiza Island Sunset Script !!!
Over the year in ibiza i develop a strategy that has giving me much joy
Ibiza Sunset its a indicator that tells you when a coin its about to emerge from deep underwater .
1 - Ones u see a buy signal ( Green Triangle UP ) coming out from water Then u setup your Long Trade .
2 - Keep climbing the island until u start to see Risk signal (Middle Risk ) or Vertigo signal (Mayor Risk)
º This mean Sunset its about to come so u better be aware of the current situation.
4 - Ones u see the Sunset u can Sell or Short your Position .
º If after Sunset finish you are not underwater then u can buy back and keep uptrend with more coins .
Sit back and relax watching the Sunset making money in some nice part of this Beautiful World xD !
If u like to try the indicator please comment or send me pm !!
Tip: This is a very advanced, yet simple indicator. Take time to tweak the water level, flagpoles, and sunset settings to maximize profit. Watch the video for a tutorial.
Thank for your time and support
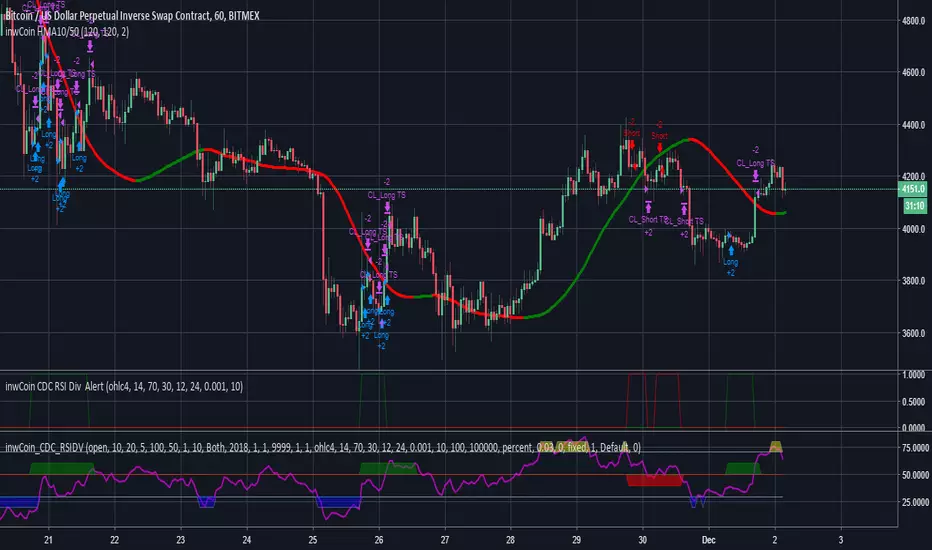
AnunakyAnunaky its our own Bitmex Strategy set to a indicator
Works only on XBTUSD with this settings but who need shit coins if u can leverage BTC 10X
Backtest its from 1 dic 2017 to 1 oct 2018 initial capital 1000$ 10x leverage
indicator will provide Perfect Short Setup and Perfect Long Setup ones you see a signal of short or long just setup your leverage and
sit back and enjoy !!!
Of course u need to have little knowledge about trading and what the indicator does
If u need to start learning or joing out trading group send me PM ! !
Wont give you much signals but the ones that shows you better take them !!
I have Release this indicator just for our Team of Traders
If u are interest in it and want to learn about trading and join out group send me msg
PEace ! !
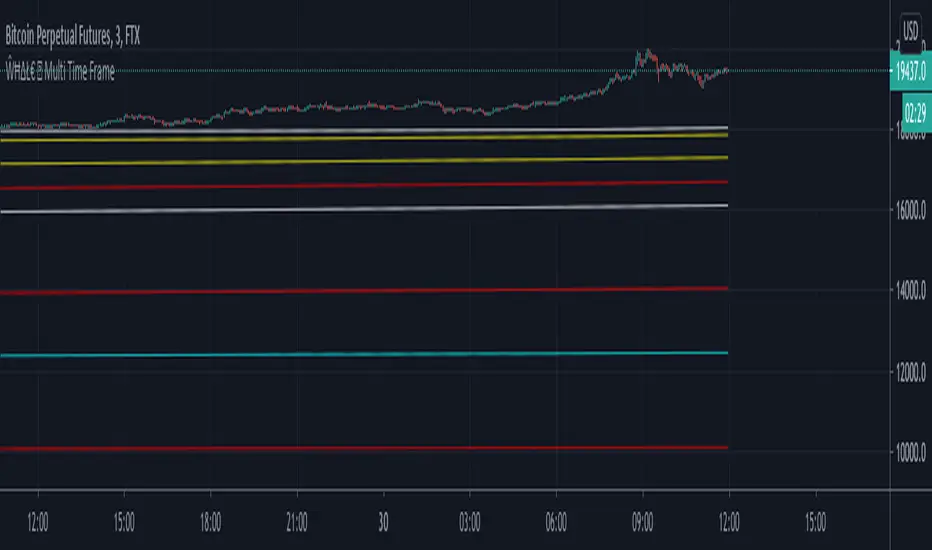
SSABU Bitcoin Long Short Line
✅ an indicator requested by acquiantance
This is an indicator that allows you to see Bitcoin chart with long and short at the same time.
Green line is long. Red line represents short
✅ 지인 요청지표
비트차트와 함께 롱, 숏 차트를 볼 수 있는 지표 입니다.
초록색이 Long 빨간색이 Short.
※ 기존의 차트에 대비하여 롱, 숏 차트의 선행적인 움직임을 통해서 비트의 움직임을 예상 하는 보조지표

Bitmex'd Trading Alerts /w TP and SLTrading Alerts for Bitmex, optimised for XBTUSD and ETHUSD
Added Stop-Loss and Take-Profit

.BXBT Bitcoin Price Index for BitMEX - Gyro.BXBT script as seen on the BitMEX built-in chart.
This is not created by, authorized by or in any type of affiliation with BitMEX whatsoever.
This is not financial advice. Use at your own risk.
Tips are appreciated if you find this useful:
BTC: 15BtFGxY8Q4jybcnpVAc3r8yJDyRrPre1n
LTC: LhR5LW8qQ5byZvYkUeRR4njBDTxtCZynuk
Thanks

VJ_Holy_Grail_ScalperA simple scalping indicator
Green triangle = Buy
Red triangle = Sell
Added buy/sell alerts for Autoview
