Bollinger Bands Breakout StrategyBollinger Bands Breakout Strategy is the strategy version of Bollinger Bands Filter study version, which can be found under my scripts page. The strategy goes long when price closes above the upper band and goes short signal when price closes below the lower band.
Bollinger Bands is a classic indicator that uses a simple moving average of 20 periods, along with plots of upper and lower bands that are 2 standard deviations away from the basis line. These bands help visualize price volatility and trend based on where the price is, in relation to the bands.
The strategy doesn't take into account any other parameters such as Volume / RSI / Fundamentals etc, so user must use discretion based on confirmations from another indicator or based on fundamentals. The strategy results are based on purely long and short trades and doesn't take into account any user defined targets or stop losses.
The strategy works great when the price closes above/below upper/lower bands with continuation on next bar. It is definitely useful to have this strategy or the Bollinger Bands filter along with other indicators to get early glimpse of breach/fail of bands on candle close during BB squeeze or based on volatility .
This can be used on Heikin Ashi candles for spotting trends, but HA candles are not recommended for trade entries as they don't reflect true price of the asset.
The strategy settings default is 55 SMA and 1 standard deviation for Bollinger Bands filter, but these can be changed from settings.
It is definitely worth reading the 22 rules of Bollinger Bands written by John Bollinger if interested in trading Bollinger Bands successfully.
Bollingersqueeze

EMA / Fibonacci / Bollinger Indicator for Market Sniper SuiteHello all,
this script was created to be used in conjunction with Market Sniper - Trading/Scalping Suite . It was put together to make instrument analysis faster and less convoluted.
It includes
9 Fibonacci Exponential moving averages + 2 Simple moving averages
Auto Fibonacci levels - Tradingviews Auto Fib Retracement - with some modifications
Bollinger Bands - To faster spot squeeze momentum


(JS) Bollinger Band Momentum Average Trailing StopsA tool I made to use alongside the Bollinger Band Momentum Average - fairly simple to use. It has the same settings as the BBMA so you can match them together.
If you prefer a wider stop than a close on the opposing side of the BBMA, this is for you.
The "stop" is triggered by a close on the other side of the stop line line turns red whenever the stop is triggered.
The calculation is simple:
The stop on the short side it is High - BBMA over the length of time you select to use (20 is default).
On the long side, it is BBMA - Low also over the preferred length of time you select to use.
Note: Just shorten the length to make a tighter stop.
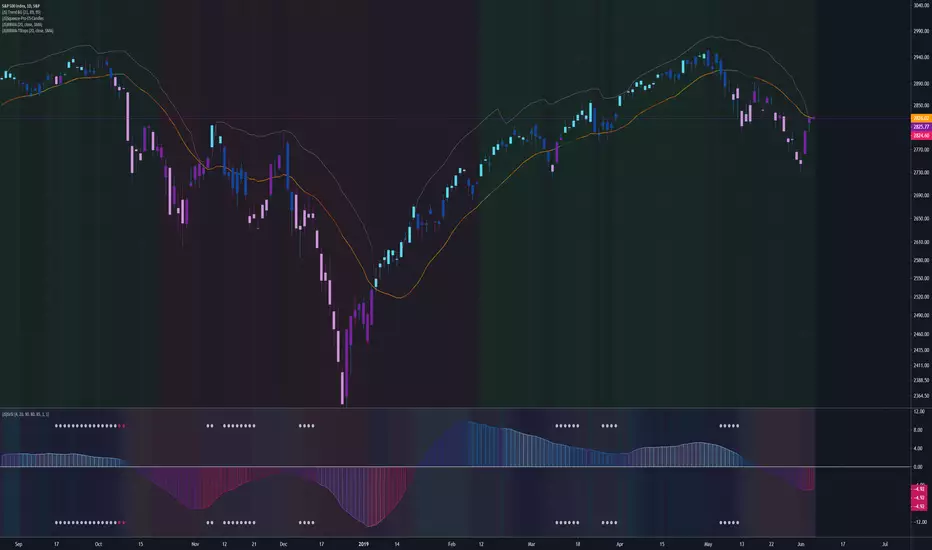
(JS) Bollinger Bands Momentum AverageSo this is something I've been using with my Squeeze system that I have found very useful (great addition especially if you use the Squeeze Arrows).
First thing I'd like to point out is that the default setting (20 SMA) is also the default for the Bollinger Bands basis line, so I recommend using the line set at the default.
First thing you'll notice is that whichever side of the line the candles close on, that basically determines the direction of the arrow for the Squeeze Arrows.
So this is extremely helpful in case momentum shifts after an arrow signal is given, if you see the price shoot to the other side of the line you can use that as a means of protection.
Second, the line is color coded in a way that I hope helps with entries and exits.
The colors of the line change based on two things:
1. If there is currently a squeeze.
2. Are the Bollinger Bands expanding or contracting.
Generally speaking, when the bands are contracting (light green and light orange default colors) this is the ideal time for entry before a trending move occurs.
Same thing on the flip side when they're expanding (dark green and dark orange default colors), that's usually the better time to exit.
Now what's the difference between orange and green?
Green = There's an ongoing squeeze
Orange = There's currently no squeeze
So playing the side of momentum when the line is light green and starts to break in a certain direction would be the ideal entry.
And, if momentum changes from that point, you can always use a close on the opposite side of the line as a stop (or an entry the other way).
This is something else I've been using on my own for a little while prior to publishing and it has been a tremendous tool for me. Hope it helps you all as much as it has me!
