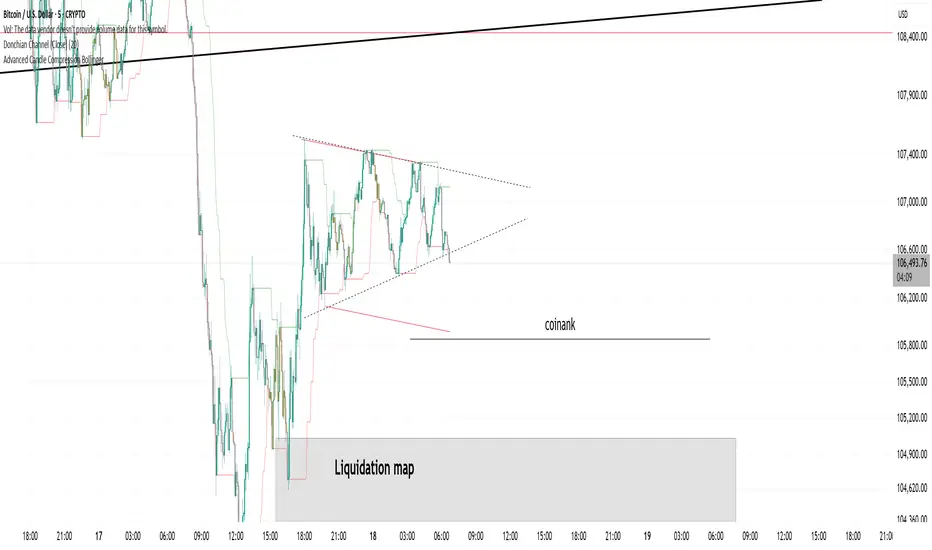
ICT PDA - Gold & BTC (QuickScalp Bias/FVG/OB/OTE + Alerts)What this script does
This indicator implements a complete ICT Price Delivery Algorithm (PDA) workflow tailored for XAUUSD and BTCUSD. It combines HTF bias, OTE zones, Fair Value Gaps, Order Blocks, micro-BOS confirmation, and liquidity references into a single, cohesive tool with early and final alerts. The script is not a mashup for cosmetic plotting; each component feeds the next decision step.
Why this is original/useful
Symbol-aware impulse filter: A dynamic displacement threshold kTune adapts to Gold/BTC volatility (body/ATR vs. per-symbol factor), reducing noise on fast markets without hiding signals.
Scalping preset: “Quick Clean” mode limits drawings to the most recent bars and keeps only the latest FVG/OB zones for a clear chart.
Three display modes: Full, Clean, and Signals-Only to match analysis vs. execution.
Actionable alerts: Early heads-up when price enters OTE in the HTF bias direction, and Final alerts once mitigation + micro-break confirm the setup.
How it works (high-level logic)
HTF Bias: Uses request.security() on a user-selected timeframe (e.g., 240m) and EMA filter. Bias = close above/below HTF EMA.
Dealing Range & OTE: Recent swing high/low (pivot length configurable) define the range; OTE (62–79%) boxes are drawn contextually for up/down ranges.
Displacement: A candle’s body/ATR must exceed kTune and break short-term structure (displacement up/down).
FVG: 3-bar imbalance (bull: low > high ; bear: high < low ). Latest gaps are tracked and extended.
Order Blocks: Last opposite candle prior to a qualifying displacement that breaks recent highs/lows; zones are drawn and extended.
Entry & Alerts:
Long: Bullish bias + price inside buy-OTE + mitigation of a bullish FVG or OB + micro BOS up → “PDA Long (Final)”.
Short: Bearish bias + price inside sell-OTE + mitigation of a bearish FVG or OB + micro BOS down → “PDA Short (Final)”.
Early Alerts: Trigger as soon as price enters OTE in the direction of the active bias.
Inputs & controls (key ones)
Bias (HTF): timeframe minutes, EMA length.
Structure: ATR length, Impulse Threshold (Body/ATR), swing pivot length, OB look-back.
OTE/FVG/OB/LP toggles: show/hide components.
Auto-Tune: per-symbol factors for Gold/BTC + manual tweak.
Display/Performance: View Mode, keep-N latest FVG/OB, limit drawings to last N bars.
Recommended usage (scalping)
Timeframes: Execute on M1–M5 with HTF bias from 120–240m.
Defaults (starting point): ATR=14, Impulse Threshold≈1.6; Gold factor≈1.05, BTC factor≈0.90; Keep FVG/OB=2; last 200–300 bars; View Mode=Clean.
Workflow: Wait for OTE in bias direction → see mitigation (FVG/OB) → confirm with micro BOS → manage risk to nearest liquidity (prev-day H/L or recent swing).
Alerts available
“PDA Early Long/Short”
“PDA Long (Final)” / “PDA Short (Final)”
Attach alerts on “Any alert() function call” or the listed conditions.
Chart & screenshots
Please include symbol and timeframe on screenshots. The on-chart HUD shows the script name and state to help reviewers understand context.
Limitations / notes
This is a discretionary framework. Signals can cluster during news or extreme volatility; use your own risk management. No guarantee of profitability.
Changelog (brief)
v1.2 QuickScalp: added Quick Clean preset, safer array handling, symbol-aware impulse tuning, display modes.
------------------------------
ملخص عربي:
المؤشر يطبق تسلسل PDA عملي للذهب والبتكوين: تحيز من فريم أعلى، مناطق OTE، فجوات FVG، بلوكات أوامر OB، وتأكيد micro-BOS، مع تنبيهات مبكرة ونهائية. تمت إضافة وضع “Quick Clean” لتقليل العناصر على الشارت وحساسية إزاحة تتكيّف مع الأصل. للاستخدام كسكالب: نفّذ على M1–M5 مع تحيز 120–240 دقيقة، وابدأ من الإعدادات المقترحة بالأعلى. هذا إطار سلوكي وليس توصية مالية.
Penunjuk Breadth

ORDER FLOW Professional & Delta LineThe ORDER FLOW Professional & Delta Line indicator provides a powerful visualization of buy and sell volume imbalances within each candle — offering traders a deeper view into market order flow dynamics.
Inspired by footprint charts, this tool estimates Up Volume, Down Volume, and their difference (Delta) to highlight whether buyers or sellers are in control. It’s designed for traders who want a clear and professional way to track volume-based momentum directly on their charts.
🔹 Key Features:
Accurate estimation of buy (Up) and sell (Down) volume per bar
Delta Line displaying the net order flow difference
Customizable delta color for personalized visualization
Optional numeric labels showing Up, Down, and Δ values
Footprint-style column display in a clean lower panel
Background color shading to reflect positive/negative delta
💡 Ideal For:
Professional traders and volume analysts seeking to confirm price action through order flow insights, detect absorption or exhaustion, and enhance decision-making with visual delta tracking.

Multi-Timeframe Stochastic (4x Konfiguracja + Schodki)Skrypt stoch z wielu TF można sobie ustawiać pod siebie.

Donchian Channel (Close)Donchian channel based on candle close. Allows you to avoid fake wicks and rely only on closing prices.
MFT Supply/Demand — Top2 (Opacity by Strength, Minimal Labels)Script Overview — “MFT Supply/Demand — Top 2 (Opacity by Strength, Minimal Labels)”
This multi–timeframe (MTF) Pine Script indicator automatically detects and displays the strongest supply and demand zones across selected higher (HTF), mid (MTF), and lower (LTF) timeframes.
It dynamically identifies large-body, high-volume candles (and optional order-block breakouts) that signal institutional activity, then plots only the two strongest supply zones above the current price and two strongest demand zones below the current price — keeping the chart clean and focused.

EMA Ribbon MozyMozy TRading
EMA Ribbons for short time frames on daily traders. Buy or sell during crosses

CMF, RSI, CCI, MACD, OBV, Fisher, Stoch RSI, ADX (+DI/-DI)Eight normalized indicators are used in conjunction with the CMF, CCI, MACD, and Stoch RSI indicators. You can track buy and sell decisions by tracking swings. The zero line is for reversal tracking at -20, +20, +50, and +80. You can use any of the nine indicators individually or in combination.

Buy & Sell Liquidity Swings (v5)cette indicateur permets de buy ou sell selon la tendance du marcher

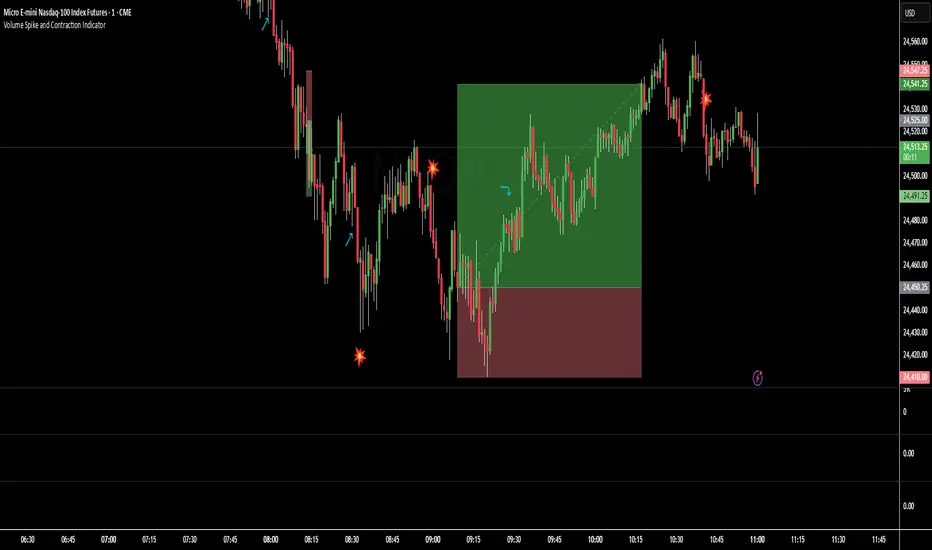
Volume Spike and Contraction IndicatorSimple script to map volume contractions and spikes with emojis and plots above or below depending on the flow of the signal


VietNguyen Buy/Sell VipThis is a indicator of Vietnammes. It is very good for you when trade Gold and Crypto

ALISH WEEK LABELS THE ALISH WEEK LABELS
Overview
This indicator programmatically delineates each trading week and encapsulates its realized price range in a live-updating, filled rectangle. A week is defined in America/Toronto time from Monday 00:00 to Friday 16:00. Weekly market open to market close, For every week, the script draws:
a vertical start line at the first bar of Monday 00:00,
a vertical end line at the first bar at/after Friday 16:00, and
a white, semi-transparent box whose top tracks the highest price and whose bottom tracks the lowest price observed between those two temporal boundaries.
The drawing is timeframe-agnostic (M1 → 1D): the box expands in real time while the week is open and freezes at the close boundary.
Time Reference and Session Boundaries
All scheduling decisions are computed with time functions called using the fixed timezone string "America/Toronto", ensuring correct behavior across DST transitions without relying on chart timezone. The start condition is met at the first bar where (dayofweek == Monday && hour == 0 && minute == 0); on higher timeframes where an exact 00:00 bar may not exist, a fallback checks for the first Monday bar using ta.change(dayofweek). The close condition is met on the first bar at or after Friday 16:00 (Toronto), which guarantees deterministic closure on intraday and higher timeframes.
State Model
The indicator maintains minimal persistent state using var globals:
week_open (bool): whether the current weekly session is active.
wk_hi / wk_lo (float): rolling extrema for the active week.
wk_box (box): the graphical rectangle spanning × .
wk_start_line and a transient wk_end_line (line): vertical delimiters at the week’s start and end.
Two dynamic arrays (boxes, vlines) store object handles to support bounded history and deterministic garbage collection.
Update Cycle (Per Bar)
On each bar the script executes the following pipeline:
Start Check: If no week is open and the start condition is satisfied, instantiate wk_box anchored at the current bar_index, prime wk_hi/wk_lo with the bar’s high/low, create the start line, and push both handles to their arrays.
Accrual (while week_open): Update wk_hi/wk_lo using math.max/min with current bar extremes. Propagate those values to the active wk_box via box.set_top/bottom and slide box.set_right to the current bar_index to keep the box flush with live price.
Close Check: If at/after Friday 16:00, finalize the week by freezing the right edge (box.set_right), drawing the end line, pushing its handle, and flipping week_open false.
Retention Pruning: Enforce a hard cap on historical elements by deleting the oldest objects when counts exceed configured limits.
Drawing Semantics
The range container is a filled white rectangle (bgcolor = color.new(color.white, 100 − opacity)), with a solid white border for clear contrast on dark or light themes. Start/end boundaries are full-height vertical white lines (y1=+1e10, y2=−1e10) to guarantee visibility across auto-scaled y-axes. This approach avoids reliance on price-dependent anchors for the lines and is robust to large volatility spikes.
Multi-Timeframe Behavior
Because session logic is driven by wall-clock time in the Toronto zone, the indicator remains consistent across chart resolutions. On coarse timeframes where an exact boundary bar might not exist, the script legally approximates by triggering on the first available bar within or immediately after the boundary (e.g., Friday 16:00 occurs between two 4-hour bars). The box therefore represents the true realized high/low of the bars present in that timeframe, which is the correct visual for that resolution.
Inputs and Defaults
Weeks to keep (show_weeks_back): integer, default 40. Controls retention of historical boxes/lines to avoid UI clutter and resource overhead.
Fill opacity (fill_opacity): integer 0–100, default 88. Controls how solid the white fill appears; border color is fixed pure white for crisp edges.
Time zone is intentionally fixed to "America/Toronto" to match the strategy definition and maintain consistent historical backtesting.
Performance and Limits
Objects are reused only within a week; upon closure, handles are stored and later purged when history limits are exceeded. The script sets generous but safe caps (max_boxes_count/max_lines_count) to accommodate 40 weeks while preserving Editor constraints. Per-bar work is O(1), and pruning loops are bounded by the configured history length, keeping runtime predictable on long histories.
Edge Cases and Guarantees
DST Transitions: Using a fixed IANA time zone ensures Friday 16:00 and Monday 00:00 boundaries shift correctly when DST changes in Toronto.
Weekend Gaps/Holidays: If the market lacks bars exactly at boundaries, the nearest subsequent bar triggers the start/close logic; range statistics still reflect observed prices.
Live vs Historical: During live sessions the box edge advances every bar; when replaying history or backtesting, the same rules apply deterministically.
Scope (Intentional Simplicity)
This tool is strictly a visual framing indicator. It does not compute labels, statistics, alerts, or extended S/R projections. Its single responsibility is to clearly present the week’s realized range in the Toronto session window so you can layer your own execution or analytics on top.

US30 Quarter Levels (125-point grid) by FxMogul🟦 US30 Quarter Levels — Trade the Index Like the Banks
Discover the Dow’s hidden rhythm.
This indicator reveals the institutional quarter levels that govern US30 — spaced every 125 points, e.g. 45125, 45250, 45375, 45500, 45625, 45750, 45875, 46000, and so on.
These are the liquidity magnets and reaction zones where smart money executes — now visualized directly on your chart.
💼 Why You Need It
See institutional precision: The Dow respects 125-point cycles — this tool exposes them.
Catch reversals before retail sees them: Every impulse and retracement begins at one of these zones.
Build confluence instantly: Perfectly aligns with your FVGs, OBs, and session highs/lows.
Trade like a professional: Turn chaos into structure, and randomness into rhythm.
⚙️ Key Features
Automatically plots US30 quarter levels (…125 / …250 / …375 / …500 / …625 / …750 / …875 / …000).
Color-coded hierarchy:
🟨 xx000 / xx500 → major institutional levels
⚪ xx250 / xx750 → medium-impact levels
⚫ xx125 / xx375 / xx625 / xx875 → intraday liquidity pockets
Customizable window size, label spacing, and line extensions.
Works across all timeframes — from 1-minute scalps to 4-hour macro swings.
Optimized for clean visualization with no clutter.
🎯 How to Use It
Identify liquidity sweeps: Smart money hunts stops at these quarter zones.
Align structure: Combine with session opens, order blocks, or FVGs.
Set precision entries & exits: Trade reaction-to-reaction with tight risk.
Plan daily bias: Watch how New York respects these 125-point increments.
🧭 Designed For
Scalpers, day traders, and swing traders who understand that US30 doesn’t move randomly — it moves rhythmically.
Perfect for traders using ICT, SMC, or liquidity-based frameworks.
⚡ Creator’s Note
“Every 125 points, the Dow breathes. Every 1000, it shifts direction.
Once you see the rhythm, you’ll never unsee it.”
— FxMogul

XAUUSD Quater Points by FxMogul🟡 XAUUSD Quarter Levels — The Smart Money Map for Gold Traders
Unlock the hidden grid behind Gold’s movement.
This indicator automatically maps the institutional quarter levels — every 25 points (…00 / …25 / …50 / …75) — showing you exactly where liquidity sits, smart money reacts, and price reverses.
💰 Why You’ll Love It
See what the banks see: Every major algorithm and institutional trader builds around psychological quarters — this script makes them visible.
Trade with precision: Entries, TPs, and liquidity sweeps align naturally with these levels.
Never chase price again: Know the next magnet before it happens — 3425, 3450, 3475, 3500... it’s all mapped.
Clean and customizable: No clutter, no noise — just structure and truth.
⚙️ Key Features
Automatic plotting of all 25-point grid levels around current price.
Color-coded hierarchy:
🟨 xx00 → high-impact institutional zones
⚪ xx50 → secondary liquidity magnets
⚫ xx25 / xx75 → intraday structure pivots
Adjustable window range, label spacing, and line extensions.
Works seamlessly across all timeframes.
🧭 How Traders Use It
Identify liquidity sweeps and reversal zones before they happen.
Align FVGs, order blocks, or fair value gaps with clean 25-point precision.
Build confluence with daily bias, CME gaps, or high-volume nodes.
Perfect for ICT, Smart Money, or Liquidity-Based traders.
🌍 Designed For
Scalpers. Swing Traders. Institutional thinkers.
Anyone who wants to trade Gold with the clarity of a market maker instead of the confusion of the crowd.
⚡ Creator’s Note
“Every 25 points, Gold breathes. Every 100, it shifts direction.
Learn to read its rhythm — and it will pay you for life.”
— FxMogul

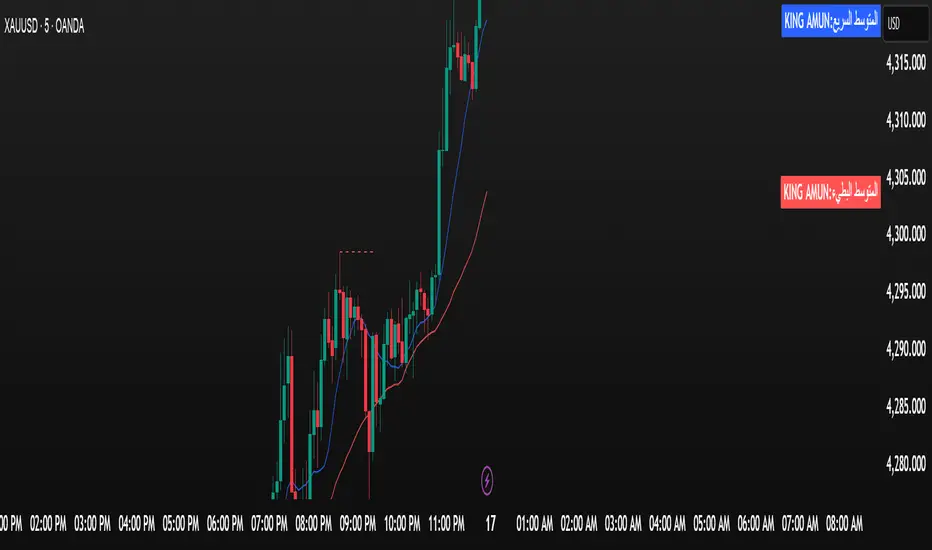
الملك أمون - King Amun2. Powerful Fundamental Indicators:
3 Moving Averages
RSI Indicator
Support and Resistance Levels
Buy/Sell Signals
Volume Indicator
3. Ease of Use:
Settings Organized into Groups
Possibility to Hide/Show Indicators
Clear and Distinctive Colors
4. Effective Trading Signals:
Average Crossovers
RSI Signals
Automatic Alerts
🚀 How to Use
Colored RSI with Timeframe OptionHello Traders, I have created a RSI indicator when value moves up the color is Green and when value moves down color is Red.

SEVENX Free|SuperFundedSEVENX — Modular Multi-Signal Scanner (SuperFunded)
What it is
SEVENX combines seven classic signals—MACD, OBV, RSI, Stochastics, CCI, Momentum, and an optional ATR volatility filter—into a modular gate. You can toggle each condition on/off, and a BUY/SELL arrow prints only when all enabled conditions agree. Text labels are optional.
Why this is not a simple mashup
・Most “combo” scripts just overlay indicators. SEVENX is a strict consensus engine:
・Each condition is binary and user-switchable.
・The final signal is the logical AND of all enabled checks (no hidden weights).
・Signals fire only on confirmed events (e.g., RSI crossing a level, Stoch K/D cross), which makes entries rule-driven and reproducible.
This yields a transparent, vendor-grade workflow where traders can start simple (2–3 gates) and tighten selectivity by enabling more gates.
How it works (concise)
・MACD: macd_line > signal_line (buy) / < (sell).
・OBV trend: OBV > OBV_MA (buy) / < (sell).
・RSI bounce/drop: crossover(RSI, Oversold) (buy) / crossunder(RSI, Overbought) (sell).
・Stoch cross: %K crosses above %D (buy) / below (sell).
・CCI rebound/pullback: crossover(CCI, -Level) (buy) / crossunder(CCI, +Level) (sell).
・Momentum: Momentum > 0 (buy) / < 0 (sell).
・ATR filter (optional): ATR > ATR_MA must also be true (both sides).
・Final signal: AND of all enabled conditions. If you enable none on a side, that side will not print.
Parameters (UI mapping)
Buy Signal (group: “— Buy Signal —”)
・MACD Golden Cross / OBV Uptrend / RSI Bounce from Oversold / Stochastic Golden Cross / CCI Rebound from Oversold / Momentum > 0 / ATR Volatility Filter (on/off)
Sell Signal (group: “— Sell Signal —”)
・MACD Dead Cross / OBV Downtrend / RSI Drop from Overbought / Stochastic Dead Cross / CCI Pullback from Overbought / Momentum < 0 / ATR Volatility Filter (on/off)
Indicator Settings
・MACD: Fast/Slow/Signal lengths.
・RSI: Length, Overbought/Oversold levels.
・Stochastics: %K length, %D smoothing, overall smoothing.
・CCI: Length, Level (±Level used).
・Momentum: Length.
・OBV: MA length for trend baseline.
・ATR: ATR length, ATR MA length (for the filter).
Display
・Show Text (BUY/SELL text on the markers), Buy/Sell Text Colors.
Practical usage
・Start simple: Enable 2 conditions (e.g., MACD + RSI). If signals are too frequent, add OBV or Momentum; if still frequent, enable ATR filter.
・Mean-reversion vs trend:
・For trend-following, prefer MACD/OBV/Momentum gates.
・For reversal bounces, add RSI/CCI gates and keep Stoch for timing.
・Tuning sensitivity:
・Raise RSI Oversold/Overbought thresholds to make bounces rarer.
・Increase ATR_MA length to smooth the volatility baseline.
・Risk first: Plan SL/TP independently (e.g., structure levels or R-multiples). SEVENX focuses on entry qualification, not exits.
Repainting & confirmation
Signals depend on cross events and are best treated on bar close. Intrabar flips can occur before a bar closes; for strict rules, confirm on closed bars in your strategy.
Disclaimer
No indicator can guarantee outcomes. News, liquidity, and spread conditions can invalidate signals. Trade responsibly and manage risk.
This indicator is being released on a trial basis and may be discontinued at our discretion.
SEVENX — モジュラー型マルチシグナル・スキャナー(日本語)
概要
SEVENXは、MACD / OBV / RSI / ストキャス / CCI / モメンタム / ATRフィルターの7条件を個別オン・オフで制御し、有効化した条件がすべて満たされたときだけBUY/SELL矢印を表示する、合意(AND)型シグナルインジです。テキスト表示も任意。
独自性・新規性
・各条件はブラックボックスではなく明示的なブール判定で、最終シグナルは有効化した条件のAND。
・RSIのレベルクロスやStochのK/Dクロスなど、確定イベントで判定するため、再現性の高いルール運用が可能。少数条件から始めて、必要に応じて段階的に厳格化できます。
動作要点
・MACD:線がシグナル上/下。
・OBV:OBVがOBVのMAより上/下。
・RSI:RSIがOSを上抜け(買い)/OBを下抜け(売り)。
・Stoch:%Kが%Dを上抜け/下抜け。
・CCI:CCIが**−Levelを上抜け**(買い)/+Levelを下抜け(売り)。
・Momentum:0より上/下。
・ATRフィルター(任意):ATR > ATR_MA を満たすこと(買い/売り共通)。
・最終サイン:有効化した条件のAND。そのサイドで1つも有効化していなければサインは出ません。
実践ヒント
・まずは2条件(例:MACD+RSI)でテスト → 多すぎるならOBV/MomentumやATRフィルターを追加。
・トレンド重視:MACD/OBV/Momentumを主軸に。
・押し目・戻り目狙い:RSI/CCIを追加、Stochでタイミング調整。
・感度調整:RSIのOB/OSを広げる、ATR_MAを長くする等で厳しめに。
・出口は別設計:SL/TPは価格帯やR倍数などで管理を。
再描画と確定
確定足基準で判断すると安定します。足確定前はクロスが行き来することがあります。
免責
シグナルの機能は保証されません。イベントや流動性で無効化する場合があります。資金管理のうえ自己責任でご利用ください。
このインジケーターは試験公開のため、弊社の裁量で公開を停止する場合があります。

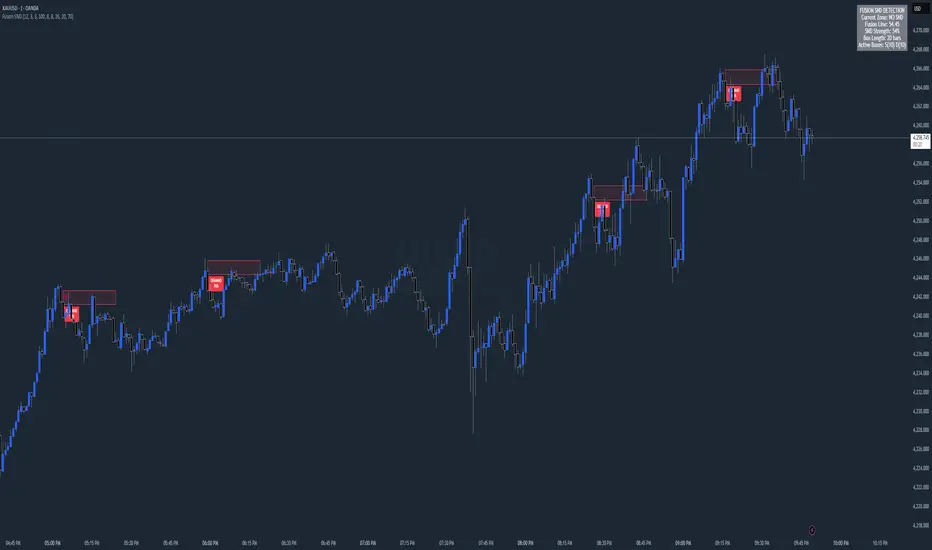
Chart Fusion Line SND Detection by TitikSona🧭 Overview
Fusion Line Momentum Analyzer is a momentum visualization tool that introduces a unified model of oscillator fusion.
It blends Fast and Slow Stochastics with RSI into one adaptive curve, designed to eliminate conflicting signals between different momentum sources.
Instead of reading three separate oscillators, the Fusion Line provides a consolidated view of strength and exhaustion zones in a single framework.
This approach helps analysts detect aligned momentum shifts with greater clarity and less noise, without repainting or lagging methods.
⚙️ Core Concept
Traditional oscillators often provide conflicting readings when volatility changes.
To solve this, the Fusion Line averages three normalized components:
Fast Stochastic (12,3,3) — reacts quickly to short-term momentum spikes.
Slow Stochastic (100,8,8) — filters long-term momentum context.
RSI (26) — measures internal strength between buying and selling pressure.
Each is rescaled to a 0–100 range, then averaged into a single curve called the Fusion Line.
A secondary Signal Line (SMA 9) is added to visualize directional confirmation.
This combination aims to preserve responsiveness from the fast components while maintaining structural stability from the slow and RSI layers.
🌈 Features
Unified momentum curve combining stochastic and RSI dynamics.
Automatic bias shading to highlight dominant trend direction.
Real-time percentage strength meter (visual intensity).
Configurable alert triggers on key momentum zones (20/80).
Clean chart display without unnecessary elements or overlays.
📘 Interpretation
Rising Fusion Line → indicates strengthening bullish momentum.
Falling Fusion Line → indicates strengthening bearish pressure.
Fusion values below 20 → potential oversold recovery.
Fusion values above 80 → possible exhaustion or reversal zone.
Mid-zone movement → reflects equilibrium or sideways momentum.
These readings should always be combined with higher timeframe structure or volume confirmation for context.
⚙️ Default Parameters
Fast Stochastic (12,3,3)
Slow Stochastic (100,8,8)
RSI Length (26)
Signal Line Smoothing (9)
All values can be adjusted to adapt to asset volatility or timeframe conditions.
⚠️ Disclaimer
This indicator is a research and visualization tool, not a signal generator.
It does not predict price movement or guarantee performance.
Use for analytical purposes only and combine with your own trading framework.
👨💻 Developer
Created by TitikSona — Research & Fusion Concept Designer
Built using Pine Script v6
Type: Open-source educational script
💬 Short Description
Fusion-based momentum visualization combining Double Stochastic and RSI into one adaptive line for clearer, noise-free momentum analysis.
QUANTUM MOMENTUMOverview
Quantum Momentum is a sophisticated technical analysis tool designed to help traders identify relative strength between assets through advanced momentum comparison. This cyberpunk-themed indicator visualizes momentum dynamics between your current trading symbol and any comparison asset of your choice, making it ideal for pairs trading, crypto correlation analysis, and multi-asset portfolio management.
Key Features
📊 Multi-Asset Momentum Comparison
Dual Symbol Analysis: Compare momentum between your chart symbol and any other tradable asset
Real-Time Tracking: Monitor relative momentum strength as market conditions evolve
Difference Visualization: Clear histogram display showing which asset has stronger momentum
🎯 Multiple Momentum Calculation Methods
Choose from four different momentum calculation types:
ROC (Rate of Change): Traditional percentage-based momentum measurement
RSI (Relative Strength Index): Oscillator-based momentum from 0-100 range
Percent Change: Simple percentage change over the lookback period
Raw Change: Absolute price change in native currency units
📈 Advanced Trend Filtering System
Enable optional trend filters to align momentum signals with prevailing market direction:
SMA (Simple Moving Average): Classic trend identification
EMA (Exponential Moving Average): Responsive trend detection
Price Action: Identifies trends through higher highs/lows or lower highs/lows patterns
ADX (Average Directional Index): Measures trend strength with customizable threshold
🎨 Futuristic Cyberpunk Design
Neon Color Scheme: Eye-catching cyan, magenta, and matrix green color palette
Glowing Visual Effects: Enhanced visibility with luminescent plot lines
Dynamic Background Shading: Subtle trend state visualization
Real-Time Data Table: Sleek information panel displaying current momentum values and trend status
How It Works
The indicator calculates momentum for both your current chart symbol and a comparison symbol (default: BTC/USDT) using your selected method and lookback period. The difference between these momentum values reveals which asset is exhibiting stronger momentum at any given time.
Positive Difference (Green): Your chart symbol has stronger momentum than the comparison asset
Negative Difference (Pink/Red): The comparison asset has stronger momentum than your chart symbol
When the trend filter is enabled, the indicator will only display signals that align with the detected market trend, helping filter out counter-trend noise.
Settings Guide
Symbol Settings
Compare Symbol: Choose any tradable asset to compare against (e.g., major indices, cryptocurrencies, forex pairs)
Momentum Settings
Momentum Length: Lookback period for momentum calculations (default: 14 bars)
Momentum Type: Select your preferred momentum calculation method
Display Options
Toggle visibility of current symbol momentum line
Toggle visibility of comparison symbol momentum line
Toggle visibility of momentum difference histogram
Optional zero line reference
Trend Filter Settings
Use Trend Filter: Enable/disable trend-based signal filtering
Trend Method: Choose from SMA, EMA, Price Action, or ADX
Trend Length: Period for trend calculations (default: 50)
ADX Threshold: Minimum ADX value to confirm trend strength (default: 25)
Best Use Cases
✅ Pairs Trading: Identify divergences in momentum between correlated assets
✅ Crypto Market Analysis: Compare altcoin momentum against Bitcoin or Ethereum
✅ Stock Market Rotation: Track sector or index relative strength
✅ Forex Strength Analysis: Monitor currency pair momentum relationships
✅ Multi-Timeframe Confirmation: Use alongside other indicators for confluence
✅ Mean Reversion Strategies: Spot extreme momentum divergences for potential reversals
Visual Indicators
⚡ Cyan Line: Your chart symbol's momentum
⚡ Magenta Line: Comparison symbol's momentum
📊 Green/Pink Histogram: Momentum difference (positive = green, negative = pink)
▲ Green Triangle: Bullish trend detected (when filter enabled)
▼ Red Triangle: Bearish trend detected (when filter enabled)
◈ Yellow Diamond: Neutral/sideways trend (when filter enabled)
Pro Tips
💡 Look for crossovers between the momentum lines as potential trade signals
💡 Combine with volume analysis for stronger confirmation
💡 Use momentum divergence (price making new highs/lows while momentum doesn't) for reversal signals
💡 Enable trend filter during ranging markets to reduce false signals
💡 Experiment with different momentum types to find what works best for your trading style
Technical Requirements
TradingView Pine Script Version: v6
Chart Type: Works on all chart types
Indicator Placement: Separate pane (overlay=false)
Data Requirements: Needs access to comparison symbol data

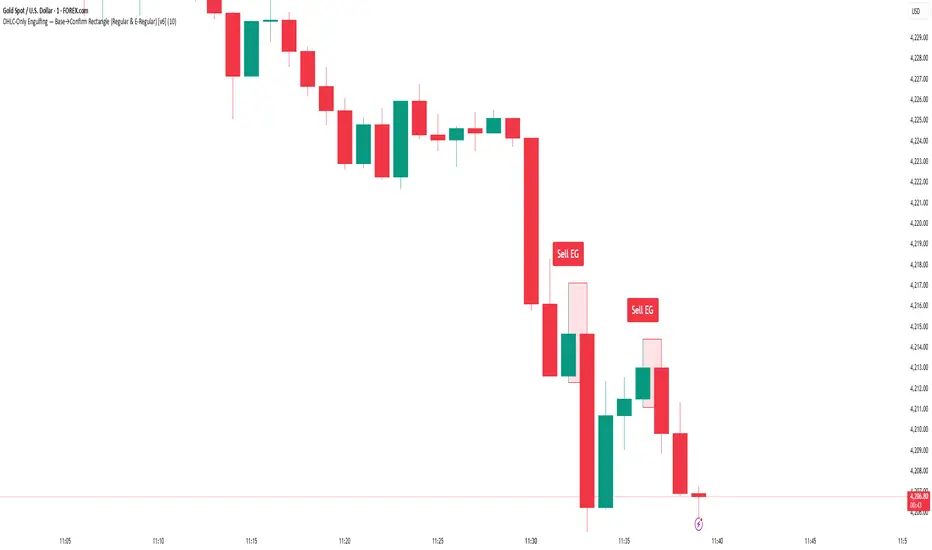
Engulfing Detector [HASIB]Description:
Engulfing Detector is a clean and powerful candlestick pattern indicator designed to automatically detect Bullish and Bearish Engulfing setups on any chart and any timeframe.
This tool helps traders easily spot reversal zones and potential trend continuation entries by highlighting high-probability engulfing candles with clear visual signals.
🔹 Features:
Detects both Bullish and Bearish Engulfing patterns in real time
Works on all timeframes and all assets (Forex, Crypto, Stocks, Indices)
Customizable color alerts for bullish and bearish signals
Lightweight, fast, and optimized for smooth performance
Perfect for price action traders and candlestick strategy lovers
📈 Created with precision and simplicity by Hasib, for traders who love clarity and confidence in their charts.

True Single Line Fusion [by TitikSona]🧠 Full Description
True Single Line Fusion by TitikSona is an open-source oscillator that unifies Fast Stochastic, Slow Stochastic, and RSI into a single smooth momentum line.
It simplifies multi-oscillator analysis into one clear visual — helping traders recognize potential momentum shifts, exhaustion, and reversal zones.
⚙️ Core Logic
The indicator calculates:
Fast Stochastic (12,3,3) → short-term swing sensitivity
Slow Stochastic (100,8,8) → broad trend context
RSI (26) → overall strength and directional bias
All three are normalized (0–100) and averaged to form the Fusion Line, creating a single unified momentum curve.
A Signal Line (SMA-9) and Histogram are added to highlight short-term acceleration or deceleration.
Formula: Fusion = (FastK + SlowK + RSI) / 3
🔍 Interpretation
Fusion Line rising → momentum strengthening upward
Fusion Line falling → momentum weakening
Histogram color (green/red) shows the direction and intensity of the move
Background highlights identify potential extremes:
🟩 Green = potential oversold region
🟥 Red = potential overbought region
💡 How to Use
Works on any symbol and timeframe.
Use the Fusion Line’s direction and slope as momentum context, not as direct buy/sell signals.
Combine with price structure, support/resistance, or volume analysis to confirm potential reversals.
Example:
Fusion Line turning upward from green zone → possible bullish momentum shift
Fusion Line turning downward from red zone → possible bearish exhaustion
📘 Notes
Ideal for identifying turning points in ranging or consolidating markets.
Does not generate automated signals or predictions.
Open-source for learning, modification, and educational use.
Designed for clarity, low lag, and clean visualization.
🧩 Developed and shared by TitikSona — made to unify oscillators into one adaptive momentum tool.
