Monthly DividerThis Trading View indicator visually marks the beginning of each month starting from January 2024. It draws vertical lines on the chart at the start of each month and labels them with the corresponding month abbreviation (e.g., "Jan", "Feb"). Users can customize the color and thickness of the lines through the indicator settings, allowing for personalized chart aesthetics. This tool is ideal for traders and analysts who want to easily identify month transitions and enhance their technical analysis.
Penunjuk Breadth

Quarterly Divider The "Quarterly Divider" script draws vertical lines at the start of each quarter (January, April, July, October) on the Trading View chart. It also labels each line with the corresponding quarter (Q1, Q2, Q3, Q4) at the bottom of the line, making it easy to visualize the start of each trading quarter. The color and thickness of the lines are customizable
NB. works effectively is used on the weekly timeframe

SPY/TLT Strategy█ STRATEGY OVERVIEW
The "SPY/TLT Strategy" is a trend-following crossover strategy designed to trade the relationship between TLT and its Simple Moving Average (SMA). The default configuration uses TLT (iShares 20+ Year Treasury Bond ETF) with a 20-period SMA, entering long positions on bullish crossovers and exiting on bearish crossunders. **This strategy is NOT optimized and performs best in trending markets.**
█ KEY FEATURES
SMA Crossover System: Uses price/SMA relationship for signal generation (Default: 20-period)
Dynamic Time Window: Configurable backtesting period (Default: 2014-2099)
Equity-Based Position Sizing: Default 100% equity allocation per trade
Real-Time Visual Feedback: Price/SMA plot with trend-state background coloring
Event-Driven Execution: Processes orders at bar close for accurate backtesting
█ SIGNAL GENERATION
1. LONG ENTRY CONDITION
TLT closing price crosses ABOVE SMA
Occurs within specified time window
Generates market order at next bar open
2. EXIT CONDITION
TLT closing price crosses BELOW SMA
Closes all open positions immediately
█ ADDITIONAL SETTINGS
SMA Period: Simple Moving Average length (Default: 20)
Start Time and End Time: The time window for trade execution (Default: 1 Jan 2014 - 1 Jan 2099)
Security Symbol: Ticker for analysis (Default: TLT)
█ PERFORMANCE OVERVIEW
Ideal Market Conditions: Strong trending environments
Potential Drawbacks: Whipsaws in range-bound markets
Backtesting results should be analyzed to optimize the MA Period and EMA Filter settings for specific instruments

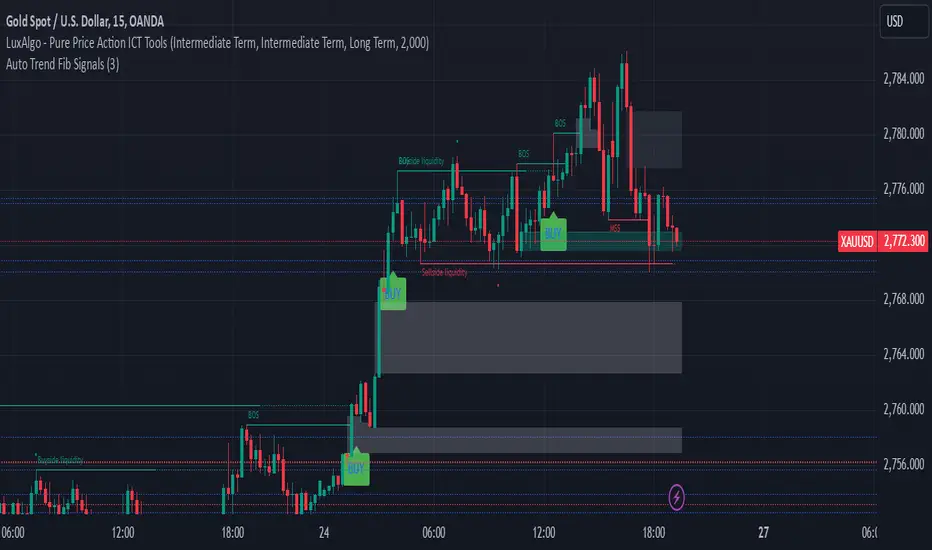
Auto Trend Fib Signals BY studio DivinKey Features
Dynamic SL using ATR volatility measure
Two-Tier Profit Taking for partial/full exits
Automatic Level Calculation based on Fibonacci extensions
Clear Visual Labels with exact price levels
Consistent Risk Management (1.5-2% per trade)
Optimization Table
Parameter Scalping Day Trading Swing Trading
ATR Multiplier 1.0 1.5 2.0
TP1 (1.272) 70% Position 50% Position 30% Position
TP2 (1.618) 30% Position 50% Position 70% Position
Time Frame 15-min 1-hour 4-hour
Pro Tips
Confirm with Volume: Increase volume at Fib levels improves signal reliability
Adjust in Ranging Markets: Use tighter SL (1.0x ATR) during consolidation
Trailing Stop: Move SL to breakeven at TP1 hit
Session Timing: Trade during London/NY overlap for best volatility
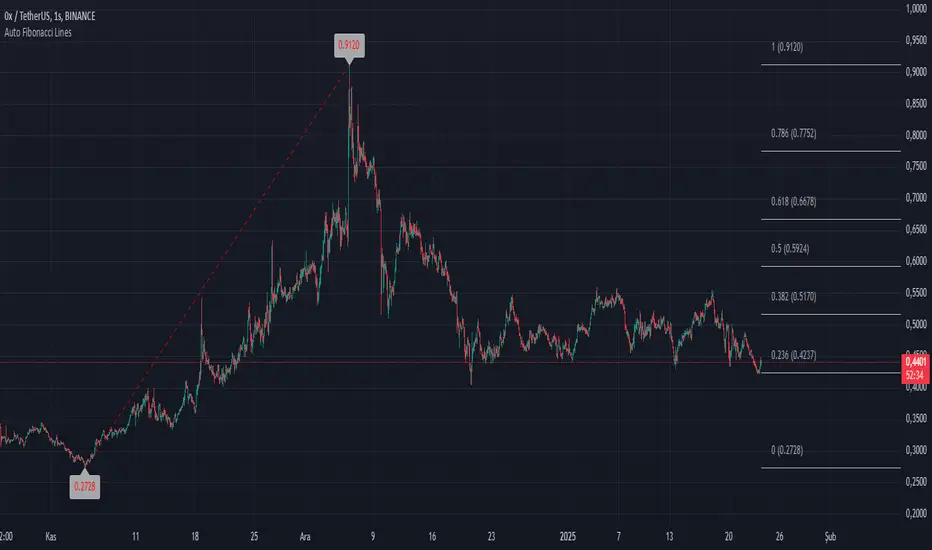
Auto Fibonacci LinesThis TradingView script is a modded version of the library called "VisibleChart" created by Pinecoder.
This version has the option for users to change the Fibonacci lines and price labels. This makes the script user-friendly.
Fibonacci extensions are a tool that traders can use to establish profit targets or estimate how far a price may travel after a retracement/pullback is finished. Extension levels are also possible areas where the price may reverse. This study automatically draws horizontal lines that are used to determine possible support and resistance levels.
It's designed to automatically plot Fibonacci retracement levels on chart, aiding in technical analysis for traders.
First, the highest and lowest bars on the chart are calculated. These values are used for Fibonacci extensions.
These values update as traders scroll or zoom their charts, this shows that it is a useful indicator that can dynamically calculate and draw visuals on visible bars only.
3 Down, 3 Up Strategy█ STRATEGY DESCRIPTION
The "3 Down, 3 Up Strategy" is a mean-reversion strategy designed to capitalize on short-term price reversals. It enters a long position after consecutive bearish closes and exits after consecutive bullish closes. This strategy is NOT optimized and can be used on any timeframes.
█ WHAT ARE CONSECUTIVE DOWN/UP CLOSES?
- Consecutive Down Closes: A sequence of trading bars where each close is lower than the previous close.
- Consecutive Up Closes: A sequence of trading bars where each close is higher than the previous close.
█ SIGNAL GENERATION
1. LONG ENTRY
A Buy Signal is triggered when:
The price closes lower than the previous close for Consecutive Down Closes for Entry (default: 3) consecutive bars.
The signal occurs within the specified time window (between Start Time and End Time).
If enabled, the close price must also be above the 200-period EMA (Exponential Moving Average).
2. EXIT CONDITION
A Sell Signal is generated when the price closes higher than the previous close for Consecutive Up Closes for Exit (default: 3) consecutive bars.
█ ADDITIONAL SETTINGS
Consecutive Down Closes for Entry: Number of consecutive lower closes required to trigger a buy. Default = 3.
Consecutive Up Closes for Exit: Number of consecutive higher closes required to exit. Default = 3.
EMA Filter: Optional 200-period EMA filter to confirm long entries in bullish trends. Default = disabled.
Start Time and End Time: Restrict trading to specific dates (default: 2014-2099).
█ PERFORMANCE OVERVIEW
Designed for volatile markets with frequent short-term reversals.
Performs best when price oscillates between clear support/resistance levels.
The EMA filter improves reliability in trending markets but may reduce trade frequency.
Backtest to optimize consecutive close thresholds and EMA period for specific instruments.

Buy on 5 day low Strategy█ STRATEGY DESCRIPTION
The "Buy on 5 Day Low Strategy" is a mean-reversion strategy designed to identify potential buying opportunities when the price drops below the lowest low of the previous five days. It enters a long position when specific conditions are met and exits when the price exceeds the high of the previous day. This strategy is optimized for use on daily or higher timeframes.
█ WHAT IS THE 5-DAY LOW?
The 5-Day Low is the lowest price observed over the last five days. This level is used as a reference to identify potential oversold conditions and reversal points.
█ SIGNAL GENERATION
1. LONG ENTRY
A Buy Signal is triggered when:
The close price is below the lowest low of the previous five days (`close < _lowest `).
The signal occurs within the specified time window (between `Start Time` and `End Time`).
2. EXIT CONDITION
A Sell Signal is generated when the current closing price exceeds the high of the previous day (`close > high `). This indicates that the price has shown strength, potentially confirming the reversal and prompting the strategy to exit the position.
█ ADDITIONAL SETTINGS
Start Time and End Time: The time window during which the strategy is allowed to execute trades.
█ PERFORMANCE OVERVIEW
This strategy is designed for mean-reverting markets and performs best when the price frequently oscillates around key support levels.
It is sensitive to oversold conditions, as indicated by the 5-Day Low, and overbought conditions, as indicated by the previous day's high.
Backtesting results should be analyzed to optimize the strategy for specific instruments and market conditions.

3-Bar Low Strategy█ STRATEGY DESCRIPTION
The "3-Bar Low Strategy" is a mean-reversion strategy designed to identify potential buying opportunities when the price drops below the lowest low of the previous three bars. It enters a long position when specific conditions are met and exits when the price exceeds the highest high of the previous seven bars. This strategy is suitable for use on various timeframes.
█ WHAT IS THE 3-BAR LOW?
The 3-Bar Low is the lowest price observed over the last three bars. This level is used as a reference to identify potential oversold conditions and reversal points.
█ WHAT IS THE 7-BAR HIGH?
The 7-Bar High is the highest price observed over the last seven bars. This level is used as a reference to identify potential overbought conditions and exit points.
█ SIGNAL GENERATION
1. LONG ENTRY
A Buy Signal is triggered when:
The close price is below the lowest low of the previous three bars (`close < _lowest `).
The signal occurs within the specified time window (between `Start Time` and `End Time`).
If the EMA Filter is enabled, the close price must also be above the 200-period Exponential Moving Average (EMA).
2. EXIT CONDITION
A Sell Signal is generated when the current closing price exceeds the highest high of the previous seven bars (`close > _highest `). This indicates that the price has shown strength, potentially confirming the reversal and prompting the strategy to exit the position.
█ ADDITIONAL SETTINGS
MA Period: The lookback period for the 200-period EMA used in the EMA Filter. Default is 200.
Use EMA Filter: Enables or disables the EMA Filter for long entries. Default is disabled.
Start Time and End Time: The time window during which the strategy is allowed to execute trades.
█ PERFORMANCE OVERVIEW
This strategy is designed for mean-reverting markets and performs best when the price frequently oscillates around key support and resistance levels.
It is sensitive to oversold conditions, as indicated by the 3-Bar Low, and overbought conditions, as indicated by the 7-Bar High.
Backtesting results should be analyzed to optimize the MA Period and EMA Filter settings for specific instruments.

Bollinger Bands Reversal + IBS Strategy█ STRATEGY DESCRIPTION
The "Bollinger Bands Reversal Strategy" is a mean-reversion strategy designed to identify potential buying opportunities when the price deviates below the lower Bollinger Band and the Internal Bar Strength (IBS) indicates oversold conditions. It enters a long position when specific conditions are met and exits when the IBS indicates overbought conditions. This strategy is suitable for use on various timeframes.
█ WHAT ARE BOLLINGER BANDS?
Bollinger Bands consist of three lines:
- **Basis**: A Simple Moving Average (SMA) of the price over a specified period.
- **Upper Band**: The basis plus a multiple of the standard deviation of the price.
- **Lower Band**: The basis minus a multiple of the standard deviation of the price.
Bollinger Bands help identify periods of high volatility and potential reversal points.
█ WHAT IS INTERNAL BAR STRENGTH (IBS)?
Internal Bar Strength (IBS) is a measure of where the closing price is relative to the high and low of the bar. It is calculated as:
IBS = (Close - Low) / (High - Low)
A low IBS value (e.g., below 0.2) indicates that the close is near the low of the bar, suggesting oversold conditions. A high IBS value (e.g., above 0.8) indicates that the close is near the high of the bar, suggesting overbought conditions.
█ SIGNAL GENERATION
1. LONG ENTRY
A Buy Signal is triggered when:
The IBS value is below 0.2, indicating oversold conditions.
The close price is below the lower Bollinger Band.
The signal occurs within the specified time window (between `Start Time` and `End Time`).
2. EXIT CONDITION
A Sell Signal is generated when the IBS value exceeds 0.8, indicating overbought conditions. This prompts the strategy to exit the position.
█ ADDITIONAL SETTINGS
Length: The lookback period for calculating the Bollinger Bands. Default is 20.
Multiplier: The number of standard deviations used to calculate the upper and lower Bollinger Bands. Default is 2.0.
Start Time and End Time: The time window during which the strategy is allowed to execute trades.
█ PERFORMANCE OVERVIEW
This strategy is designed for mean-reverting markets and performs best when the price frequently deviates from the Bollinger Bands.
It is sensitive to oversold and overbought conditions, as indicated by the IBS, which helps to identify potential reversals.
Backtesting results should be analyzed to optimize the Length and Multiplier parameters for specific instruments.

Average High-Low Range + IBS Reversal Strategy█ STRATEGY DESCRIPTION
The "Average High-Low Range + IBS Reversal Strategy" is a mean-reversion strategy designed to identify potential buying opportunities when the price deviates significantly from its average high-low range and the Internal Bar Strength (IBS) indicates oversold conditions. It enters a long position when specific conditions are met and exits when the price shows strength by exceeding the previous bar's high. This strategy is suitable for use on various timeframes.
█ WHAT IS THE AVERAGE HIGH-LOW RANGE?
The Average High-Low Range is calculated as the Simple Moving Average (SMA) of the difference between the high and low prices over a specified period. It helps identify periods of increased volatility and potential reversal points.
█ WHAT IS INTERNAL BAR STRENGTH (IBS)?
Internal Bar Strength (IBS) is a measure of where the closing price is relative to the high and low of the bar. It is calculated as:
IBS = (Close - Low) / (High - Low)
A low IBS value (e.g., below 0.2) indicates that the close is near the low of the bar, suggesting oversold conditions.
█ SIGNAL GENERATION
1. LONG ENTRY
A Buy Signal is triggered when:
The close price has been below the buy threshold (calculated as `upper - (2.5 * hl_avg)`) for a specified number of consecutive bars (`bars_below_threshold`).
The IBS value is below the specified buy threshold (`ibs_buy_treshold`).
The signal occurs within the specified time window (between `Start Time` and `End Time`).
2. EXIT CONDITION
A Sell Signal is generated when the current closing price exceeds the high of the previous bar (`close > high `). This indicates that the price has shown strength, potentially confirming the reversal and prompting the strategy to exit the position.
█ ADDITIONAL SETTINGS
Length: The lookback period for calculating the average high-low range. Default is 20.
Bars Below Threshold: The number of consecutive bars the price must remain below the buy threshold to trigger a Buy Signal. Default is 2.
IBS Buy Threshold: The IBS value below which a Buy Signal is triggered. Default is 0.2.
Start Time and End Time: The time window during which the strategy is allowed to execute trades.
█ PERFORMANCE OVERVIEW
This strategy is designed for mean-reverting markets and performs best when the price frequently deviates from its average high-low range.
It is sensitive to oversold conditions, as indicated by the IBS, which helps to identify potential reversals.
Backtesting results should be analyzed to optimize the Length, Bars Below Threshold, and IBS Buy Threshold parameters for specific instruments.

Turn of the Month Strategy on Steroids█ STRATEGY DESCRIPTION
The "Turn of the Month Strategy on Steroids" is a seasonal mean-reversion strategy designed to capitalize on price movements around the end of the month. It enters a long position when specific conditions are met and exits when the Relative Strength Index (RSI) indicates overbought conditions. This strategy is optimized for use on daily or higher timeframes.
█ WHAT IS THE TURN OF THE MONTH EFFECT?
The Turn of the Month effect refers to the observed tendency of stock prices to rise around the end of the month. This strategy leverages this phenomenon by entering long positions when the price shows signs of a reversal during this period.
█ SIGNAL GENERATION
1. LONG ENTRY
A Buy Signal is triggered when:
The current day of the month is greater than or equal to the specified `dayOfMonth` threshold (default is 25).
The close price is lower than the previous day's close (`close < close `).
The previous day's close is also lower than the close two days ago (`close < close `).
The signal occurs within the specified time window (between `Start Time` and `End Time`).
There is no existing open position (`strategy.position_size == 0`).
2. EXIT CONDITION
A Sell Signal is generated when the 2-period RSI exceeds 65, indicating overbought conditions. This prompts the strategy to exit the position.
█ ADDITIONAL SETTINGS
Day of Month: The day of the month threshold for triggering a Buy Signal. Default is 25.
Start Time and End Time: The time window during which the strategy is allowed to execute trades.
█ PERFORMANCE OVERVIEW
This strategy is designed to exploit seasonal price patterns around the end of the month.
It performs best in markets where the Turn of the Month effect is pronounced.
Backtesting results should be analyzed to optimize the `dayOfMonth` threshold and RSI parameters for specific instruments.

Consecutive Bars Above/Below EMA Buy the Dip Strategy█ STRATEGY DESCRIPTION
The "Consecutive Bars Above/Below EMA Buy the Dip Strategy" is a mean-reversion strategy designed to identify potential buying opportunities when the price dips below a moving average for a specified number of consecutive bars. It enters a long position when the dip condition is met and exits when the price shows strength by exceeding the previous bar's high. This strategy is suitable for use on various timeframes.
█ WHAT IS THE MOVING AVERAGE?
The strategy uses either a Simple Moving Average (SMA) or an Exponential Moving Average (EMA) as a reference for identifying dips. The type and length of the moving average can be customized in the settings.
█ SIGNAL GENERATION
1. LONG ENTRY
A Buy Signal is triggered when:
The close price is below the selected moving average for a specified number of consecutive bars (`consecutiveBarsTreshold`).
The signal occurs within the specified time window (between `Start Time` and `End Time`).
2. EXIT CONDITION
A Sell Signal is generated when the current closing price exceeds the high of the previous bar (`close > high `). This indicates that the price has shown strength, potentially confirming the reversal and prompting the strategy to exit the position.
█ ADDITIONAL SETTINGS
Consecutive Bars Threshold: The number of consecutive bars the price must remain below the moving average to trigger a Buy Signal. Default is 3.
MA Type: The type of moving average used (SMA or EMA). Default is SMA.
MA Length: The length of the moving average. Default is 5.
Start Time and End Time: The time window during which the strategy is allowed to execute trades.
█ PERFORMANCE OVERVIEW
This strategy is designed for mean-reverting markets and performs best when the price frequently oscillates around the moving average.
It is sensitive to the number of consecutive bars below the moving average, which helps to identify potential dips.
Backtesting results should be analysed to optimize the Consecutive Bars Threshold, MA Type, and MA Length for specific instruments.

Turn around Tuesday on Steroids Strategy█ STRATEGY DESCRIPTION
The "Turn around Tuesday on Steroids Strategy" is a mean-reversion strategy designed to identify potential price reversals at the start of the trading week. It enters a long position when specific conditions are met and exits when the price shows strength by exceeding the previous bar's high. This strategy is optimized for ETFs, stocks, and other instruments on the daily timeframe.
█ WHAT IS THE STARTING DAY?
The Starting Day determines the first day of the trading week for the strategy. It can be set to either Sunday or Monday, depending on the instrument being traded. For ETFs and stocks, Monday is recommended. For other instruments, Sunday is recommended.
█ SIGNAL GENERATION
1. LONG ENTRY
A Buy Signal is triggered when:
The current day is the first day of the trading week (either Sunday or Monday, depending on the Starting Day setting).
The close price is lower than the previous day's close (`close < close `).
The previous day's close is also lower than the close two days ago (`close < close `).
The signal occurs within the specified time window (between `Start Time` and `End Time`).
If the MA Filter is enabled, the close price must also be above the 200-period Simple Moving Average (SMA).
2. EXIT CONDITION
A Sell Signal is generated when the current closing price exceeds the high of the previous bar (`close > high `). This indicates that the price has shown strength, potentially confirming the reversal and prompting the strategy to exit the position.
█ ADDITIONAL SETTINGS
Starting Day: Determines the first day of the trading week. Options are Sunday or Monday. Default is Sunday.
Use MA Filter: Enables or disables the 200-period SMA filter for long entries. Default is disabled.
Start Time and End Time: The time window during which the strategy is allowed to execute trades.
█ PERFORMANCE OVERVIEW
This strategy is designed for markets with frequent weekly reversals.
It performs best in volatile conditions where price movements are significant at the start of the trading week.
Backtesting results should be analysed to optimize the Starting Day and MA Filter settings for specific instruments.

Consecutive Bearish Candle Strategy█ STRATEGY DESCRIPTION
The "Consecutive Bearish Candle Strategy" is a momentum-based strategy designed to identify potential reversals after a sustained bearish move. It enters a long position when a specific number of consecutive bearish candles occur and exits when the price shows strength by exceeding the previous bar's high. This strategy is optimized for use on various timeframes and instruments.
█ SIGNAL GENERATION
1. LONG ENTRY
A Buy Signal is triggered when:
The close price has been lower than the previous close for at least `Lookback` consecutive bars. This indicates a sustained bearish move, suggesting a potential reversal.
The signal occurs within the specified time window (between `Start Time` and `End Time`).
2. EXIT CONDITION
A Sell Signal is generated when the current closing price exceeds the high of the previous bar (`close > high `). This indicates that the price has shown strength, potentially confirming the reversal and prompting the strategy to exit the position.
█ ADDITIONAL SETTINGS
Lookback: The number of consecutive bearish bars required to trigger a Buy Signal. Default is 3.
Start Time and End Time: The time window during which the strategy is allowed to execute trades.
█ PERFORMANCE OVERVIEW
This strategy is designed for markets with frequent momentum shifts.
It performs best in volatile conditions where price movements are significant.
Backtesting results should be analysed to optimize the `Lookback` parameter for specific instruments.

4 Bar Momentum Reversal strategy█ STRATEGY DESCRIPTION
The "4 Bar Momentum Reversal Strategy" is a mean-reversion strategy designed to identify price reversals following a sustained downward move. It enters a long position when a reversal condition is met and exits when the price shows strength by exceeding the previous bar's high. This strategy is optimized for indices and stocks on the daily timeframe.
█ WHAT IS THE REFERENCE CLOSE?
The Reference Close is the closing price from X bars ago, where X is determined by the Lookback period. Think of it as a moving benchmark that helps the strategy assess whether prices are trending upwards or downwards relative to past performance. For example, if the Lookback is set to 4, the Reference Close is the closing price 4 bars ago (`close `).
█ SIGNAL GENERATION
1. LONG ENTRY
A Buy Signal is triggered when:
The close price has been lower than the Reference Close for at least `Buy Threshold` consecutive bars. This indicates a sustained downward move, suggesting a potential reversal.
The signal occurs within the specified time window (between `Start Time` and `End Time`).
2. EXIT CONDITION
A Sell Signal is generated when the current closing price exceeds the high of the previous bar (`close > high `). This indicates that the price has shown strength, potentially confirming the reversal and prompting the strategy to exit the position.
█ ADDITIONAL SETTINGS
Buy Threshold: The number of consecutive bearish bars needed to trigger a Buy Signal. Default is 4.
Lookback: The number of bars ago used to calculate the Reference Close. Default is 4.
Start Time and End Time: The time window during which the strategy is allowed to execute trades.
█ PERFORMANCE OVERVIEW
This strategy is designed for trending markets with frequent reversals.
It performs best in volatile conditions where price movements are significant.
Backtesting results should be analysed to optimize the Buy Threshold and Lookback parameters for specific instruments.

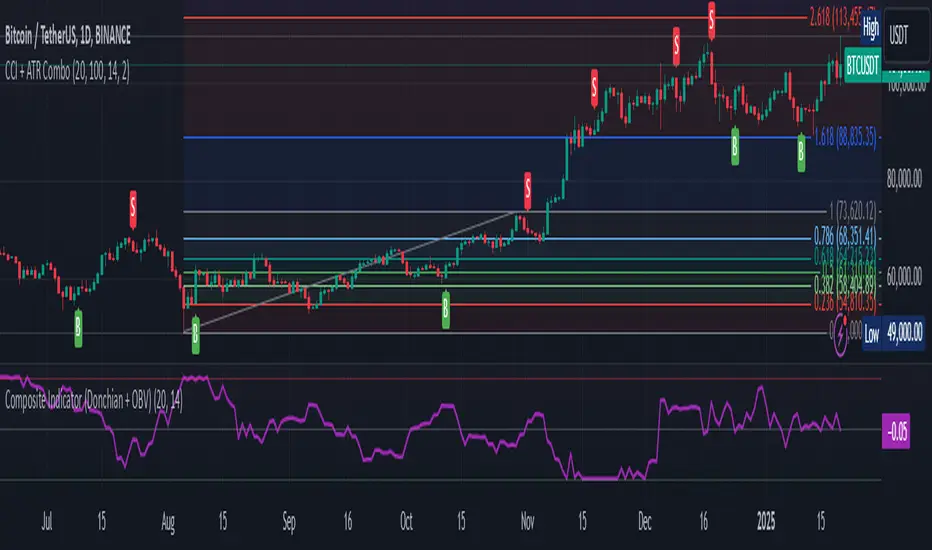
Composite Indicator (Donchian + OBV)Composite Indicator (Donchian + OBV)
The Composite Indicator (Donchian + OBV) is a powerful tool designed to evaluate the strength of market breakouts and momentum trends , offering traders a comprehensive perspective on price action. This indicator combines the Donchian Channel with On-Balance Volume (OBV) to create a dynamic and easy-to-interpret metric scaled between -1 and 1 .
Key Features
Breakout Strength Analysis:
- The indicator assesses the strength of price breakouts relative to the upper and lower bounds of the Donchian Channel.
- Positive values close to 1 indicate a strong bullish breakout.
- Negative values close to -1 indicate a strong bearish breakout.
Momentum Detection with OBV:
- On-Balance Volume (OBV) tracks the cumulative buying and selling volume to gauge market momentum.
- The smoothed OBV trend ensures the momentum component aligns with price action, reducing noise.
Integrated Composite Value:
- Combines breakout strength and OBV momentum into a single metric for enhanced clarity.
- The final composite value highlights whether the market is bullish, bearish, or neutral.
Divergence Detection:
- Spot bullish divergences when the indicator rises while price falls, suggesting a potential upward reversal.
- Identify bearish divergences when the indicator falls while price rises, hinting at a potential downward reversal.
How It Works
Donchian Channel Analysis:
- Calculates the highest high and lowest low over a user-defined period to establish the upper and lower channels .
- Breakouts beyond these channels contribute to the breakout strength component.
OBV Momentum:
- Measures cumulative volume trends to validate price movements.
- Momentum is derived from the rate of change in smoothed OBV values.
Composite Calculation:
- Combines breakout strength and OBV momentum, normalized and scaled to -1 to 1 for clarity.
How to Use
Bullish Breakout:
- When the indicator value approaches 1 , it signals a strong upward breakout supported by positive OBV momentum.
- Example Action: Consider a Buy if price breaks the upper Donchian Channel with increasing OBV.
Bearish Breakout:
- When the indicator value approaches -1 , it indicates a strong downward breakout supported by negative OBV momentum.
- Example Action: Consider a Sell if price breaks the lower Donchian Channel with decreasing OBV.
Neutral Market:
- When the value is near 0 , the market is likely balanced with no significant breakout or momentum detected.
Divergence Opportunities:
- Bullish Divergence: Price makes lower lows, but the indicator trends upward → Potential upward reversal.
- Bearish Divergence: Price makes higher highs, but the indicator trends downward → Potential downward reversal.
Customization Options
Donchian Channel Length: Adjust the period for the upper and lower bounds.
OBV Smoothing Length: Modify the smoothing period for OBV to fine-tune momentum detection.
Scaling Adjustments: The composite value is automatically normalized for consistency across timeframes.
Ideal Use Cases
Breakout Trading: Identify and confirm strong breakouts in volatile markets.
Momentum Confirmation: Validate price movements with volume-based momentum.
Reversal Detection: Leverage divergences to spot potential market reversals.
Example Applications
Strong Bullish Signal:
- Price breaks the upper channel , and OBV shows increasing volume → Composite value near 1 .
- Action: Enter a Buy position and set a Stop Loss below the upper channel.
Strong Bearish Signal:
- Price breaks the lower channel , and OBV shows decreasing volume → Composite value near -1 .
- Action: Enter a Sell position and set a Stop Loss above the lower channel.
Neutral Market:
- Composite value near 0 suggests indecision or consolidation. Wait for a breakout.
Limitations
Best used alongside additional tools like RSI or MACD for filtering noise and improving decision-making.
Requires careful parameter tuning based on the asset and timeframe.
Final Thoughts
The Composite Indicator (Donchian + OBV) offers traders a versatile tool to navigate complex markets. By blending breakout analysis with volume-based momentum, this indicator provides an actionable edge for identifying high-probability opportunities and potential reversals.