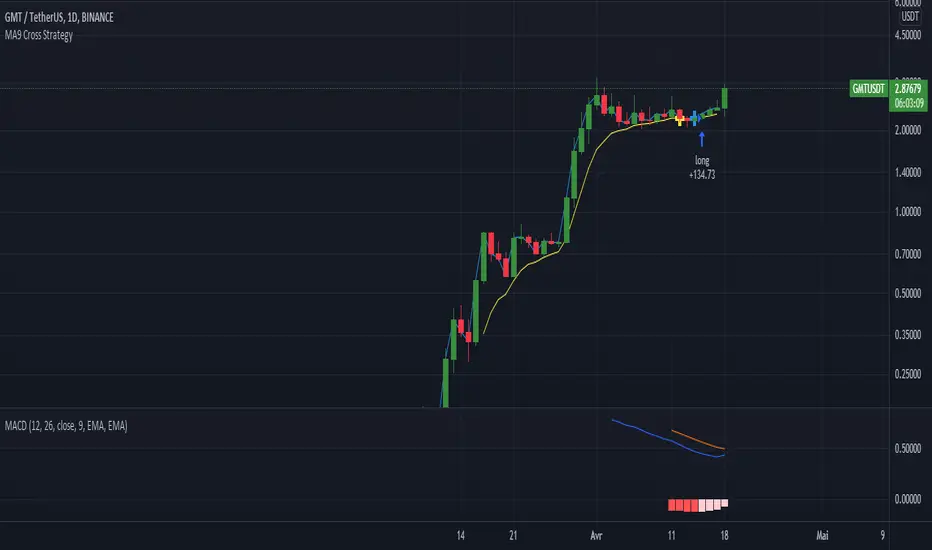
MTF RSI & STOCH Strategy by kziThis script is a teaml job with Indicator-Johns.
First he used my script, then i transform his code.
The origine:
The first transformation:
www.tradingview.com
Funny moment together, thanks for that. :)
This sharing is an indicator where you can see the average of different time frames.
The RSI is the blue line
The Stock is the yellow line
You can manage the timeframe in the parameters.
The strategy is to take position when the two lines get overbought or oversold and close when the stoch and RSI goes to the middle.
Penunjuk Breadth

Test strat charlot citronTest strat charlot citrondsfsdfsdf
sôkfsd$*pokf*$psf
slf*^sdkf*sd^pf
l*^fs;*^fskd*^psdf
*sp^zqf;s*d^pofplks*^pfok
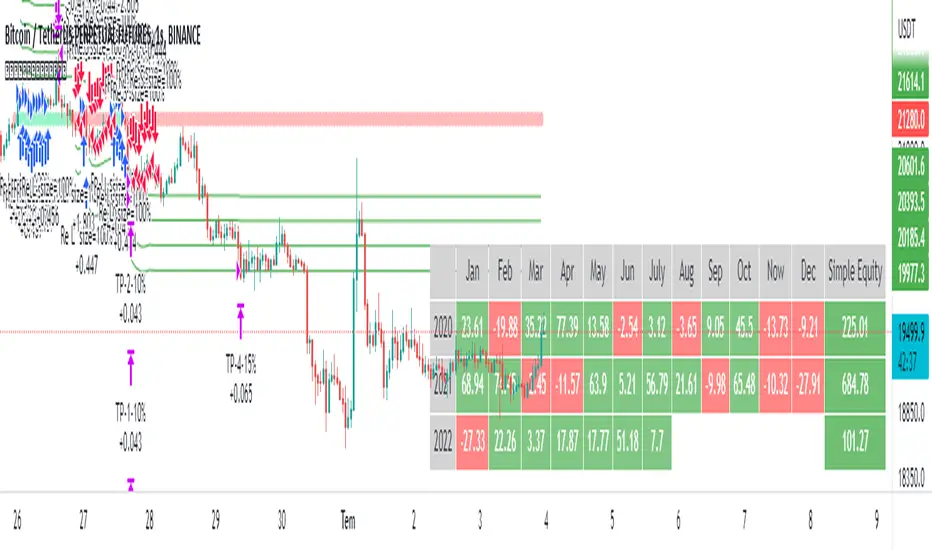
Profit Harvester System
(1) Strategy Introduction
- This is a profit harvesting system, an optimized high frequency trading strategy, by invitation only
- It can achieve a stable average annual return and is suitable for most crypto-currency markets
- It is recommended that the initial capital of one crypto-currency pair is greater than 2000 USDT
- You need to bear some floating loss, but don't worry, the strategy will stop profit and reduce positions automatically
- Support leverage from 1 to 5 times, but note that there is a strong leveling risk when leverage is greater than 1 times
- Support strategy alerts. You can add alerts at the top of the trading panel
(2) Parameters
- Indicator Resolution
- Min Resolution (Minutes) : The resolution of the indicator, i.e. the interval for updating the indicator, default 240 minutes
- MA Trending Line
- Draw Trending Line? : Draw trend lines to determine the long/short direction
- Moving Average Type : Type of moving average, default is SMA
- Moving Average Period : The period of the moving average, SMA30 by default
- Normalized On Balance Volume
- Draw Normalized On Balance Volume? : Plot the normalized OBV to show the volume/price relationship
- Moving Average Type : Type of moving average, default is EMA
- Moving Average Period : The period of the moving average, EMA21 by default
- Sigma of Normalized On Balance Volume : Upper and lower range of normalized OBV for determining the energy of the volume/price relationship
- Trading settings
- What Trades Should Be Taken? : The trading direction, supports long only, short only or no trade
- Maximum Shares of Position : The maximum number of shares of the position, i.e. the initial capital (default is 2000) is divided into that number of shares equally
- First Shares on Entrying Position : The number of shares occupied when entrying position to avoid missing the trend market
- Profit Ratio for Average Entry Price : Close all positions and cancel all orders when the current price exceeds the average position price and the profit rate is reached
- Increase Ratio for Next Share : Equal proportion of the order price when adding position
- Trading Leverage (Risk Term) : Trading leverage supports from 1 to 5 times, 2 by default. However, there is a strong leveling risk when the leverage is greater than 1!
- Max Floating Loss of Equity (Risk Term) : How much do you wanna risk. When the max floating loss threshold is reached, the position will be closed and all orders will be canceled!
- Price Trail Stop : Whether enable price trail stop mode to obtain more profits
(3) About usage
- This strategy is by invitation only. If you are interested in this strategy or would like to use it, please leave a message
- The default parameters is suitable for VETUSDT, MATICUSDT, ATOMUSDT, XRPUSDT and so on
- It is highly recommended to use long-only direction rather than short-only direction because the market will not go down forever
(4) Exceptions
- When "Increase Ratio for Next Share" is too small and "Maximum Shares of Position" is too large, there may be an error that the number of orders exceeds 9000, which is caused by the limitation of tradingview itself
Happy trading and enjoy your life!
————————————————————————————————————————
(1) 策略简介
- 这是一个利润收割系统,一种优化的高频交易策略,仅限受邀请使用
- 可以达到稳定的平均年化收益率,且适用于大部分数字货币市场
- 建议单个数字货币交易对的基础资金大于2000USDT,避免单笔交易资金低于最低交易资金限制
- 需要您承受一定的浮亏,但是不用担心,本策略会自动执行止盈和解套
- 支持1至5倍的杠杆,但是需要注意,杠杆大于1倍时存在爆仓风险
- 支持策略提醒,在交易面板上方添加策略提醒即可
(2) 参数说明
- Indicator Resolution
- Min Resolution (Minutes) : 指标的分辨率,即更新指标的间隔,默认240分钟更新1次
- MA Trending Line
- Draw Trending Line? : 是否需要绘制趋势线,用于判断多空方向
- Moving Average Type : 移动平均线的类型,默认为SMA
- Moving Average Period : 移动平均线的周期,默认为240分钟下的30日均线
- Normalized On Balance Volume
- Draw Normalized On Balance Volume? : 是否需要绘制归一化OBV指标,该指标反应量价关系
- Moving Average Type : 移动平均线的类型,默认为EMA
- Moving Average Period : 移动平均线的周期,默认为240分钟下的21日均线
- Sigma of Normalized On Balance Volume : 归一化OBV的上下区间,用于判断量价关系的能量
- Trading settings
- What Trades Should Be Taken? : 代表可以交易的方向,支持仅多头、仅空头或不交易
- Maximum Shares of Position : 仓位的最大份数,即将初始资金(默认为2000)等分为该份数的资金
- First Shares on Entrying Position : 当开仓后,首仓占用的份数,以避免错过趋势行情
- Profit Ratio for Average Entry Price : 当前价格大于仓位均价,并达到该收益率时,关闭所有仓位并取消所有挂单
- Increase Ratio for Next Share : 等比加仓的价格比例
- Trading Leverage (Risk Term) : 交易杠杆,支持1-5倍杠杆,默认为2倍杠杆,但是杠杆大于1倍时存在爆仓风险!
- Max Floating Loss of Equity (Risk Term) : 自开仓开始,您愿意承受的最大浮亏,当达到该浮亏后,仓位全平并取消所有订单!
- Price Trail Stop : 是否启用尾单止盈模式,以收割更多的利润
(3) 使用说明
- 该策略仅限受邀请使用,如果您对该策略感兴趣或者想要使用我的脚本,请给我留言
- 默认参数适用于 VETUSDT MATICUSDT ATOMUSDT XRPUSDT 等交易对
- 强烈建议使用多头交易而不是空头交易,因为市场不会永远下跌
(4) 异常情况
- 当"Increase Ratio for Next Share"设置过小而"Maximum Shares of Position"设置过大时,可能会出现订单数量超过9000的错误,这是tradingview本身的限制导致的
祝大家交易愉快

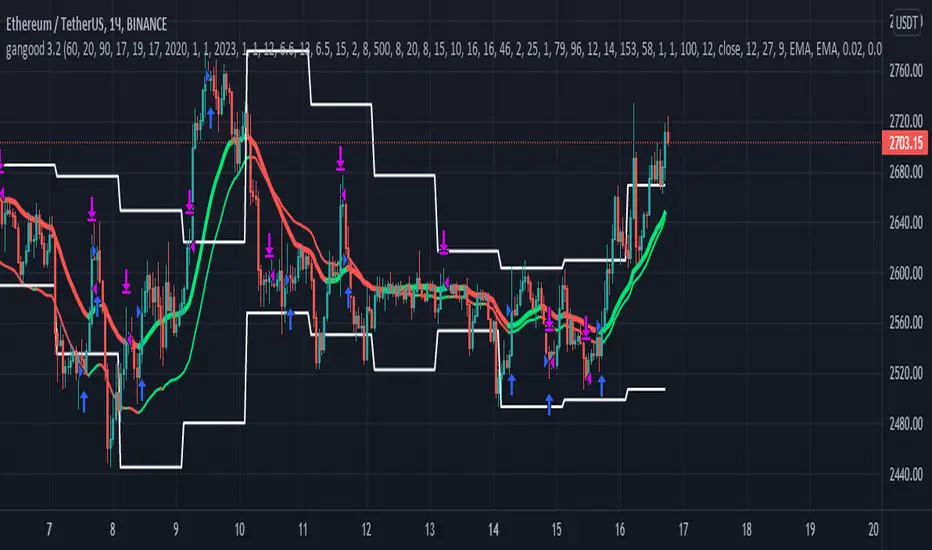
gangood bot for FinandyGangood is a mean reversion algorithm currently optimized for trading the ETH/USDT pair on the 1 hour chart time frame. All indicator inputs use the closing price of the period, and all trades are executed at the open of the period following the period in which the trading signal was generated.
To take into account slippage, the commission costs 0.15%.
Backtest result from 2020.
Result since 2019 2,500,000%, maximum drawdown 18%
This bot uses 11 indicators:
1) ADX
2) RANGE FILTER
3) SAR
4) RSI
5) TWAP
6) JMA
7) MACD
8) VOLUME DELTA
9) VOLUME WEIGHT
10) MA
11) TSI
Pattern 1:
There are 3 main components that make up Gangood: I. Trend Filter. The algorithm uses a version of the ADX indicator as a trend filter to only trade during certain time periods when price is most likely to be range-bound (i.e., average retracement). This indicator consists of a fast ADX and a slow ADX both using the same lookback period.
The ADX is smoothed with a 6-period EMA and the slow ADX is smoothed with a 12-period EMA. When the fast ADX is above the slow ADX , the algorithm does not trade because it indicates that the price is most likely trending, which is bad for a mean reversion system. Conversely, when the fast ADX is below the slow ADX, the price is likely to be in a range, so this is the only time the algorithm is allowed to trade. II. Bollinger Bands When the trend filter allows trading, the algorithm uses Bollinger Bands.
Indicator for opening long and short positions. The Bolliger Bands indicator has a 20 lookback period and a 1.5 standard deviation for both the upper and lower bands. When the price crosses the lower band, a buy signal is generated and a long position is opened. When the price crosses the upper band, a sell signal is generated and a short position is opened.
Pattern 2:
Based on RSI which is commonly used as a trend reversal indicator. However, here it is used as a trend-setting indicator, often with great success. This pattern only takes long trades, which is quite successful in a bull market.
Pattern 3:
Long or short trades are determined by the intersection of the fast EMA with the slow EMA for long positions and vice versa for short positions. Trades should only occur close to intersections. We then use the MACD for the long position. an indicator with a 10-minute time frame where we look for high peaks in negative values for longs and vice versa for shorts. They should be significantly higher than the other peaks.
Capital Management:
The maximum leverage in this strategy, I would recommend 2x, in order to trade without unnecessary risks and keep your nerves in order.
Bot setup:
I use the Finandy terminal, in which you can easily trade with this strategy.
1. We go to binance and turn on the hedging mode, this is necessary so that if tradingview sends a webhook for buying later than for selling.
2. Adding a new signal to Finandy
2.1. Open tab
2.1.1. "Order side" Strategy
2.1.2. "Amount" Balance% x Leverage
2.1.3. We set the percentage of the order two times less than the one you want
2.1.4. "Shoulder" is twice as large as the one you want
2.2.Close tab
2.2.1. "Enebaled" tick
2.2.2. "Reverse / Close" Disable
3. Set a notification for this strategy.
4. Copy "Signal URL" and paste it into webhook on tradingview
5. Copy "Signal Message" and paste it into the message on tradingview
Stairs Gain Strategy - MGI will explain step by step.
1- The position order filtering option is used to filter out duplicate positions.
2- The reason I use an ATR multiplier is to balance the ATR value that differs in instruments.
3- ATR lower limit and ATR upper limit values are to reduce unnecessary transactions and commission expenses in the horizontal market.
4- Strategy take profit and stop loss levels are calculated as percentages. The reason why there is no point account is that it can be used in the stock market.
5- Developer friends can get a more efficient result in forex market instruments by converting this to a point account.
Notice :
Variables are different in each instrument. Therefore, this strategy should be optimized for each instrument used.

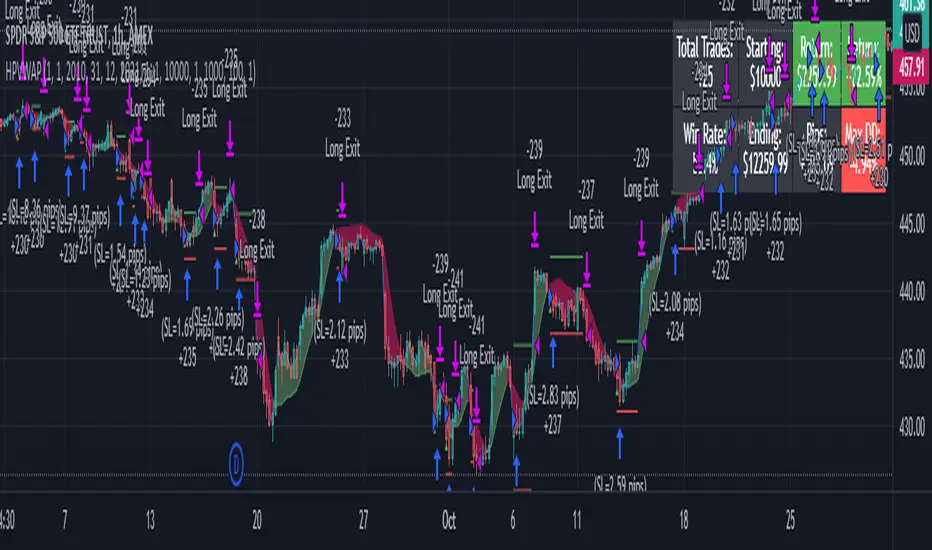
SPXL Futures Strategy- Buy/sell signals for SPXL using futures momentum.
- For real-time signals at close, use ES1! on 2 minute chart and sign up for real-time cboe mini futures data feed in tradingview.
- All buys and sells are at near close of US RTH market at 4pm.
- Best to use the script with other breadth signals to decide on trading strategy.
- Script is compatible with SPY, SPXL, RSP, QQQ, TQQQ and many other SPX correlated tickers, however it’s primarily developed for SPX.

LPB MicroCycles StrategyWhat it is:
We use the Hodrick-Prescott filter applied to the closing price, and then take the outputted trendline and apply a custom vwap, the time frame of which is based on user input, not the default 1 day vwap . Then we go long if the value 2 bars ago is greater then one bar ago. We sell and color the bars and lines when the if the value of 2 bars ago is less than one bar ago.
Also included:
GUI for backtesting
ATR Based Stop Loss
How to use:
Go long when the indicators suggest it, and use the stop losses to reduce risk.
Best if paired with a volatility measurement (inside candles, average true range , bollingerband%B)
Bot go_up DD_long/shortHello!
This strategy is based on the double bottom pattern - for entering a long position / double top-short
A double bottom pattern is formed when two price bottoms are relatively at the same level and the top acts as resistance. This pattern appears at the end of a downtrend and signals a reversal.
A double top is a bearish reversal pattern that signals the end of an uptrend. It is formed by two price highs forming at the same level and a notch line that acts as local support.
As history and practice show, the double bottom pattern works better. Moreover, in a bull market.
You can include only long or only short. BUT while there is a long, a short position will not be opened, in fact, with a long as well.
You can use reverse trade, one coin at a time.
DESCRIPTION:
// LOGIC ENTRY:
Period for short and long positions-to search for double bottom as well as double top. the more, the less false.
Change liong and short-channel width for pattern search separately for long and short.
General shift-the overall width of the channel, which changes equally at once for long and short
By default, quiet settings for tf 5 minutes are applied!
You can choose the settings you like.
// AMOUNT(USDT) FIRST ORDER AND > % NEXT
In the first column, indicate the amount, in the second, how many percent the next order will be more than the previous one.
// EXIT SETTINGS
Closing a trade by RSI when it reaches the level specified in the settings (but in the negative, the trade will never be closed, even if the condition is triggered)
Using a percentage to exit a trade + stop loss. (Put a stop order 1000+ on the market can be anything, especially if you use spot trading)
PS: in order to use the RSI output at a certain level, put a checkmark on the desired one, and also check the percentage box and indicate a take on the percentage 10-20 +)
// MARTINGALE GRID
If there is a check mark, then the grid is used.
Use all signals?
If yes, then there will be no limit on inputs from logic
If the checkbox is not checked, then you can limit the entries from the strategy logic by the specified percentage.
Grid, the next order, when decreasing by a certain percentage, an order when decreasing by the percentage that will be specified (after entering from the logic, when the next signal appears, the grid will be counted from the beginning)
PS: orders are not automatically placed, if the conditions are triggered, then the entry is only at the next bar (within the TV, it is not possible to add orders immediately, but most often, in case of straits, for the better)
// FILTER SETTINGS
The filter consists of a series of popular, averaged oscillators
//DATA RANGE
You can see the results for the selected period
//
CALCULATION OF ORDERS AND MARGIN (FOR INFO ONLY)
The number of orders is the number of entries (you must always have the same number of orders in the arguments and in the properties !!)
- in the aruments for understanding, in the properties - it does not matter how much it will cost there, so many inputs will be!)
-leverage is created to calculate the margin
When you change these parameters, you will understand how much money is required in general and what maximum drawdown can be allowed
Green line-take, lower-stop-order.
To use algo trading, in fact, you need to use a script, in the service through which you will transmit a signal through webhooks, you need to select the amount.
{{strategy.order.contracts}}
ОПИСАНИЕ НА РУССКОМ
//ЛОГИКА ВХОДА:
Период для шорт и лонг позиций, сдвиг для шорта лонга, также общий
По умолчанию применены спокойные настройки для тф. 5 минут.
Вы можете самостоятельно подбирать настройки, основываясь на прошлые результаты
//СУММА ВХОДА В ЮЗДТ +МАРТИНГЕЙЛ:
В первой графе указываете сумму , во второй -на сколько процентов следующий ордер будет больше предыдущего.
//НАСТРОЙКИ ВЫХОДА ИЗ СДЕЛКИ
Закрытие сделки по RSI, когда достигнет уровня, указанного в настройках ( но в минус сделка не будет закрыта никогда, даже если условие сработало)
Использование процента для выхода из сделки+ стоп приказ.( Ставьте стоп-приказ 1000+ на рынке может быть всякое, тем более, если используете спотовую торговлю)
ПС: для того, чтобы использовать выход по RSI по определенному уровню, поставьте галочку на нужный , а также поставьте галочку по проценту и укажите тейк по проценту 10-20+)
//НАСТРОЙКИ СЕТКИ
Если стоит галочка-то сетка используется.
Использовать все сигналы?
Если да, то лимита по входам от логики не будет
Если не стоит галочка, то можно ограничить входы от логики стратегии, на указанный процент.
Сетка, следующий ордер, при снижении на определенный процент-след ордер при снижении на тот процент, который будет указан ( после входа от логики , при появлении следующего сигнала сетка будет считаться с начала)
ПС: ордера автоматически не ставятся, если сработали условия, то вход, только на следующем баре ( в рамках ТВ, нет возможности добавить сразу ордера, но чаще всего, при проливах-к лучшему)
//НАСТРОЙКИ ФИЛЬТРА
Фильтр состоит из серии популярных, усредненных осцилляторов.
//
БЭКТЕСТИНГ
Можете посмотреть результаты за выбранный промежуток
//
ПИРАМИДИНГ (исключительно для расчета)
Количество ордеров-это количество входов ( у вас всегда должно быть одинаковое количество ордеров в агрументах и в свойствах!!)
-в аргументах для понимания, в свойствах -важно, сколько там будет стоить-столько входов и будет!)
-плечо создано для расчета маржи
При изменение данных параметров Вы будете понимать сколько потребуется средств в общем и какую максимальную просадку можно допустить
Зеленая линия-тейк, нижняя-стоп-приказ.
Для использования алго-трейдинга, собственно так и нужно использовать скрипт, в сервисе, через который Вы будете передавать сигнал через веб-хуки , Вам нужно выбрать количество.
{{strategy.order.contracts}}
Удачных трейдов, друзья!

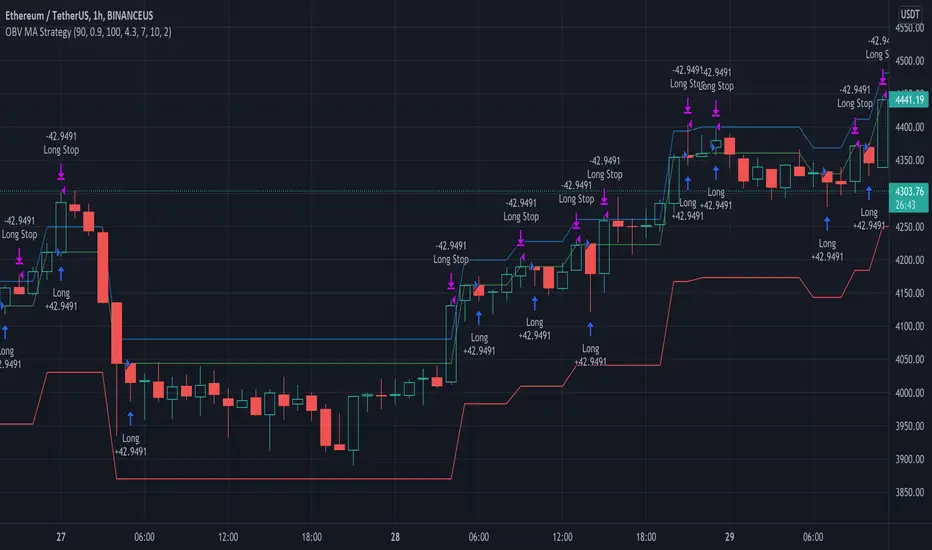
OBV MA StrategyThe On Balance Volume + Moving Average Strategy
Parameters: 1H candles, ETHUSDT on BINANCEUS, commission percent uses Binance's maker/taker fees of 0.075%
Strategy: I create a 30 day moving average of the On Balance Volume "obvSma = ta.sma(ta.obv, 30)." Then I use the following buy conditions:
OBV crosses above the OBV moving average
The obv drops x% below the OBV moving average (buy a dip)
The OBV moving average is rising, the OBV is greater than the OBV moving average and the OBV is rising
The first buy condition is attempting to buy into an uptrend. When the OBV rises above the OBV moving average, people are buying and it's a good time to enter the trade.
The idea behind the second buy condition is to buy a dip so make sure you are careful to not set it too shallow or you'll end up buying the dip before the dip before the dip. :) I recommend 10% or more.
The third buy condition is there in case our trailing stop takes us out of a trade but the trend is still rising, we don't want to miss out on that profit so if the OBV is above the OBV moving average, the average is rising and the OBV is rising, we are likely in the middle of an uptrend and we should buy in.
TradingGroundhog - Strategy & Fractal V1#-- Public Strategy - No Repaint - Fractals -- Short term
Here I come with another script, more simple than Wavetrend V1. You will love it.
#-- Synopsis --
Another simple idea, on a small time frame (15 min) we buy when the opening price goes below a Bottom fractals and sell when it goes over a Top fractals, but as this script do not use Wavetrends. You should stop by your self to use the script during long lasting downtrends.
I developed the strategy using BTC /EUR 3 MIN BINANCE but it can be applied to many other cryptos, I don't know for forex or others. You can use it for short term (to a month of uptrend) and automated trading.
#-- Graph reading --
And now, how to read it ?
Fractals:
Yellow Flags occur when the opening price goes below a Bottom fractal , it means Buy.
White Flags appear when the opening price goes over a Top fractal , it means Sell.
#-- Parameters --
*** Parameters have been intensively optimized using 10 cryptocurrency markets in order to have potent efficiency for each of them. I would recommend to only change the Can Be touch parameter. For the others, I don't recommend any modifications. The idea behind the script is to be able to switch between markets without having to optimize parameters, less work, easy to target active crypto and therefor limit the risks. ***
Can be touch :
'Filter fractals' : Activate or Disable the filtering fractal operation. If Enable, buy during less risky periods. (Activate is often better)
Can be touch but not necessary :
'VolumeMA' : The Volume corrector used by the fractals
'Extreme window' : The number of price individuals to look for if we want to remove extreme fractals.
Not to touch :
'Long Sop Loss (%)' : The minimal difference of price between a Fractal bottom and the opening price to buy.
#-- Time frame --
Should be used with the following time frames depending on the necessity:
1 MIN
3 MIN (Preferred with the parameters set)
5 MIN
#-- Last words --
The script can be set up to send Tradingview signals to 3comma just by adding comment = " " in strategy.close_all() and strategy.entry().
Good trades !
Disclaimer (As it should always be one to any script)
***
This script is intended for and only to be used for personal purposes only. No such information provided by it constitutes advice or a recommendation for any investment or trading strategy for any specific person. There is no guarantee presented or implied as to the accuracy of specific forecasts, projections, or predictive statements offered by the script. Users of the script agree that its original developer does not take responsibility for any of your investment decisions. Please seek professional advice before trading.
***
# Here are the results from the 20rst of September 2021 with 100% of equity on the BTC /EUR 3 Min and with a capital of 10 000 EUR. So almost, one month.
# As I saw, it goes from +30% to more than +160% (the great SHIB) depending on the selected crypto. It may be negative if you spot a downtrend.

Volume Difference Delta Cycle OscillatorVolume Difference Delta Cycle Oscillator indicator:
Using the power of my Volume Difference Indicator and standard deviations based on Bollinger Bands and more, we present this wonderful indicator with the following features:
Price Action Histogram: This is the bread and butter of this graph, if the PAH is above 0, this is considered a BULL cycle, and if below 0, this is considered a BEAR cycle. The histogram will move up and down based on the Histagram settings you set in the properties field. Be careful, we advise using default settings.
Custom Overbought & Oversold Lines:mean
These lines can be used to identify when to buy and sell the security, and help you make sense of the action of the histogram. Change the color, size, and linewidth!
These lines are what are used to perform the trades with the strategy as well, so if you change them, they will make an impact on the strategy itself.
EzSpot Background:
Do you want to turn your brain off and just trade when you you're inside an Overbought or Oversold line? Awesome! Turn on EzSpot backgrounds, and when it's green, go long, when it's red go short! Simple as that!
How it works:
By taking the Delta of the Volume Difference Indicator we're able to find the rate of change of the amount of change of volume, allowing us to see changes in volume before price changes. To add onto these, we supercharge it by taking the output of this line as the input source of bollinger bands which we use to output the %B of the Delta of the Volume Difference Indicator.
Separately, we calculate the %B of the current close to use later.
The final step is taking the second %B (which is an indication of where price lies on the curve of historical price data), and from it subtract the first %B, which allows us to visualize the standard deviation of the closing price, minus the standard deviation of Delta of the Volume Difference , which in essence allows us to see when volume changes but price does not and vice versa.
This final output is then plotted along with an over bought and over sold line, which we use to perform our trades on.
Simplified: This indicator shows the cycles of price action - volume based on the rate of the rate of volume changes based on price and the closing price.
Super Simple: Notice when volume increases but price hasn't, and vice versa with this indicator.

BBPBΔ(OBV-PVT)BB - Time Series Decomposition & Volume WeightedThis is an indicator that shows 5 different points of information:
#1 The Trendline is uses a time-series decomposition to remove noise and seasonality data to provide a trendline without using moving averages. This is then further processed by a custom VWAP block that weights it based on the time frame you're currently using.
#2 BB%B - This is the blue histogram that's partially transparent. This is used to find when a security is overbought or oversold.
#3 BB%B of the Δ(OBV-PVT). This is the green histogram. We took the OBV and subtracted the PVT from it, then we found the delta of that compared to the previous candle. This output a line, which we wrapped in bollinger bands to find the BB%B of this line. This line is represented as a histogram, for visual clarity.
#4 Long and Short Indicators: Long is represented by a green dot, and short is represented by a red dot.
#5 Zones - there are multiple zones, which are used to identify overbought and oversold zones.
How to use the indicator:
Simple way: Long on green dot, Short on red dot. Use stop losses and take profits.
Slightly More Complex: Same as above, but also close out longs, when the green histogram drops but the blue does not. As this means price action hasn't caught up with volume. Use stop losses and take profits.
Full Usage: Long only when both the green, blue and yellow lines are below 0, and sell when the blue or green histogram rises above 1. Perform the opposite for the shorting. Ignore the dots if you use this method, they are for simple reference points til you get used to this indicator. Use stop losses and take profits.

MyTradePartnerMyTradePartner strategy makes the cryptocurrency markets buy and sell automatically. 5 stoploss, fixed profit take and stoploss level can be customized from strategy settings. There are 4 separate strategies that you can set in the strategy. First of them, there are strategies that decide long and short positions in accordance with your settings at the pivot levels, second of the super trend, third of the potential return levels, third of the up and down breaks. Pyramiding can offer multiple entry points. Strategy back tests can be adjusted to the desired time period and can be used as spot or term if desired. Frostybot is set to work fully compatible with js when the necessary inputs are made from these strategy settings. When installing an alarm for FROSTYBOT JS, the alarm message field is {{strategy.order.alert_message}}.
FEATURES:
-Fully compatibly with Frostybot
-High Percent Profitable strategy up to %60
-İnclude five level Trailing Stoploss, fixed stoploss and takeprofit with position size management
-include four strategy mentably in one strategy use one, use two or both
-All settings are customizable. Create your unique strategy with settings.
COIN FX PRO TRADERCoin Fx Pro strategy makes the cryptocurrency markets buy and sell automatically. 5 stoploss, fixed profit take and stoploss level can be customized from strategy settings. There are 4 separate strategies that you can set in the strategy. First of them, there are strategies that decide long and short positions in accordance with your settings at the pivot levels, second of the super trend, third of the potential return levels, third of the up and down breaks. Pyramiding can offer multiple entry points. Strategy back tests can be adjusted to the desired time period and can be used as spot or term if desired. Frostybot is set to work fully compatible with js when the necessary inputs are made from these strategy settings. When installing an alarm for FROSTYBOT JS, the alarm message field is {{strategy.order.alert_message}}.
For best back test performance results. Use it
BTCUSDTP and 5 MIN TIME FRAME!!!

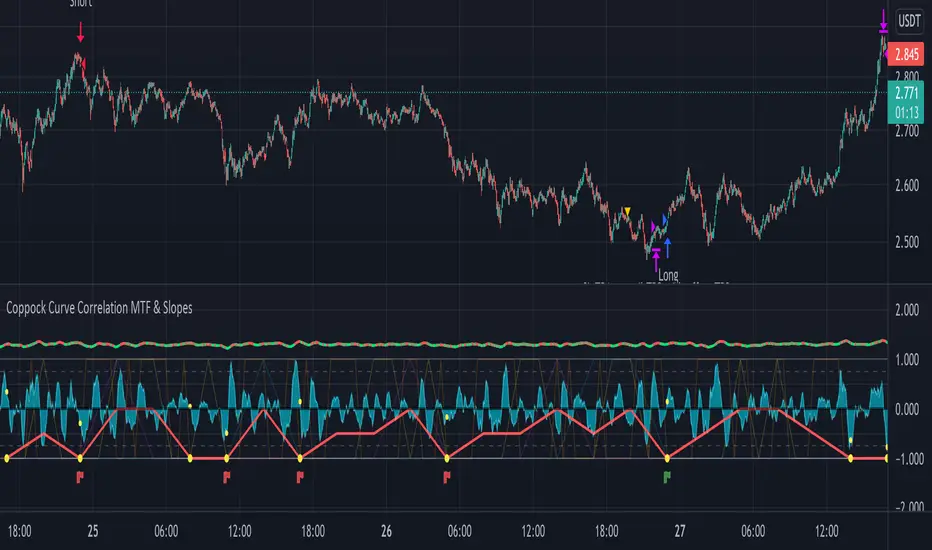
Coppock Curve Correlation MTF & Slopes - Long Strategy- This strategy is based on the Coppock Curve Correlation MTF & Slopes tool
- Condition for entry is very simple :
-> If the correlation of 8 timeframes expressed by 4 curves reaches 1 or -1
-> and the Coppock curve and the Coppock Slope (on 3 periodes back) are rising => then entry.
(You can also visually look at : orange/yellow dot on the slope wave and green flag).
- There's the possibility to trail stop loss and multiple take profit levels.
- Back testing period setting.
- I've added the possibility to extend the lookback period of the correlation for the curves.
- Results could be interesting with a well managed trailing stop loss / take profit and trading on higher time frames.
Market spot - ADA/USDT
Timeframe = 3min
Forex bot full strategy with risk managementThis is a full strategy designed for forex major pairs, specially EUR/USD using 1h time frame chart.
Its components are
200 EMA
MACD
OBV
PSAR
RIsk management with tp and sl movements
Rules for entry
For long = Previous histogram from MACD was below 0 and current one is above 0. CLose of a candle is above EMA 200 , OBV oscillator is negative and we have an uptrend from PSAR
For short = Previous histogram from MACD was above 0 and current one is below 0. CLose of a candle is below EMA 200 , OBV oscillator is positive and we have an downtrend from PSAR
Rules for exit
For tp and sl values we calculate the distance from the close of candle until the psar values.
If you have any questions, let me know !

VolPIN StrategyI believe it is perhaps one of the world's simplest but one of the rare indicators where backtest results are so efficient. As a strategy, we buy every time a buy signal comes, but we need to repeat this 4 times and after 4 times we buy when our average rises by 0.5 percent. I know that this indicator, which I did not prepare for the sales strategy, also works very efficiently in sales transactions.
On settings part you can change the volatility and PIN percentage. I prepare for 1 minute graphs for coins. Maybe if you can arrange the settings for the stocks and different time periods.

Tripple super Trend + EMA + RSI StrategyGreetings!
Here I show you the Tripple Super Trend Strategy.
I discovered the strategy on a YouTube channel and tried to transfer it as a strategy into a script.
Tested with the currency pair EUR/USD in the one hour chart.
Period: beginning of 2020 until today.
The strategy should also work with cryptocurrencies. But then the settings have to be adjusted.
There is the possibility to activate only long or only short position.
The EMA can be used in a time different from the chart.
-----------------------------------------------------------------------------------
How does the strategy work?
For long positions, the candle must be above the EMA .
The candle must be closed above at least two of the supertrend lines.
The stochastic RSI must show oversold and the k line must cross over the D line.
For short positions, the candle must be below the EMA .
The candle must be closed below at least two of the supertrend lines.
The stochastic RSI must indicate overbought and the K line must cross below the D line.
The stop loss is determined with the "lowest low/highest high lookback".
The profit factor is multiplied by the value of the lowest low/highest high lookback.
The results of the strategy are without commissions and levers.
If you have any questions or feedback, please let me know in the comments.
In the future I will add other types of stop loss / take profits. (ATR; %; eg.)
If you need more information about the strategy and want to know exactly how to apply it, check out my profile.
I wish you good luck with the strategy!

Jigga - Heatmap ComparisionHi All,
I always have a question on how to know which sector is performing. I have created this Heatmap comparison to know strength of sector.
I have used RSI and MACD calculation and put it across 5 different index. Color shows bullishness and Gray shows weakness.
You can select RSI or MACD or Both to have calculation. And you can also compare stocks if you want.
Note: Use it for Medium / Long term investment. Can not be use for Intraday.
Happy investing !!

Zweig Market Breadth Thrust Indicator StrategyThe Breadth Thrust Indicator is a technical indicator which determines market momentum, signaling the start of a potential new bull market.
The Breadth Thrust Indicator was developed by Martin Zweig, an American stock investor, financial analyst, and investment adviser. According to Zweig, the concept is based on the principle that the sudden change of money in the investment markets elevates stocks and signals increased liquidity. In other words, this indicator is all about how quickly the NYSE's advancing and declining numbers go from poor to great in a compressed time period.
A "Thrust" indicates that the stock market has rapidly changed from an oversold condition to one of strength, but has not yet become overbought. This is very rare and has happened only a few times. Dr . Zweig also points out that most bull markets begin with a Breadth Thrust.
More info can be found at www.investopedia.com
I have inspired by indicator introduced in TradingView by LazyBear and adopted the logic from there. Thanks LazyBear !!!
Though indicator signals the new Bull market, but I have not found much information how to use it in daily market. So I had come up with a strategy, which would allow us to trade SPY, QQQ , AMEX and securities under these markets.
I have used MA setting as 65 (since Zweig indicator setting was 10 days , based on that I set 65 for Hourly chart ... 10d x 6.5 Hrs = 65 in my startegy). You have to change this setting if you change the timeframe. Also , note that this strategy is for Stock Market only.
Strategy Rule/Settings
===================
Select the market type based on your security symbol.
SPY => use NYSE
QQQ => use NASDAQ
any other security => check exchange it was listed and select the corresponding market.
if you dont know , use COMBINED option
BUY
====
when indicator cross 0.40 from below
Note:
1. see how well it picks the bottoms ... example : Nov 2020 ....
2. setting 0.45 is also produces good results , only thing is you get more signals.
EXIT
=====
Exit when indicator cross down from 0.60 . I have used RSI (5) for partial exits. These two are available in settings
Close the whole position when indicator crossing down 0.40
STOP LOSS
=========
defaulted to 5%
Please Note , I have tested SPY , QQQ on Horly chart with MA 65. You need to chnage the MA setting based on your time frame and check the results.
WARNING
========
For the use of educational purposes only

BITCOIN AUTO TRADING STRATEGYBITCOIN AUTO TRADING STRATEGY
This strategy shows buy and sell signal. Designed and optimized only for Bitcoin. You can use it spot or futures markets and 30 minutes time frame. Indicator gives trade points when optimized sma trending but filtered choppinnes index. Profit factor over 3 for all time backtest period. Care using when you set leverage. I recommend maximum 5x leverage for auto trading.
Profitable trade count 119
Lost trade count 115
Profit factor 3
For access message me or go to my web link on my profile.

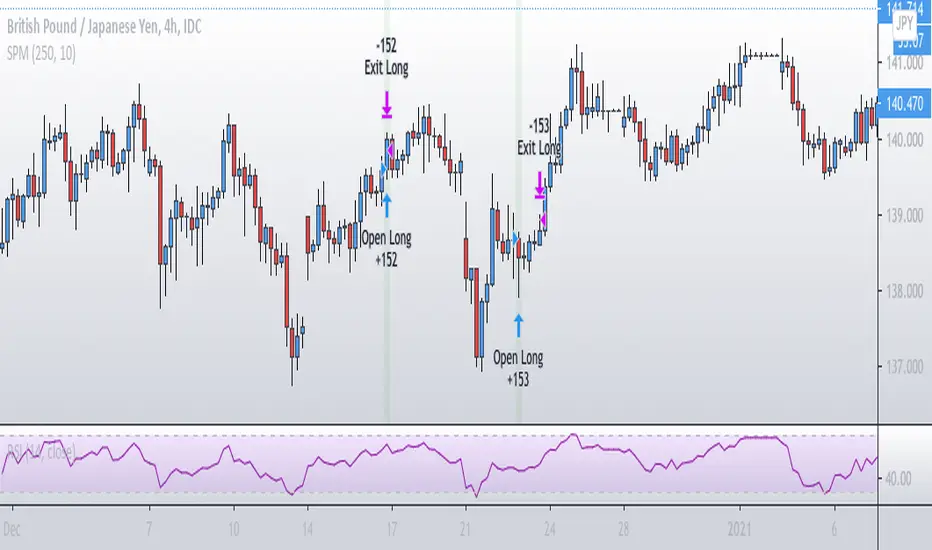
Simple Price MomentumSimple Price Momentum Strategy ( SPM )
The term momentum was borrowed from Newton’s first law of motion. The law states that where an object in motion tends to stay in motion until an external force is applied to it. Like in the law of physics, a market in motion tends to stay in motion rather than reverse. This is the reason why a momentum indicator strategy is so powerful.
My algorithm depends on two signals, an open and an exit.
Basically, while the Green shows earlier, the signal actually takes place at the end of the bar. Remember “close” source is the current price while the candle is still forming, because it can change its state it could create a situation where “A > B” and then change to “A < B”, so we don’t know which one is the final value until the bar officially ends. This is why the backtest engine opens a position in the bar after.
OBV Accumulation / Distribution Strategy CryptoThis version its made for 8-12h and works amazingly on the ETH pairs. Can be adapted to others as well
For this example, I used an initial 1$ account, using always full capital on each trade(without using any leverage), together with a 0.1% commission/fees for each deal, on Coinbase broker.
This is a long only strategy
The components for the inside of the strategy are the next one :
1. OBV Accumulation/Distribution
3. EMA
The rules here are simple : we check for cross up or above on OBV and EMAmoving average and after that we check for the trend direction based on ascending/descending OBV. Based on this we enter long or exit long.
RISK WARNING
Trading on any financial market involves a risk of loss. Please consider carefully if such trading is appropriate for you. Past performance is not indicative of future results.
If you have any questions or you are interested in trying it, private message me and I will give you as soon as I see the message a trial for it.
