TradeEasy - KintroThe TradingView script provided is a custom indicator named "TradeEasy - Kintro". It is created by the author Kintro and is designed to help traders identify potential buy and sell signals in the market. The indicator is based on the Exponential Moving Average (EMA) and uses two different EMAs, one with a period of 20 and the other with a period of 50.
The indicator is meant to be used on the 5-minute timeframe and it is recommended to use TradingView in Dark Mode for better appearance. The author also reminds users that no strategy works 100% accurately and backtesting should be done before trading with a real account. The author is not responsible for any losses incurred by traders.
The indicator uses a simple set of rules to generate trading signals. The thick line on the chart represents the 50 EMA while the thin line represents the 20 EMA. When the thin line crosses upwards over the thick line, it indicates a bullish signal. After the crossover, traders are advised to wait for the price to pullback between the two lines. A range should then be created while the price moves through the thin line.
On the break of the range, an entry signal is generated, and the stop loss should be set below the range. The author advises traders to exit their profits according to their own analysis or price action and not to re-enter on the next pullback of the same trend. The same rules apply when the thin line crosses downwards over the thick line.
The author emphasizes that range creation is mandatory on crossing and that traders should not try to go against the trend. If the price is above both lines, traders should only go for buy orders, and vice versa.
If there is no range created while crossing, traders are advised not to enter the market. Traders should wait for the opportunity and not force a trade.
The indicator also includes a plot of the 34 EMA, and a range is created above and below the price action using the "up" and "down" variables. The author uses the "fill" function to color the background of the chart to highlight the range. The "dummy" variable is used to plot circles above or below the price action, depending on the trend.
In summary, the "TradeEasy - Kintro" indicator is a custom indicator designed to help traders identify potential buy and sell signals based on the crossing of two EMAs. The author provides a set of rules to generate trading signals and advises traders to wait for the opportunity and not force a trade. The indicator also includes a visual representation of the range created on the chart. As always, traders are advised to conduct their own research and analysis before entering any trades.
Breakout

VWAP Bollinger Band Crossover Breakout with ResistanceCredit to © Jesus_Salvatierra for VWAP script
This script help you find a trend in momentum stock that is about to breakout and shows resistance point. This script utilizes Bollinger bands VWAP and is good for intra day charts.
VWAP, or Volume Weighted Average Price, is a technical analysis tool used to measure the average price a security trades at during a given time period, weighted by the trading volume for each price level. It is commonly used by traders and investors to identify the true average price of a security and to assess whether they are buying or selling at a fair price.
A Bollinger Band is a technical analysis tool that uses standard deviation to measure the volatility of a security. The Bollinger Band is typically composed of three lines: the upper band, the lower band, and the middle band. The middle band is a simple moving average of the security's price, while the upper and lower bands are calculated based on the standard deviation of the security's price.
A Bollinger Band crossover occurs when the price of a security crosses above or below one of the bands. When the price crosses above the upper band, it is considered overbought, while when it crosses below the lower band, it is considered oversold. Traders often use Bollinger Band crossovers as a signal to enter or exit a position, depending on their trading strategy.
The VWAP and Bollinger Band crossover are two separate technical analysis tools that can be used in conjunction with each other. When a security's price crosses above or below the Bollinger Band, traders may look to the VWAP to confirm whether the security is trading at a fair price. If the security is trading above the VWAP, it may be overvalued, while if it is trading below the VWAP, it may be undervalued. Similarly, traders may use the Bollinger Band crossover as a signal to enter or exit a position, while also taking into account the VWAP to assess whether the price is fair.

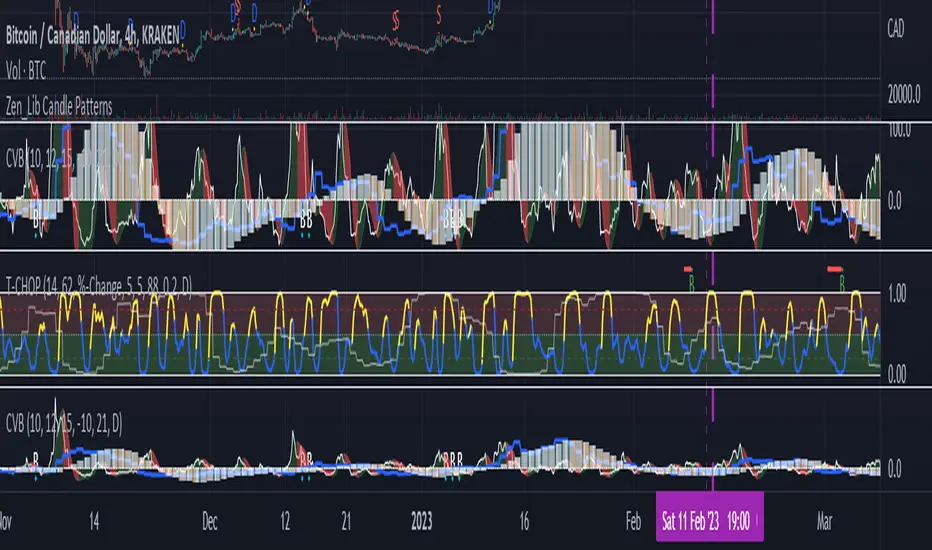
JZ_Chaikin HTF Volatility BreakoutFirst off, all credit to Harry Potter as this is a minor customization of his indicator.
Basic additions:
-- Added a Higher Timeframe that is set to Daily but can be changed. Timeframe does wait until barstate.isconfirmed so won't repaint.
-- Added HMA smoothing line to both Chart and HTF. Can be used as it's own signal, as confirmation or in combination with faster signal line -- Breakout signal & Range Highlight use both.
-- Added optional coloring of HMA based on whether increasing or decreasing.
-- Added a low volatility option that highlights Range/No Trade zones. Defval is off so needs to be selected from inputs.
Breakout Signals are very simple and both take the HTF signal and HMA. When the faster Volatility line rises from below zero and comes within the range of -10 to 0, AND the HMA signals is increasing (and also below zero) for confirmation, generates a breakout signal of an incoming big move. You can alter the breakout threshold to be greater or less than -10, I just found that works best for filtering out the noise and false signals. Won't catch everything, but pretty reliable when it does.
Tested mostly on BTC so can't vouch for other assets and would likely need modification.
I've JUST taught myself coding from scratch (and to say I'm an amateur is an understatement), so apologies in advance if anything is unclear or could be coded better. Open to any suggestions.
Pivot Trendlines with Breaks [HG]🧾 Pivot Trendlines and Breaks
A script meant to debut and provide an example usage of the Simple Trendlines library using Pine Script's built-in pivot system.
In under 50 lines of code, with inputs, plots, styling, and alerts included we're able to create trendlines with a breakout system.
▶️ How it works
Calculating pivot points helps traders identify moments at which the market's attitude can shift from bullish to bearish. In the background, the script tracks pivot events for trendlines and uses a system that prevents any leakage between the trendlines before they are drawn.
⚫️ Settings
Pivot Length
Color Adjustments
⚫️ Alerts

RSI Trendlines with BreakoutsA pivot-based breakout indicator that attempts to provide traders with a visual aid for finding breakouts on the RSI. Similar to how we use trendlines on our charts, using them on the Relative Strength Index can also give us a sense of direction in the markets.
This script uses its own pivot-based system that checks for real-time swing levels and triggers a new pivot event after every dip and nth bars. The breakout alerts that are given were not designed to be taken as signals since their purpose is to provide an extra bit of confluence. Because of this, I added no other conditions that try to make the alerts "perfect", but instead, print every breakout that is detected. Despite stating this, I did happen to add a condition that checks the difference in RSI and the breakout value, but that's as far as it'll go.
There are alerts built-in to the script, along with adjustable repainting options.
🔳 Settings
Lookback Range: Lookback period to trigger a new pivot point when conditions are met.
RSI Difference: The difference between the current RSI value and the breakout value. How much higher in value should the current RSI be compared to the breakout value in order to detect a breakout?
RSI Settings
Styling Options
🔳 Repaint Options
On: Allows repainting
Off - Bar Confirmation: Prevents repainting and generates alerts when the bar closes. (1 candle later)
🔳 How it Works
Before a trendline is drawn, the script retrieves the slope between the previous pivot point and the current. Then it adds or subtracts the slope x amount of times (based on the lookback range) from the current pivot value until the current x-axis is reached. By doing this we can get a trendline that will detect a breakout accurately.
The result
When using the RSI Difference condition, the script will print breakouts whenever the condition is true, because of this dotted lines were added to track where the alert was triggered.
🔳 Alerts

Breakout Identifier + Pivots with pos/neg/neu candlesBreakout Identifier is an indicator that displays breakouts which can be used to help a trader buy or sell. This is a volatility-based indicator that has customizable inputs. Each signal is also plotted with a pivot which can help to trade within a range or determine a trap.
To edit the gap between each signals change signal integer, goes by price.
BG colors are also assigned to candles as negative, positive, or neutral which are colored as follows:
Green = high > high of previous candle
Red = low < low of previous candle
Silver = neither of these options

Drip's 11am rule breakout/breakdown (OG)This indicator is based on Drippy2hard's 11:30 am (EST) rule.
In simple terms the rule states that:
If a trending stock makes a new high after 11:15-11:30am EST, there is a 75% chance of closing within 1% of High of day (HOD). Same applies for downtrend.
Please note:
Not all stocks will abide by this, this is backtested on stocks with avg daily volume > 2M and mostly mega cap stocks which have liquid option chains. The backtesting results show very promising results on $SPY/ $SPX so it is advised to trade $SPY/ $SPX using this indicator over any other stocks.
Although the name suggests 11 AM rule, the backtesting shows higher win rate for 11:30 AM so please select that option in the settings.
As always, no indicator is perfect and please follow your risk management and understand that indicators are tools to aid your trading and by no means they are supposed to work as intended in all scenarios
How the script works
1. A HOD/LOD zone is identified based on regular session (9:30am-11:30am) EST. Users can select cut off time to 11AM in the settings. These will be indicated on chart after 11/11:30pm depending on what user selected
2. If the stock breaks above the HOD and the ADX is showing strong momentum to upside then the candlesticks will start showing neon color, if the trend based on moving averages and candle closing is also bullish then the indicator will show trend arrows under the candle indicating to stay in the trade. Same applies for break below LOD, only the colors will change to represent downtrend.
3. An optional cloud is also shown if the trend is developed. The cloud can be used as trail stop or re entry point as long as it is displayed on chart
How to use the indicator in trading
In general, there are three scenarios which are trade worthy
1. If the stocks breaks out above the HOD zone and up trend develops or the stocks breaks below the LOD zone and downtrend develops. See images below
2. You can also use the LOD/HOD zone as demand/ supply if the Price action is range bound like this example below
Thanks for reading, please give thumbs up if you like using it! Please post comments on how to use it.

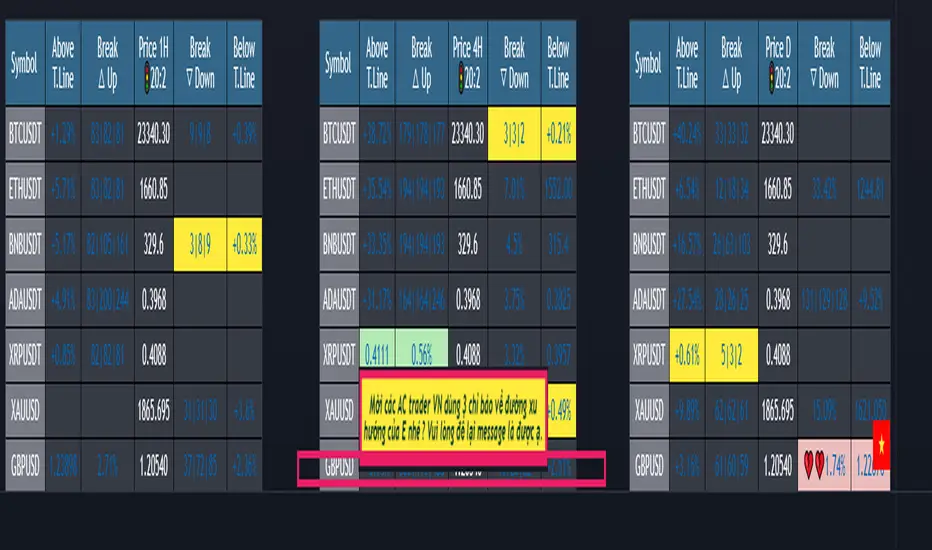
{20}Dashboard Trendlines & Wedge_Pro[vn]This is a script about 20 trading pairs with trendline.
-on each chart of a trading pair, there is only one trendline pair: 1 uptrendline and 1 downtrendline
-so when the statistics on the table also show the column of the uptrend and the column of the downtrend
-When the price approaches any trendline but the ratio is 1%, that trendline will be colored blue (downtrend), red (uptrend)
The column ✎ T.line-trendline above(✐ T.line-trendline below) is the value of the current trendline compared to the closing price of the candle
The ══════ \𝖗𝖊𝖘𝖎𝖘𝖙𝖆𝖓(𝖘𝖚𝖕𝖕𝖔𝖗𝖙 \══════) column when the price breaks will show ➊ (the is the first candle) and the percentage value when breaking through the point of the trendline.
Especially when a candle has closed above the trendline (assuming an uptrend), then from the 2nd tree to the current , it will count according to memory so that traders know when the price broke, and how many candles already.
The parameter when breaking is displayed < 10, it means that the price has broken through 10 candles, and the first 10 candles are colored yellow, then the color returns to normal.
In addition, when displaying 3 parameters as above, the next column (above/below T.line) will display the percentage from when the price breaks that point to the current price of the candle.
Wedge column is when the price is stuck between the upper and lower trendlines, if the sharp angle ratio is <=10%, the new column will show the value (and the text color is white) until it breaks to the bottom. 1 direction is left is hidden
Price column is the current price of the candle and the parameter 20:2 is the length of the trendline and to combine the same parameter with the indicator "Trendlines_pro "
You can change the time in Resolution indicator settings to show multiple time display the same cell as the price cell
The up arrow icons 🡹 represent the price broke upwards , the down arrows 🡻 represent the price broke below
------------------------------------------------------------------------------------------------------------------------------------------------------
Vietnamese
Đây là script về bảng thống kê 20 cặp giao dịch với đường trendline .
-trên mỗi biểu đồ của cặp giao dịch chỉ tồn tại duy nhất 1 cặp trendline là: 1trendline tăng và 1 trendline giảm
-vì vậy khi thống kê trên bảng cũng hiển thị cột của trend tăng và cột của trend giảm
-khi giá tiến gần đến 1 đường trendline bất kì mà tỉ lệ còn 1% thì đường trendline đó tô màu xanh(trend giảm) ,màu đỏ(trend tăng)
-cột ✎ T.line-đường trendline bên trên(✐ T.line-đường trendline bên dưới) là giá trị của đường trendline hiện tại so với giá đóng cửa của nến
-cột ══════ \𝖗𝖊𝖘𝖎𝖘𝖙𝖆𝖓(𝖘𝖚𝖕𝖕𝖔𝖗𝖙 \══════) khi giá phá vỡ sẽ thể thiện ➊(tức là cây nến đầu tiên) và giá trị phần trăm khi phá qua điểm của trendline.
-đặc biệt khi 1 cây nến đã đóng cửa trên đường trendline(giả sử trend tăng) thì từ cây thứ 2 đến hiện tại nó sẽ đếm theo bộ nhớ để các trader biết được giá đã phá khi nào,và qua bao nhiêu nến rồi.
-thông số khi phá vỡ hiển thị < 10 thì hiểu là giá đã phá vỡ qua 10 nến, và 10 nến đầu tiên được tô màu vàng ,sau đó màu trở lại trạng thái bình thường
-ngoài ra khi hiện thông số như trên thì cột bên cạnh (above/below T.line) sẽ hiển thị được số phần trăm tính từ khi giá phá vỡ điểm đó đến giá hiện tại của cây nến.
-cột Wedge(cái nêm) là khi giá đang bị kẹt giữa 2 đường trendline trên và dưới ,nếu tỷ lệ góc nhọn <=10% thì cột đó mới hiện giá trị (và màu chữ là trắng) cho đến khi phá vỡ về 1 hướng nào đó còn lại là bị ẩn
-cột giá là giá hiện tại của nến và thông số 20:2 là độ dài đường trendline và để kết hợp cùng thông số với chỉ báo "Trendlines_pro "
-các bạn có thể thay đổi thời gian trong cài đặt chỉ báo Resolution để hiển thị nhiều cung thời gian hiển thị cùng ô với ô giá
-các biểu tượng mũi tên lên 🡹 thể hiện giá phá vỡ lên trên ,mũi tên xuống 🡻 thể hiện giá đã phá vỡ xuống dưới
Cảm ơn mọi người đã quan tâm và tin dùng

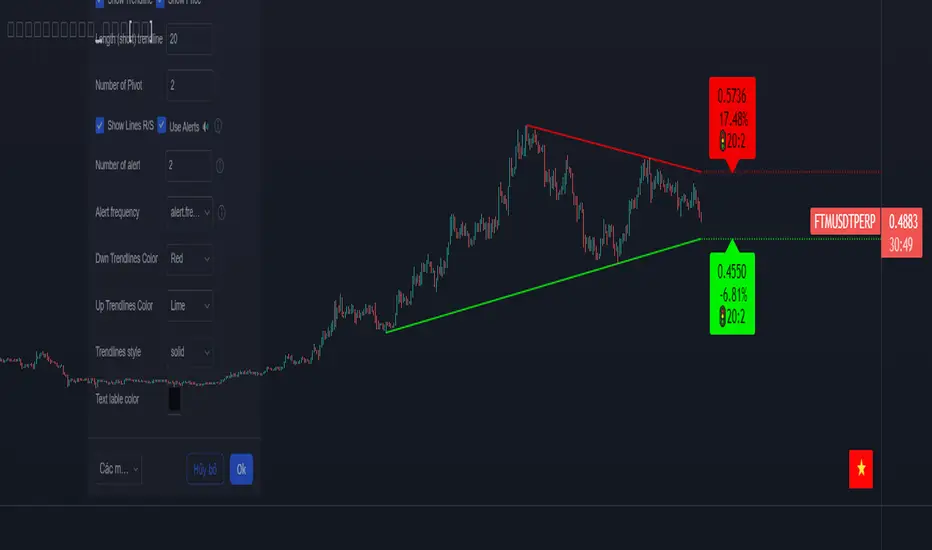
𝕋𝕣𝕖𝕟𝕕𝕝𝕚𝕟𝕖𝕤[𝕧𝕟]-This is an indicator for trendline traders
-Pine Script strategy draws pivot points and trendlines on the chart.
-This strategy allows the user to specify the interval to calculate the pivot points and the number of pivot points used to generate the trend lines .
-when an up (or down) trendline is drawn according to the settings in the indicator's settings, that line is support and resistance so we can proceed to make BUY or SELL points according to the support strategy. and resistance
-when the price line breaks above or below the trendline, the price has reversed to the nearest trendline (like the examples in the pictures below.)
-The horizontal lines of the trend line , after being broken, it will form a support or resistance area , and it is likely that the price will retest that area to continue following the broken trend.
-----------------------------------------------------------------------------------
Vietnamese
-Đây là chỉ báo dành cho các trader thuộc trường phái phân tích đường xu hướng
-Chiến lược Pine Script vẽ các điểm trục và đường xu hướng trên biểu đồ.
-Chiến lược này cho phép người dùng chỉ định khoảng thời gian tính toán các điểm xoay và số điểm xoay được sử dụng để tạo các đường xu hướng .
-khi đường xu hướng tăng(hoặc giảm) được vẽ ra theo các thiết lập trong cài đặt của chỉ báo,thì đường đó là hỗ trợ,kháng cự để ta có thể tiến hành thực hiện điểm BUY hoặc SELL theo chiến lược hỗ trợ và kháng cự
-khi đường giá mà phá vỡ lên trên hoặc xuống dưới đường xu hướng thì giá đã đảo chiều ngược với đường xu hướng gần nhất (như các ví dụ trong các hình dưới đây.)
-Những đường nằm ngang của đường xu hướng sau khi bị phá vỡ nó sẽ hình thành cho ta là vùng hỗ trợ hoặc kháng cự mà rất có thể giá sẽ kiểm tra lại vùng đó để tiếp tục theo xu hướng bị phá vỡ.
here are some pictures when using this trendline indicator(dưới đây là một số hình ảnh khi dùng với chỉ báo trendline này)
---------------------------------------------------------------------------------------------------------------------------------------------------
*break above trendline to form an uptrend(phá vỡ đường trendline bên trên để hình thành xu hướng tăng giá)
*Break the below trendline to form a downtrend(phá vỡ đường trendline bên dưới để hình thành xu hướng giảm giá)
*Support and resistance areas are created by two rising and falling trendlines(Vùng hỗ trợ,kháng cự được tạo ra bởi 2 đường trendline tăng và giảm)
*price is stuck between 2 up and down trendlines (wedge pattern)
giá đang bị kẹt giữa 2 đường trendline tăng và giảm(mô hình cái nêm)
*Adjust the length ,short parameters of the trendline(điều chỉnh độ dài ,ngắn các thông số của đường xu hướng)
- for the "Full Trend Lines" script, please visit the following page🎯🎯🎯:

[TTI] Minervini's Stock Under Pressure––––History & Credit––––
📚 Credit: This script is inspired by Mark Minervini's book, "Trade Like a Stock Market Wizard". The book is a must-read for any stock trader or investor, and it's where the idea for this indicator came from.
–––––What it does––––
💡 What it does: The Minervini's Stock Under Pressure Indicator is a powerful tool for stock traders and investors. It helps to identify when a stock is under pressure and less likely to breakout and continue its upward movement.
📈 How it works: The indicator uses price action and various moving averages to calculate when a stock is under pressure. It provides a clear signal in the when a stock is struggling to move higher by printing puple color on the pane, so you can adjust your trading strategy accordingly.
–––––How to use it––––
👨💼 How to use it: You can use the Minervini's Stock Under Pressure Indicator as an additional criteria while deciding whether a stock is likely to breakout. If the indicator is showing that the stock is under pressure, then you may want to wait for a better entry point or avoid the stock altogether. Remember trading is probabilities game.
📊 Calculations: The indicator is based on a complex calculation, but you don't need to worry about the details. All you need to do is to look for the signal and act accordingly.
💻 Installation: To use the indicator, simply install it on your TradingView chart and adjust the settings as necessary. You can customize the indicator to fit your trading style and preferences.
🚀 Get ready to trade like a stock market wizard with the Minervini's Stock Under Pressure Indicator!

Volume Breakouts v2The Volume Breakouts Indicator 2.0 is a comprehensive improvement on its predecessor "Volume Breakouts" with new features and improved performance. It offers high customization options where almost every aspect can be changed to suit your preferences.
The main functionality of the indicator is to display volume that exceeds a certain level of relative volume with a specific color, and now it also differentiates between strong up and strong down days. The legacy mode from the previous version is still available, and the calculation error has been corrected in the legacy mode.
Volume Bars in their default configuration are determined by the following factors: Up and Down days, relative volume , and a strong/weak close range. The strong/weak close range is determined by marking bars with a "strong" color only if the close price is higher/weaker than 60% or 40% of the candlestick range - otherwise the color gets downgraded by one level (for example from strong green upday to medium strong blue upday). The main options for Volume Bars are the "Multipliers", where a multiplier of 1.5 represents 150% relative volume . For example, if there is an up day closing above 60% of its range and the volume is above the defined moving average threshold times the multiplier, the bar will be colored green.
(the option: "Strong/week close range" is optional and can be disabled)
Upday and multiplier 2: green
Upday and multiplier 1: blue
Downday and multiplier 2: red
Downday and multiplier 1: pink
The indicator also integrates Pocket Pivots , which are displayed as "star" icons above the current volume bar. There are two types of Pocket Pivots:
The day's volume should be larger than the highest down volume day over the prior 10 days (Rule No. 3, Chris Kacher)
If the pocket pivot occurs in an uptrend after the stock has broken out, it should act constructively around its 10-dma." The star will appear in black if the first condition is met and red if the second condition is met. (Rule No. 4, Chris Kacher)
The signal (star) will appear in black if the first condition is met and red if the second condition is met.
A new addition to the indicator is the Dashboard of different variables, which can be individually enabled or disabled. These variables include:
Actual volume: the volume of the most recent bar
Actual dollar volume: the amount of $ traded on the most recent bar
Average volume: the average volume over a defined period of time (same as moving average)
Average dollar volume: the amount of $ traded over a defined period of time (same as moving average)
Relative volume: the relative value of the current bar compared to the moving average of the volume
Up/down volume ratio: the total of the stock's volume on days when it closes up divided by the volume traded on days when the stock closed down. The assumption is that if a stock closes up for the day, the volume was buying induced and thus the stock is under accumulation
Free floating shares: Free float, also known as public float, refers to the shares of a company that can be publicly traded and are not restricted (for example held by insiders)
Rocket Ratio: Is a value (Formula: Float/AvgVolume) which measures the liquidity of the stock. A lower value means that fewer shares can move the stock fast. The default threshold is < 150
All colors can be customized, and there is also a predefined option for dark mode.

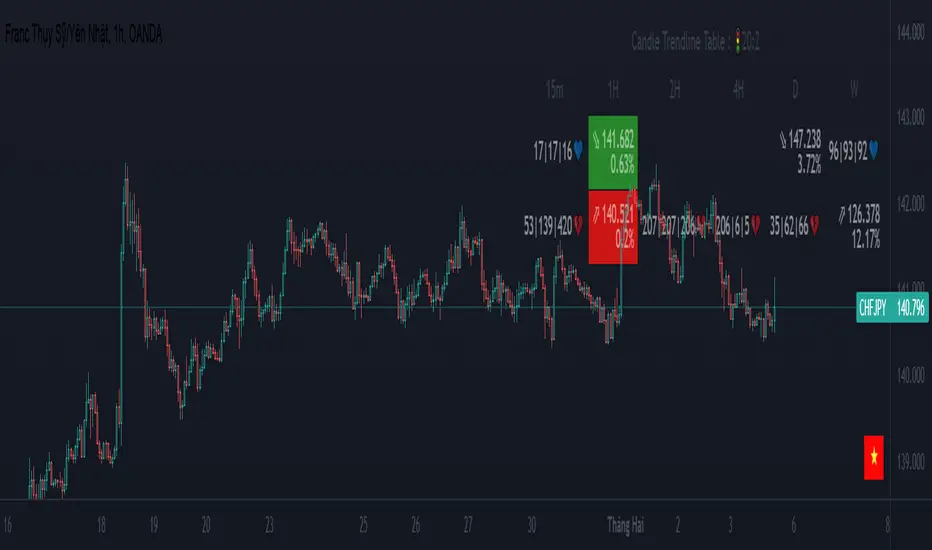
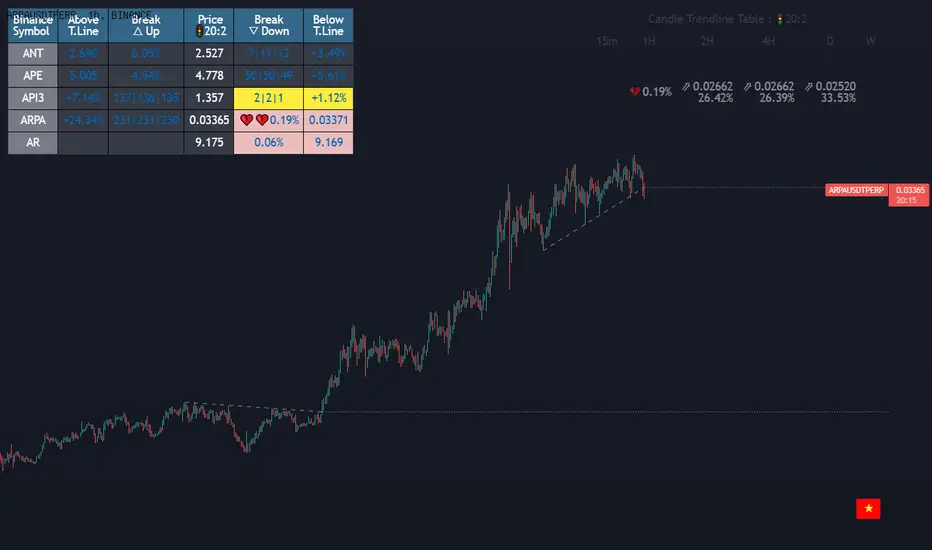
MTF Trendlines_Pro[vn]-This is an indicator for trendline traders
-it statistics the upper and lower trend lines of the Multi Time Frame.
-Pine Script strategy draws pivot points and trendlines on the chart.
-This strategy allows the user to specify the interval to calculate the pivot points and the number of pivot points used to generate the trend lines.
-I use the "Trendlines_Pro " indicator to interpret the indicator "MTF trendlines_Pro " indicator for everyone to understand
-time frames are selected in settings like 1m,3m,15m,1h,2h,4h,6h,12h,1D.1W.1Month..
-If the price is in a wedge pattern, it is represented by the upper and lower parameters, the upper parameter is the resistance point of the upper trendline,the lower parameter is the support point of the below trendline
-when the price distance is <=1% from the trendline, the upper or lower parameter is colored blue (above) or red (below).
-when only the parameter is accompanied by the ⇗ or ⇘. symbol, it tells us that the price has not broken the corresponding trend line
-when showing green heart and % break .indicates that the price has broken the downtrend line to become an uptrend.
On the contrary, the red heart % breaks, it signals us to break the uptrend line to become a downtrend
-when showing parameters 12(1)|18(2)|20(3) and green heart, then :(3) shows that the price has broken out before 20 candles, (2) shows that there are 18 candles to close above The breakout point, (1) represents the last 12 candles that closed above the breakout point and as if a nice uptrend has occurred because 98% of the candles have closed above the breakout point....the opposite of The red heart is the price that broke below the trendline below.
-"MTF trendlines_Pro "indicator is integrated for both the trendline of the price line and the RSI. You can change it in the settings as shown below.
----------------------------------------------------------------------------
vietnamese
-Đây là chỉ báo dành cho các trader thuộc trường phái phân tích đường xu hướng
-nó thống kê các đường xu hướng trên và dưới của Multi Time Frame.
-Chiến lược Pine Script vẽ các điểm trục và đường xu hướng trên biểu đồ.
-Chiến lược này cho phép người dùng chỉ định khoảng thời gian tính toán các điểm xoay và số điểm xoay được sử dụng để tạo các đường xu hướng .
-tôi có dùng chỉ báo trendline_pro dùng để diễn giải chỉ báo MTF trendlines_pro cho mọi người dễ hiểu
-các khung thời gian được lựa chọn trong cài đặt như 1m,3m,15m,1h,2h,4h,6h,12h,....
-Nếu giá đang trong mô hình cái nêm thì được thể hiện bằng tham số trên và tham số dưới, tham số trên là điểm kháng cự của đường xu hướng bên trên,tham số dưới là điểm hỗ trợ của đường xu hướng bên dưới
-khi giá cách đường xu hướng <=1% thì tham số trên hoặc dưới được tô màu xanh (trên) hoặc đỏ(dưới)
-khi chỉ có tham số kèm theo biểu tượng ⇗ or ⇘.thì cho ta biết là giá chưa phá vỡ được đường xu hướng tương ứng
-khi hiện trái tim xanh và % phá vỡ .báo hiệu cho ta biết giá đã phá vỡ đường xu hướng giảm trở thành xu hướng tăng.
ngược lại trái tim đỏ % phá vỡ thì báo hiệu cho ta phá vỡ đường xu hướng tăng trở thành xu hướng giảm
-khi hiện thông số 12(1)|18(2)|20(3) và trái tim xanh thì :(3) thể hiện giá đã phá vỡ trước đó 20 nến,(2) thể hiện có 18 cây nến đóng cửa trên điểm phá vỡ,(1) thể hiện có 12 nến gần nhất đóng cửa trên điểm phá vỡ và như vạy xu hướng tăng đẹp đã xảy ra vì chiếm đến 98% nến đã đóng cửa trên điểm phá vỡ....ngược lại với trái tim đỏ là giá đã đột phá xuống dưới đường xu hướng bên dưới
-chỉ báo MTF trendlines_pro được tích hợp chung cho cả trendline của đường giá và RSI .các bạn có thể thay đổi trong phần cài đặt như hình bên dưới.
Trendlines_Pro[vn]- This is an indicator for trendline traders
-Pine Script strategy draws pivot points and trendlines on the chart.
-This strategy allows the user to specify the interval to calculate the pivot points and the number of pivot points used to generate the trend lines.
-when an up (or down) trendline is drawn according to the settings in the indicator's settings, that line is support and resistance so we can proceed to make BUY or SELL points according to the support strategy. and resistance
-when the price line breaks above or below the trendline, the price has reversed to the nearest trendline (like the examples in the pictures below.)
-The horizontal lines of the trend line, after being broken, it will form a support or resistance area, and it is likely that the price will retest that area to continue following the broken trend.
Vietnamese
-Đây là chỉ báo dành cho các trader thuộc trường phái phân tích đường xu hướng
-Chiến lược Pine Script vẽ các điểm trục và đường xu hướng trên biểu đồ.
-Chiến lược này cho phép người dùng chỉ định khoảng thời gian tính toán các điểm xoay và số điểm xoay được sử dụng để tạo các đường xu hướng .
-khi đường xu hướng tăng(hoặc giảm) được vẽ ra theo các thiết lập trong cài đặt của chỉ báo,thì đường đó là hỗ trợ,kháng cự để ta có thể tiến hành thực hiện điểm BUY hoặc SELL theo chiến lược hỗ trợ và kháng cự
-khi đường giá mà phá vỡ lên trên hoặc xuống dưới đường xu hướng thì giá đã đảo chiều ngược với đường xu hướng gần nhất (như các ví dụ trong các hình dưới đây.)
-Những đường nằm ngang của đường xu hướng sau khi bị phá vỡ nó sẽ hình thành cho ta là vùng hỗ trợ hoặc kháng cự mà rất có thể giá sẽ kiểm tra lại vùng đó để tiếp tục theo xu hướng bị phá vỡ.
Sup/Res Levels [QuantVue]Shows basic pivot point of support and resistance levels. Will show alerts for break of sup. or res. Allows for a volume filter for sup. res. breaks as well.
"B" means break of either a Sup. or Res. level with volume greater than the threshold.
"Bull/Bear Wick" means bullish/bearish candle on break.
Left - number of bars left hand side of the pivot .
Right - number of bars right hand side of the pivot .
Volume Thres. - the threshold value (%) for the Volume.
This indicator is useful to filter our insignificant breaks of sup. or res. Can help trader determine when to sit on their hands, or enter a trade.

Fibonacci Breakout Target LevelsFibonacci Extension
Fibonacci Extension is a powerful technical analysis tool that traders use to predict where the market might find support and resistance. It is based on the Fibonacci sequence and uses levels that are found by extending the 23.6%, 38.2%, 50%, 61.8%, and 100% Fibonacci ratios from a swing high or low. These levels can be used to find possible areas of support and resistance, and traders often use them to figure out when to get into or get out of a trade.
What does this indicator do?
This indicator gets five levels of the Fibonacci Extension and uses it for both the low and the high. The default lookback period is 10 days, and it checks for the highest and lowest price in that period. Then it calculates the extension levels and plots them, and it also adds a line that shows you the current breakout target levels.
How to use?
The primary use intended for this indicator is to be used to determine possible breakout target levels. Let's say you are trading a range and a breakout happens. You can use this indicator to determine possible take-profit zones and possible support and resistance zones.
Features:
Change the lookback period for the Fibonacci Extension levels.
Disable the Fibonacci Bands if you just want to see the FIB levels.
You can also change the 5 levels and add different Fibonacci numbers.
In this image, you can see how you can use this indicator to determine take-profit levels. The Fibonacci Extensions will determine potential support and resistance levels, which could be good places to exit your long or short positions.

(1-20)Dashboard trendlines PriceThis is a script about 20 trading pairs with trendline.
-on each chart of a trading pair, there is only one trendline pair: 1 uptrendline and 1 downtrendline
-so when the statistics on the table also show the column of the uptrend and the column of the downtrend
-When the price approaches any trendline but the ratio is 1%, that trendline will be colored blue (downtrend), red (uptrend)
-the column above T.line(below T.line) is the value of the current trendline compared to the closing price of the candle
-The Break up (Break down) column when the price breaks will show the green heart (break up), the red heart break (break down) and the percentage value when breaking through the point of the trendline.
-price column is the current price of the candle
-especially when a candle has closed above the trendline (assuming an uptrend), then from the 2nd tree to the current , it will count according to memory so that traders know when the price broke, and how many candles already.
-The breakdown parameter is displayed (for example, 3|8|10), which means that the price has broken through 10 candles, of which 8 trees are closing above the breakout point, and the last 3 are closing above. break point
-In addition, when displaying 3 parameters as above, the next column (above/below T.line) will display the percentage from when the price breaks that point to the current price of the candle.
-you can change the time in Resolution indicator settings to show multiple time arcs
Thank you everyone for your interest and trust
- 5 pairs are free for traders :https://vn.tradingview.com/script/KGSjrLC3/
---------------------------------------------------------------------------------
Vietnamese
Đây là script về bảng thống kê 20 cặp giao dịch với đường trendline .
-trên mỗi biểu đồ của cặp giao dịch chỉ tồn tại duy nhất 1 cặp trendline là: 1trendline tăng và 1 trendline giảm
-vì vậy khi thống kê trên bảng cũng hiển thị cột của trend tăng và cột của trend giảm
-khi giá tiến gần đến 1 đường trendline bất kì mà tỉ lệ còn 1% thì đường trendline đó tô màu xanh(trend giảm) ,màu đỏ(trend tăng)
-cột above T.line(below T.line) là giá trị của đường trendline hiện tại so với giá đóng cửa của nến
-cột Break up(Break down) khi giá phá vỡ sẽ thể thiện trái tim xanh(phá vỡ lên),trái tim đỏ vỡ(phá vỡ xuống) và giá trị phần trăm khi phá qua điểm của trendline.
-cột giá là giá hiện tại của nến
-đặc biệt khi 1 cây nến đã đóng cửa trên đường trendline(giả sử trend tăng) thì từ cây thứ 2 đến hiện tại nó sẽ đếm theo bộ nhớ để các trader biết được giá đã phá khi nào,và qua bao nhiêu nến rồi.
-thông số khi phá vỡ hiển thị (ví dụ là 3|8|10) thì hiểu là giá đã phá vỡ qua 10 nến, trong đó có 8 cây đóng cửa trên điểm phá vỡ,và 3 cây gần nhất đang đóng cửa trên điểm phá vỡ
-ngoài ra khi hiện 3 thông số như trên thì cột bên cạnh (above/below T.line) sẽ hiển thị được số phần trăm tính từ khi giá phá vỡ điểm đó đến giá hiện tại của cây nến.
-các bạn có thể thay đổi thời gian trong cài đặt chỉ báo Resolution để hiển thị nhiều cung thời gian
Cảm ơn mọi người đã quan tâm và tin dùng
MATHR3E RAMP-MA█ OVERVIEW
MATHR3E RAMP-MA (R-MA) is a trend following indicator.
█ CONCEPTS
Disclaimer:
MATHR3E RAMP-MA indicator is intended for advanced traders and may fit your profile, whether you are a day trader or a long-term investor.
It was originally developed by a renowned market analyst and documented in numerous books. Among them is the author Jason Perl.
It is recommended to have read the trading techniques mentioned in the books covering this indicator beforehand.
How to use:
MATHR3E RAMP-MA is useful for determining if a market is trending and when so, to procure entry points to initiate a trade in line with the expected directional move.
It can be applied to markets as a stop-loss, as well as a low-risk entry qualifier in conjunction with other indicators of the same author.
Moving Average (R-MA I):
Only displayed when market is trending
• Bull trend: Green (moving avg Lows/Period)
• Bear trend: Red (moving avg Highs/Period)
Moving Average (R-MA II):
Always displayed
• Bullish outlook on the market: the 3-day moving average must be positioned above the 34-day moving average
• Bearish outlook on the market: the 3-day moving average must be positioned below the 34-day moving average
█ FEATURES & BENEFITS
Versatile:
This indicator is based on relative price action, so you can apply it to any market or time frame without having to change the default settings.
Rate of Change:
The ROC is calculated for the fast and slow periods of the R-MA (II).
R-MA (II) is colored blue when its rate of change is advancing and maroon when it is declining.
Breakout Qualifier:
A close above/below the moving average R-MA (I) that is confirmed by the following price bar's opening price
Materialized on chart with Flags:
• Green when bear trend ends
• Red when bull trend ends
Alerts
Get notified on:
• UpTrend breakout
• DnTrend breakout
• Any breakout Signal

Dashboard trendlines Price(ichimoku14642)Happy new year 2023
Dedicated to traders, the trendline indicator of 5 trading pairs is automatically listed in this table. Wish success
-on each chart of a trading pair, there is only one trendline pair: 1 uptrendline and 1 downtrendline
-so when the statistics on the table also show the column of the uptrend and the column of the downtrend
-When the price approaches any trendline but the ratio is 1%, that trendline will be colored blue (downtrend), red (uptrend)
-the column above T.line(below T.line) is the value of the current trendline compared to the closing price of the candle
-The Break up (Break down) column when the price breaks will show the green heart (break up), the red heart break (break down) and the percentage value when breaking through the point of the trendline.
-price column is the current price of the candle
-SYMBOL is all taken from Binance in the perpetual contract
-especially when a candle has closed above the trendline (assuming an uptrend), then from the 2nd tree to the current , it will count according to memory so that traders know when the price broke, and how many candles already.
-The breakdown parameter is displayed (for example, 3|8|10), which means that the price has broken through 10 candles, of which 8 trees are closing above the breakout point, and the last 3 are closing above. break point
-In addition, when displaying 3 parameters as above, the next column (above/below T.line) will display the percentage from when the price breaks that point to the current price of the candle.
Thank you everyone for your interest and trust
Đây là script về bảng thống kê đường trendline .
-trên mỗi biểu đồ của cặp giao dịch chỉ tồn tại duy nhất 1 cặp trendline là: 1trendline tăng và 1 trendline giảm
-vì vậy khi thống kê trên bảng cũng hiển thị cột của trend tăng và cột của trend giảm
-khi giá tiến gần đến 1 đường trendline bất kì mà tỉ lệ còn 1% thì đường trendline đó tô màu xanh(trend giảm) ,màu đỏ(trend tăng)
-cột above T.line(below T.line) là giá trị của đường trendline hiện tại so với giá đóng cửa của nến
-cột Break up(Break down) khi giá phá vỡ sẽ thể thiện trái tim xanh(phá vỡ lên),trái tim đỏ vỡ(phá vỡ xuống) và giá trị phần trăm khi phá qua điểm của trendline.
-cột giá là giá hiện tại của nến
-SYMBOL là toàn bộ lấy của sàn Binance trong hợp đồng vĩnh cửu
-đặc biệt khi 1 cây nến đã đóng cửa trên đường trendline(giả sử trend tăng) thì từ cây thứ 2 đến hiện tại nó sẽ đếm theo bộ nhớ để các trader biết được giá đã phá khi nào,và qua bao nhiêu nến rồi.
-thông số khi phá vỡ hiển thị (ví dụ là 3|8|10) thì hiểu là giá đã phá vỡ qua 10 nến, trong đó có 8 cây đóng cửa trên điểm phá vỡ,và 3 cây gần nhất đang đóng cửa trên điểm phá vỡ
-ngoài ra khi hiện 3 thông số như trên thì cột bên cạnh (above/below T.line) sẽ hiển thị được số phần trăm tính từ khi giá phá vỡ điểm đó đến giá hiện tại của cây nến.
Cảm ơn mọi người đã quan tâm và tin dùng
Donchian Cloud Score w/ TableThis indicator contains a set of 5 Donchian channels (upper, lower, and basis plotted) defaulted to lengths of 25, 50, 100, 150, and 200. A set of conditions associated with the channels aims to determine ranging versus trending markets. Weights are given to these conditions accordingly, then tallied up to determine the "cloud score", ranging between -25 and 25. For the purposes of this indicator, a ranging market is determined by a cloud score between -10 and 10, while a positive trending market has a score higher than 10 and a negative trending market has a score lower than -10. This score is accompanied by altered bar color to reflect the score - gray for ranging markets, green for positive trending markets, and red for negative trending markets. Breaking of upper or lower Donchian bands is typically a good indication of a potential breakout. Having a weighted system for these conditions will provide more insight and layers of confirmation into a Donchian breakout trading strategy. The table will reflect these values through positive, negative, and neutral coloration.
The list of conditions and their associated weights for this indicator are as follows:
- Broke the 25-length DC (DC(25)) upper band in the previous 3 bars - +1 if true, 0 if false
- Broke the DC(50) upper band in the previous 3 bars - +2 if true, 0 if false
- Broke the DC(100) upper band in the previous 3 bars - +3 if true, 0 if false
- Broke the DC(150) upper band in the previous 3 bars - +4 if true, 0 if false
- Broke the DC(200) upper band in the previous 3 bars - +5 if true, 0 if false
- Broke the DC(25) lower band in the previous 3 bars - -1 if true, 0 if false
- Broke the DC(50) lower band in the previous 3 bars - -2 if true, 0 if false
- Broke the DC(100) lower band in the previous 3 bars - -3 if true, 0 if false
- Broke the DC(150) lower band in the previous 3 bars - -4 if true, 0 if false
- Broke the DC(200) lower band in the previous 3 bars - -5 if true, 0 if false
- DC(25) basis line above the DC(50) basis line - +1 if true, -1 if false
- DC(25) basis line above the DC(100) basis line - +1 if true, -1 if false
- DC(25)basis line above the DC(150) basis line - +1 if true, -1 if false
- DC(25) basis line above the DC(200) basis line - +1 if true, -1 if false
- DC(50) basis line above the DC(100) basis line - +1 if true, -1 if false
- DC(50) basis line above the DC(150) basis line - +1 if true, -1 if false
- DC(50) basis line above the DC(200) basis line - +1 if true, -1 if false
- DC(100) basis line above the DC(150) basis line - +1 if true, -1 if false
- DC(100) basis line above the DC(200) basis line - +1 if true, -1 if false
- DC(150) basis line above the DC(200) basis line - +1 if true, -1 if false

Cuban's Range PositioningCuban's Range Positioning is the primary backbone of Cuban's Asset Screener and a fantastic standalone market screening tool.
Range Positioning allows the trader to monitor the positioning of over 200+ Binance and Bybit Futures assets within a single window, with a standard measurement of performance, and also with custom watchlist support.
The range calculation itself uses the unique logic of Cuban's Donchian Suite, retaining highs and lows until the opposite side of the range is tagged.
When viewed historically, the Range Positioning screener allows traders to monitor any assets that are continually pushing range highs and lows, identify outliers, and track trending sectors relative to the rest of the market. This script makes this identification easier for the user by making assets that aren't approaching highs or lows, transparent.
Included within this indicator is the option to redenominate the quote asset of all assets on screen using the current chart ticker.
Within the user inputs, the user gains the ability to customize the following:
Range lookback
Asset redenomination
Location of the asset table
Percentage of assets highlighted or made transparent
Dynamic labelling offset
Over 200+ Binance and Bybit Futures assets
TO DO:
Customize number of assets on screen
Allow values beyond the initial range

Stockbee Momentum BurstThis is a script to color code bars based on the bullish- and bearish combination.
Bullish Combination
Percent: Price >= 4% from yesterday and Volume today > Yesterday
Dollar: Price >= 0.9 dollar from open
Base Requirements
- Price > Yesterday's close
- Price > Open
- Price is within 30% of high
- Todays price range >= Yesterdays price range
- Yesterday's move <= 2%
- Volume >= 100 000
Bearish Combination
Percent: Price <= 4% from yesterday and Volume today > Yesterday
Dollar: Price <= 0.9 dollar from open
Base Requirements
- Price < Yesterday's close
- Price < Open
- Price is within 30% of low
- Todays price range >= Yesterdays price range
- Yesterday's move >= -2%
- Minimum volume for each of last 3 days >= 100 000
Momentum Filter
These are based on the 10 and 20 EMA crossover, where the former above would indicate upward momentum and below downward momentum. This can help to narrow down the color code to continuation phases. The linked option will override all other momentum filters, bullish candles will be displayed when EMA 10 > 20 and bearish candles when EMA 10 < 20.

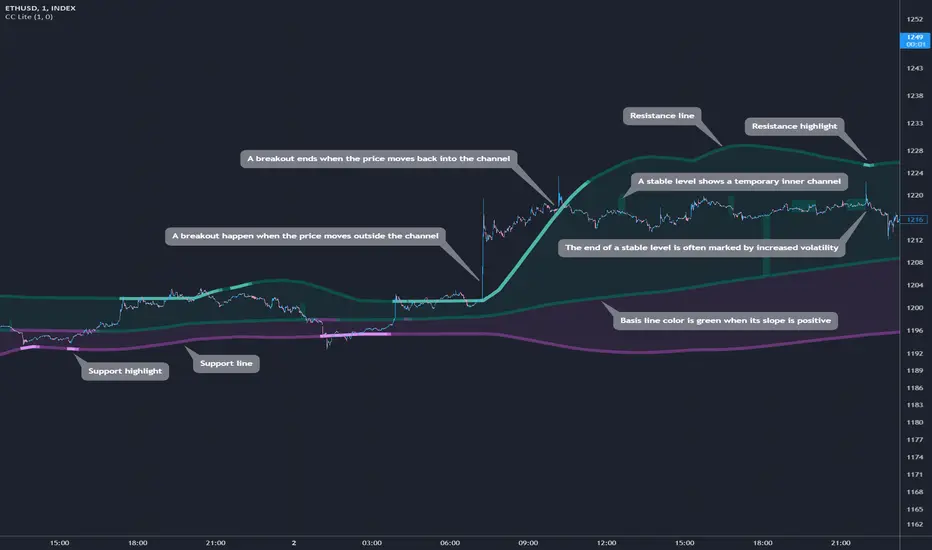
Cosmic Channel LiteCosmic Channel Lite ( CC Lite) draws dynamic non-repainting trendlines and helps
⭐ know when a breakout is about to begin
⭐ predict the position and timing of the next swing reversal
⭐ predict sudden changes in volatility
⭐ recognize whether the price is in bearish or bullish territory
👀 HOW IT WORKS
Cosmic Channel Lite draws a dynamic channel consisting of a support line, basis line and resistance line. These are calculated by applying the Reduced Median Method to groups of moving averages of different type over several periods each, effectively taking 20 data points and reducing them to 3. In between, 6 internal levels are left to give context inside the channel with stable levels, the extremes of which help highlight the SR lines (see chart). The basis line color is determined by its smoothed angle with positive angles in green and negative in purple. The aim of this indicator is to provide a consistent and generic price context that works out-of-the-box and accordingly the settings have been stripped to the bare minimum with no need to continually adjust them.
📗 HOW TO USE IT
The Cosmic Channel Lite plots are meant to be used as a guide for entering and exiting positions and setting stop-loss and take profit levels. The indicator is deemed effective for any particular timeframe as long as the price stays within the maximum bounds of the indicator's plots. For this reason it is recommended to use Cosmic Channel Lite in a multi-chart layout where each chart has a different timeframe. The 5 primary strategies are:
long when the price reverses off of the support line and short when the price reverses off of the resistance line
long when the support line is highlighted and short when the resistance line is highlighted
long when the price breaks above the resistance line and short when the price breaks below the support line
long when the price moves above the basis line after being below it for a prolonged period and visa-versa (short when the price moves below the basis line)
long/short in the direction the price takes after a stable level ends
🔔 SMART ALERTS
Get notified at the most critical times by settings just one alert. Simply select CC Lite and Any alert() function call as the conditions when creating an alert and you will be tipped-off on bar-close as follows:
R─ (resistance line is highlighted)
S─ (support line is highlighted)
For example, an alert such as CC Lite 6h R─ would mean that during the last 6-hour bar the resistance line has been highlighted. The highlight lasts at least 15 bars from the first highlight bar regardless of price action.
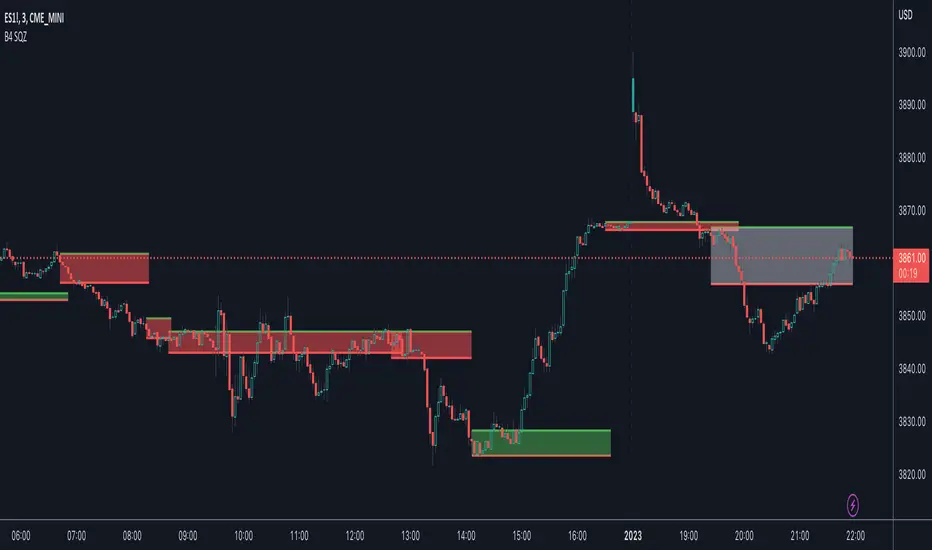
B4Signals Indicator Premium Addon SqueezeB4 Squeeze is a chop zone indicator that finds potential breakouts in Realtime. It filters price action to Identify and draw a squeeze threshold (chop zone) live on your upper chart. It identifies both Squeeze Zones and Breakouts/Breakdowns.
How it works?
- The script finds highest/lowest bars during the SQZ according to the ”B4Signals Indicator“.
- By using the direction and highest/lowest bar info it calculates SQZ Zones in realtime .
- The Indicator helps you stay out of the chop during the SQZ and allows you to exploit explosive moves when it breaks out.
- When price exits the SQZ threshold, price will usually explode up or down changing the color of the box to indicate breakout direction.
- Then SQZ Zone extends automatically if there is no breakout.