Open DriveOpen Drive is a market profile concept introduced by Jim Dalton. It occurs when the price moves directionally and persistently for the first 30 minutes from the cash market open.
It is necessary to use 30-minute bars as there needs to be enough time to measure an extreme move of the cash open. This means there will be fewer trades than other strategies using faster time periodicities.
The script finds open drives from these time points 0700/ 0800 and 1300/1430.
The entry signal also has a breakout threshold using the 5-bar high and 5-bar low to only take trades moving away from the prior 5-bar range. This weeds out most mid-range trades and small range expansion bars.
If the price has had a strong move from the open and has broken either below the prior 5-bar low or above the prior 5-bar high by an amount equal to the prior 5-bar range a trade is entered in the direction of the move.
The Exit criteria; exit after 3 bars which is 90mins when using a 30min periodicity.
Note, this script is shared to show that momentum generated on or around the cash open tends to persist. The entry and exits of this strategy are quite naive but there are plenty of ways to take more aggressive entries on faster time frames when an open drive occurs. The times chosen for this strategy will suit stock index futures mainly. The user can experiment with other futures products and their corresponding pit/ cash open hours.
Google "open drive market profile" for more information on open drives and market profile concepts.
Happy trading!
Breakoutsignal

SBS AlgoHello traders, I am here again with a new and improved indicator.
This indicator is based on a pivot breakout algorithm which gives buy and sell signals according to the breakout of trendline. This is an advanced version of another script. It also takes price action into consideration along with some basic indicators like MACD and ADX to give good entry signals.
NOTE: This indicator is not designed to take entries completely based on signals it gives. Please use it along with your trading strategy to add more confluence to your trading system and maximize your profits.
I hope you guys will like this one too .Enjoy 👍
In case you find any bug, please do report in comment section .Thank you.

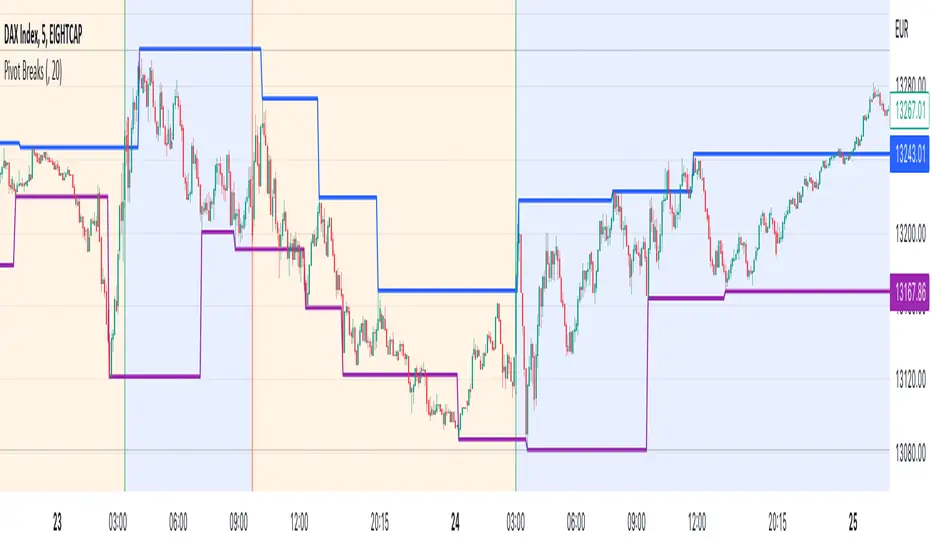
Pivot BreaksThere are built-in and published Pivot Point High Low indicators in Public Library. As far as I see none of them show the breaking candles or the trend.
with the closing price crossing over the previous / current pivot high A bearish breakOut can either indicate the progression of a lower high pattern or a trend reversal
with the closing price crossing under the previous / current pivot low A bullish breakOut can either indicate the progression of a higher low pattern or a trend reversal
This indicator can show the first breaking candle or all breaking candles . It Can also show The Breaking state (Trend) based on the last break.
Alert Mode is included, colour can be customised, Higher TimeFrame can be requested (it Can also cause repainting)
Inputs are optional as possible so have fun with it
Disclaimer: Scripts that I post publicly are experimental. They are not financial advices. Always backtest your ideas using your own methodologies.
MM Chop Filter Range BoxesMatch with the MM Chop Filter
This draw Non repainting range boxes when the oscillator see a range.
-Breakout Buy/Sell Signals and Exit signals when prices enters a range just in case you did get into a trade. .
-Alarms to match the signals
How to use
Match with the oscillator and always trade the trend with your strategy confirmation and the breakout this indicator provides

Smarter SNR (Support and Ressistance, Trendline, MTF OSC)Built with love "Smarter SNR (Support and Ressistance, Trendline, MTF OSC) "
This indiator will show you Support & Ressistance, Good Trendline, and Multi-timeframe analyzing of Oscillator (Stochastic and RSI)
You can combine with your own strategy, or use this purely
DISCLAIMER :
Measure the risk first before use it in real market
Backtest The Strategy was very important, so you know the probability
Fundamentally Logical :
SNR -> Last 3 Zigzag Pivot
Trendline -> Using two last pivot for calculating the slope
Features :
1. SNR
2. Trendline
3. MTF Oscillator Analyzing
How to use it :
1. All Label, Table & Line can be turned on/off in settings
2. Pivot Period can be Adjusted in settings
3. All Label, Table & Line style can be adjusted in settings
Regards,
Hanabil

Trend Following with Donchian Channels and MACDThis is a trend following system based on the Donchian Channels. Instead of using a simple moving average crossover, this system uses the MACD as the trendfilter:
Long positions:
* Price makes a new 50 day high,
* The MACD-line crosses above or is above the Signal-line.
* Both the MACD and the Signal-lines are above the zero-line.
Short positions:
* Price makes a new 50 day low,
* The MACD-line crosses below or is below the Signal-line.
* Both the MACD and the Signal-lines are below the zero-line.
Stoploss:
The initial and the trailing stoploss are 4 ATRs away from the price.

Range BreakoutThis indicator makes easy to identify a range breakout in both the direction
Expected input is number of days that we should expect the range to be in

Breakout FinderHelo All,
I got many requests for a Breakout script and here it's. This script searches the breakouts/breakdowns and draw square if there is one.
The options:
"Period" is used to find Pivot Points
"Max Breakout Length" is the maximum length to search breakouts
"Threshold Rate %" is channel width of the breakout area. calculated using highest/lowest of last 300 bars.
"Minimum Number of Tests" is the minimum number of tests that the Price tried to break the S/R level
and some options for coloring and linestyle
Lets see some examples:
in this example "Minimum Number of Tests" is 2 so the Price must have tested to break resistance area 2 times and then it breaks it as seen in the screenshot:
in following example Threshold rate is %10, so the channel width is very big:
as you can see in followinf screenshot you can choose different colors and line styles:
Alerts added ;)
Enjoy!

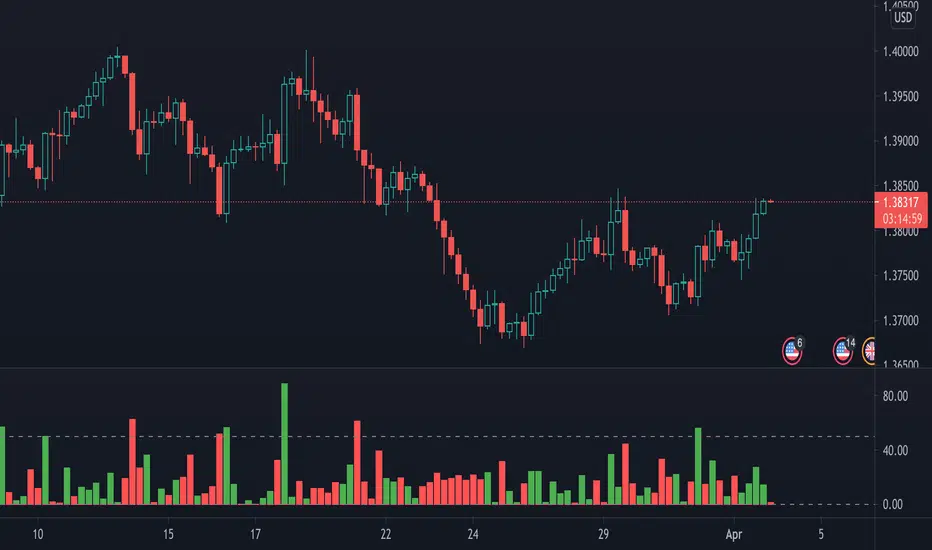
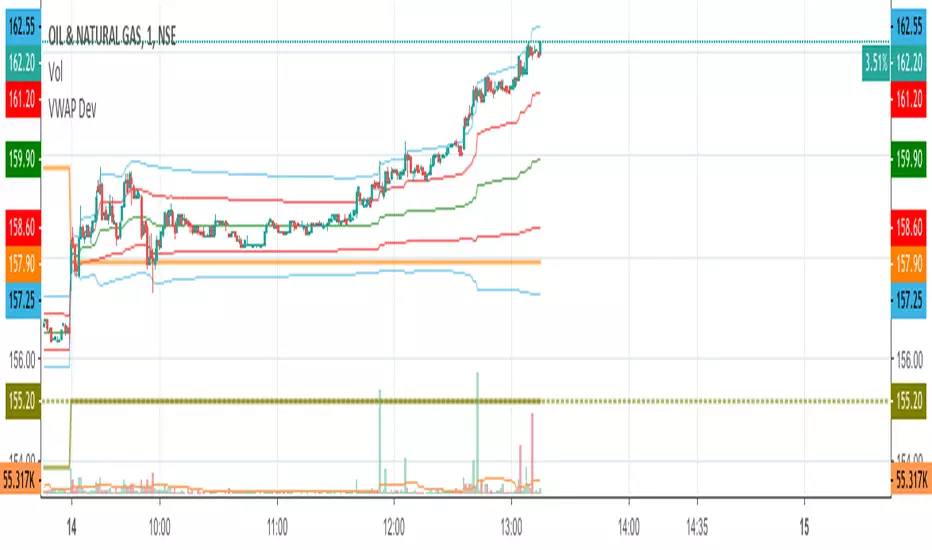
Best Bulls Bears Volume trend Breakout V2 [badshah_e_alam]This is a intraday indicator. Only to be used on timeframe less than daily charts.
This indicator purely uses volume to plot the graph. The indicator helps in conforming a breakout strategy.
This indicator is advanced version of my previously developed indicator you can check this link
Total volume is made up of buying volume and selling volume . Buying volume is the number of shares, contracts, or lots that were associated with green bars, and selling volume is the number that were associated with red bars.
The labels on the right side are the current bar value and that days bulls /bears weightage.
the first value shows the current bar volume.
second value show the bulls weight in %
third value show the bears weightage throughout the day ( %)
The Blue plot in graph keeps the track of bulls movement in intraday( %)
The Red plot in graph keeps the track of bears movement in intraday ( %)
X axis is time.
Y axis ranges from 100 to -100
I use 1:2 risk to reward ratio. Do your own research.
**not a financial advice**
Example of price increasing, volume decreasing
this indicator can be used for confirming a breakout strategy with bulls or bears in action. In the current example, the buyer’s volume percentage is reducing and the price is increasing throughout the day. Hence a breakout of the trendline is confirmation of a short trade.
Example of Price reducing, volume decreasing
example of price moving down , bears losing the grip
Example of price decreasing volume increasing
Thanks to nizar9599 for giving idea to improve my previous indicator.
DISCLAIMER
Any and all liability for risks resulting from investment transactions or other asset dispositions carried out by the user based on information received or a market analysis is expressly excluded by me.
All the information made available here is generally provided to serve as an example only, without obligation and without specific recommendations for action. It does not constitute and cannot replace investment advice. We therefore recommend that you contact your personal financial advisor before carrying out specific transactions and investments.
Do your own research, This is not a financial advice.

Pips Breakout CandlePips Breakout Candle measures price changes in pips. This indicator can be used to identify major price moves! The indicator comes with a sentiment line which is the sum of the Up versus Down price changes. It gives a good understanding of the current trend and identifies divergences.
Set alerts for major price moves!
Identify the trend!
Identify divergence!
Keltner Channel [LINKUSDT] 1HThis is a long-only strategy tested on LINK/USDT, 1 hour bar, from Feb 2019. The entry is determined by the breakout of upper Keltnel Channel and when the +DI is higher than 32. Instead of a fixed stop-loss from the original script , I change the exit to the middle band of the Keltnel Channel. 1st profit target will close 20% of the position. 2nd profit target will close 30% of the position. While the remaining 50% position will be closed when the price closes below the middle band of the Keltnel Channel, to take advantage of big trend. All parameters are adjustable. I added another option to enable or disable the ribbon trend filter.
My thoughts: For the same period, LINK appreciated 3000%. So I guess most in and out strategies couldn’t beat a buy and hold strategy during this period. But this doesn’t mean that this strategy is not feasible as each strategy is designed to only take advantage of a certain pattern or behavior of the market. Also, short term strategies allow you to use leverage and hence enable you to use you capital efficiently. Commission is set to 0.1%, taking account of the slippage.
Suggestion: Please perform walk forward analysis before you use real money for trading. Parameters need to be adjusted from time to time depends on your analysis. Can try using ATR for profit targets as over a longer term, the volatility might drop hence a high fixed % profit targets might not be realistic.
Any suggestions are welcome!

Soldiers Pattern ModifiedThis can be perceived as modified 3 soldiers, relaxed NR4 or even extended harami candlestick pattern.
Works for any instrument and any timeframe.
The idea is to find out any number of candles having their individual highs and lows, all within high and low range of base candle.
The count of soldiers and if they must be of same color, both can be configured.
Additional configurable settings is to add further check of having body of soldiers as well within body of base candle.
Trading strategy: Trade high or low breakout of base candle, having other as stop loss, for a risk reward ratio of 1:2.

2 Candles Inside ATR2 agitated candles falling inside ATR range, awaiting possibly a big move.
Buy / Sell signals at combined high / low can be used as order with other as stop loss.
Counter trade, when this minimal stop loss is hit, is also as useful. However, wait till the SL candle closes, before opening position on the other side.
Works quite well on 15 mins chart, with settings of ATR duration 25 and multiplier 0.6. These settings are configurable, so feel free.

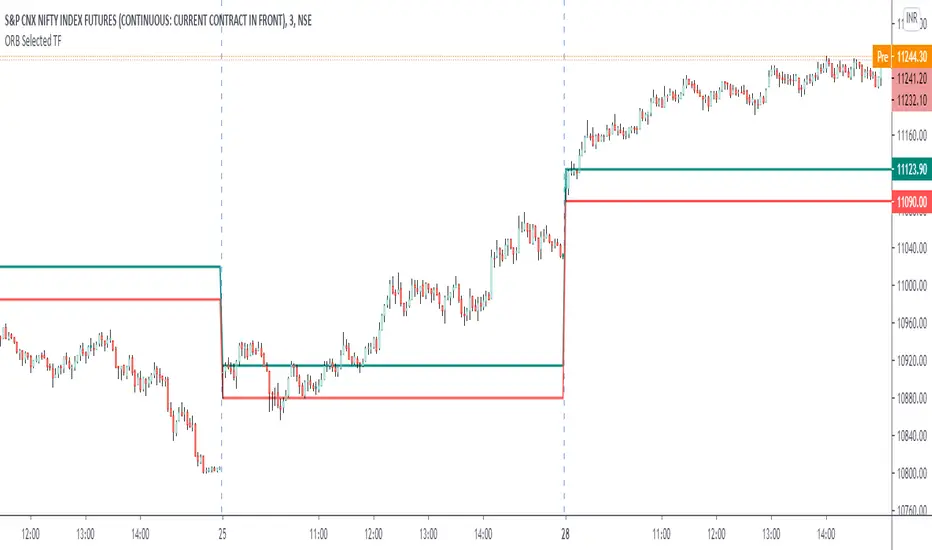
ORB Current TimeframePlot high and low of first candle from the current timeframe.
The levels are adjusted automatically when the timeframe is changed.
Trade breakout in either direction with other as a stop loss.
Can be used for any instrument.
Support and Resistance Levels with Breaks [LuxAlgo]This script provides basic pivot point Support and Resistance Levels to the user whilst displaying Break signal tags. It also has the ability to let the user display more significant breaks by filtering using the Volume Oscillator.
Only more significant breaks of these basic levels are displayed to the user when optimized which avoids noise and messy signals.
It will also display breaks with candles it deems to be bullish (e.g. having a longer upper or lower wick).
Notation
The notation of "B" denotes a break of either a Support or Resistance level with a volume greater than the threshold.
The notation of "Bull or Bear Wick" denotes a bullish or bearish candle on the break.
Settings:
Left Bars - the number of bars left hand side of the pivot.
Right Bars - the number of bars right hand side of the pivot.
Volume Threshold - the threshold value (%) for the Volume Oscillator.
Usage & Details:
Knowing when a pivot S/R level is broken with significance can be of great help to a trader. Many times significant levels may not be broken with significant force and the move is therefore weaker and possibly not worth trading.

Trend Following BreakoutEasy Trend Following Strategy using Highs and Lows breakout of the last X candles to enter and exit trades.
You can easily change the ENTRY and EXIT value in order to find the best settings.
This strategy seems to be working well for $BTC and $ETH on the 4H and 1D.
I didn't play with it too much as I am testing script to trade on the 15 minutes chart with margin. This script can't do this successfully but I hope it can be helpful for what you want to achieve.

Donchain BreakoutIt is a long only strategy.
1. Buy when price breaks out of the upper band.
2. Exit has two options. Option 1 allows you to exit using lower band. Option 2 allows you to exit using basis line.
3. Slippage and commissions are not considered in the return calculation.

VWAP Stdev BandsCurrent price always obeys VWAP and is very useful for intraday traders. The Price will never go beyond the second deviation of VWAP at any point of time. The deviation bands are also very useful in predicting the volatility of the script.
Breakout trades can be taken based on the previous day's VWAP and it's deviations.
One can say that the stock has experienced breakout if current price crosses the fourth deviation of the previous day's VWAP or price bounces off that level, the price movement will be rapid if this occurs providing a good trading opportunity with low risk-reward ratio.
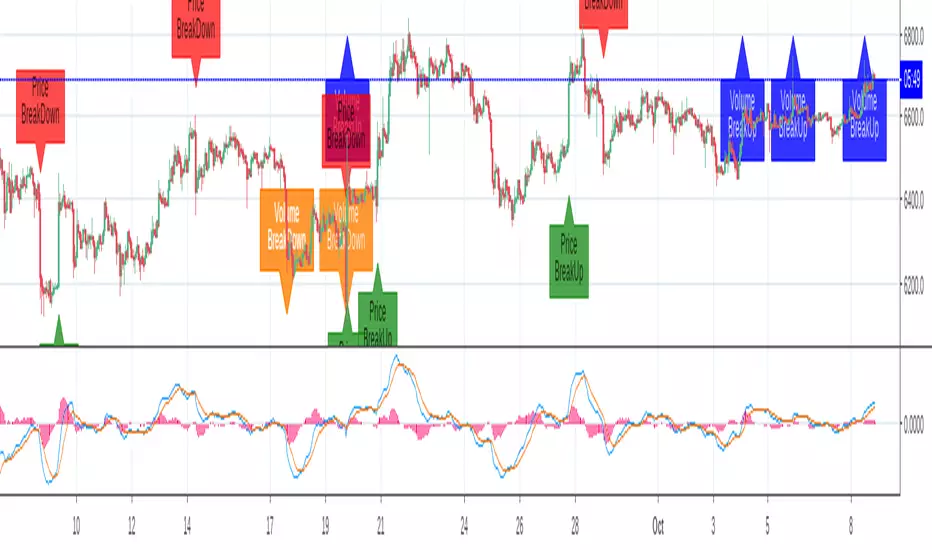
Breakout Labels and Alert For Price And VolumeThe indicator is developped for bitcoin and other cryptocurrencies, whose price and volume changes heavily within minutes. For the other Asset Classes, you may need to adjust the parameters.
Benefits:
1. Since a breakout of price or volume often means the start of a trend, this indicator alerts and displays a label when there is a breakout in price or volume.
2. The indicator prints labels on the chart, which helps people to study the relationship between a breakout and the trend.
3. The volume change is compared to a SMA of volume, instead of the last bar, which can reflect the change compared to a certain period.
4. You can set an alert for breakouts of both price and volume, instead of do it two times.
Settings:
SMA Length for volume: is the length to calculator volume SMA, default:108.
Toggle on/off to display or hide labels for price or volume breakout.
Customize the alert threshhold for price or volume breakout in different time period:3m,5m,15m,30m,60m and other
Use percentageGapForSlopeshape to adjust the relative position of labels.
Style - color settings: Orange for Volume Down, Blue for Volume Up, Red for Price Down, Green for Price Up.
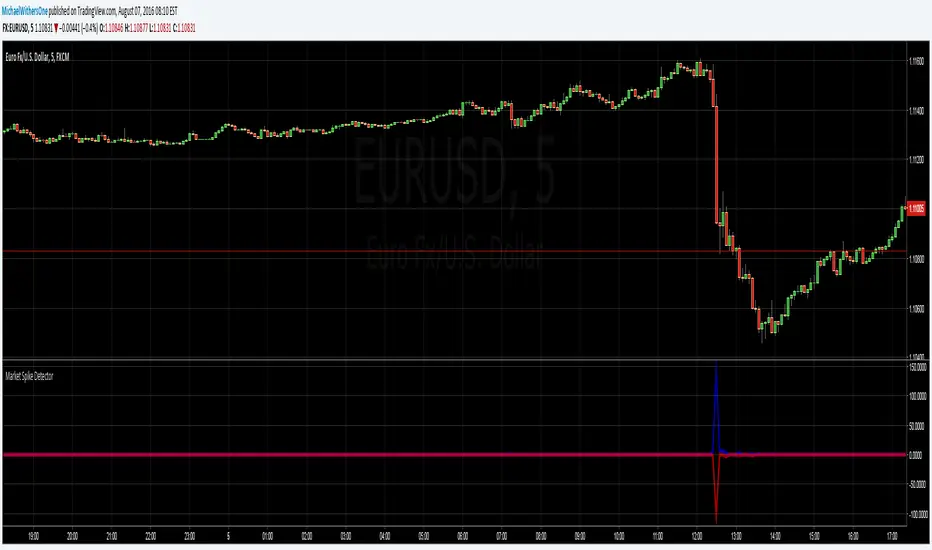
Seismic Market Spike Detector v1.0 Seismic Market Spike Detector v1.0
This indicator helps identify spikes in market activity , typified by bars with extreme open / close or high / low prices.
This indicator plots 2 lines. The Blue line simply depicts extreme price movements with in that bar regardless of the initial opening price of the closing price of the bar. This allows you to get an insight into the current volatility of the price at that time in the market. Quite often big price swings with in bars are missed as people pend to tunnel vision on the open or close price - or other indicators derived from open / close.
The Red line is similar to the blue bar as it depicts extreme price movements with in the bar , but it will show the direction the market moved in by the close of the bar - and relatively how much the market moved. This is helpful for spotting breakout price action or short term spikes. Quite often after a breakout the market will restore itself to an equilibrium in the opposite direction. Sometimes this happens with an opposing aggressive spike , some times it makes a steady return to a known price level. Either way its a great time to place entry orders if you are looking to turn a fast profit or alternatively a good warning of forth coming price volatility.
Here are some tips for analysing the red and blue lines :
1)If the red line is pointing upwards , this indicates a sharp rise in the price.
2)If the red line is pointing downwards , this indicates a sharp fall in the price.
3)If the red line is flat but the blue line is spiked in either direction - this indicates the price was volatile with in the bar , but the price closed relatively near to the surrounding price bars. Perhaps a limit / stop triggered by this kind of activity - this is an easy way to determine why and re-enter.
4)If the red and the blue lines are flat - the price is steadily moving with a trend or trading sideways in a confined range.