weekend rally bloody mondayTracks the gain-loss of the price on Mondays and the range gain-loss from Monday (configurable) to Sunday. Then, it identifies Sunday's pumps that end with a Monday dump.
BTCUSD

Slices of Bitcoin
A very simple indicator that shows how many times a currency fits into Bitcoin. In other words, the higher the value, the weaker the currency against Bitcoin.
You can easily see that since the beginning of 2019 Stellar Lumen (XLM) lost half of its BTC-value while the USD-value was constant.

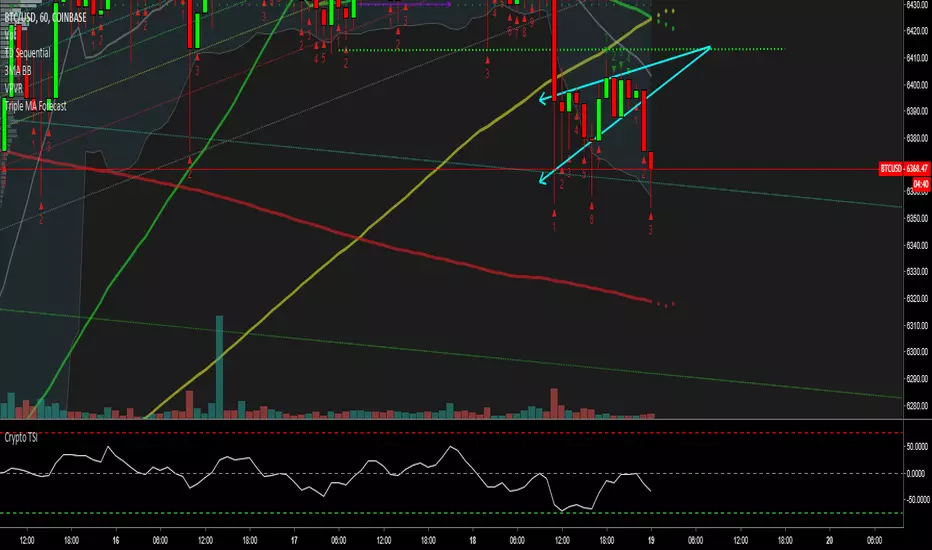
Crypto Indicators #u9tusA set of low timeframe (LTF), medium timeframe (MTF), and high timeframe (HTF) indicators for use in crypto currencies / bitcoin.
Traditionally the 10, 20, 50, 100, and 200 SMAs are used in TA. With cryptos, I've found that the 8 EMA, 21, 55, and 128 SMAs backtest better, while no change in length was necessary for the 200. I wanted to combine all these into one indicator to easily add them to a chart layout, hence this script.
You can customize the length of each MA to your liking in the settings, or accept the defaults.
LTF Indicators:
8 EMA in blue hues, medium line stroke.
MTF Indicators:
21, 55 SMA in purple hues, medium line stroke.
HTF Indicators:
128, 200 SMA in yellow hues, thick line stroke.
Defaults are for daily timeframes and lower; suggest changing up the intervals for weekly and monthly to:
21 -> 30
55 -> 50
128 -> 100
$BTC, $ETH, #ALTS
twitter.com
(c) @jhaurawachsman 20190515

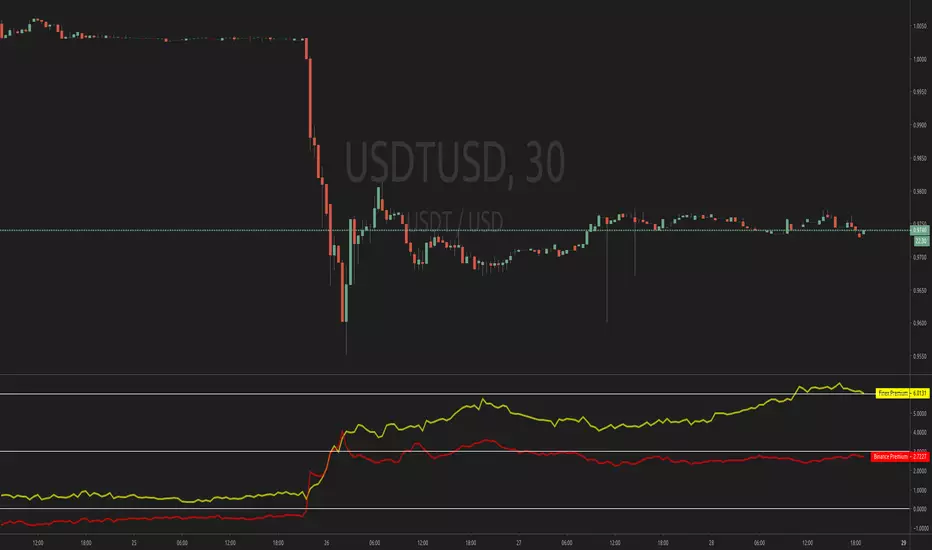
Finex PremiumThis is a simple script for the Bitfinex premium against Bitstamp
Easy to modify values
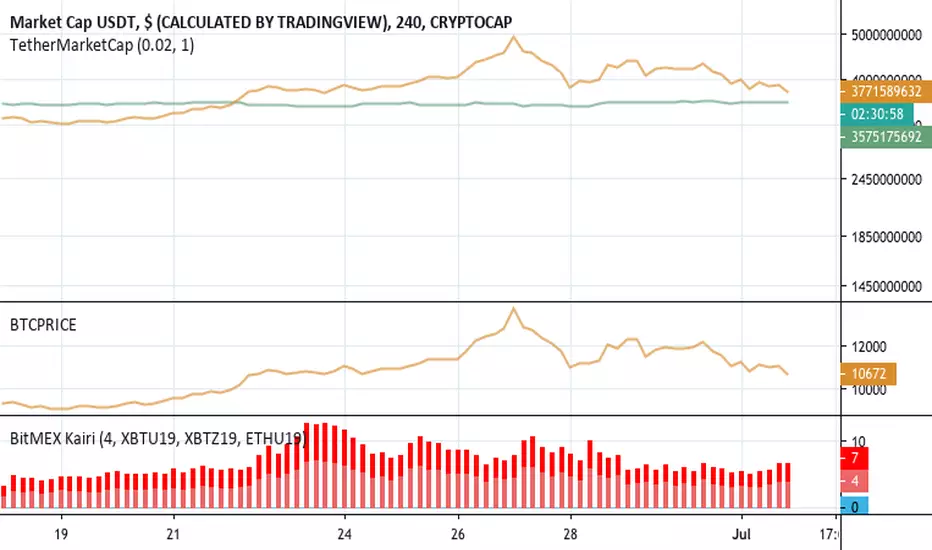
BitMEX KairiBitMEX Kairi
# Abstract
This script shows the divergence between BTC futures price and BTC actuals price of bitFlyer FX and BitMEX in percentage.
Usually, when people bought it or sold it too much on futures , the divergence between actuals and futures are getting expanding.
I believe this is really useful to find when the conversion of the trend happens.
Also supports USDT divergence too. If you wish to enable USDT mode, please check "Show only USDT divergence (Poloniex)" on the settings menu.
Enjoy :)
# Supports:
- BitMEX BTC Futures 3mo (orange)
- BitMEX BTC Futures 6mo (red)
- bitFlyer FX (blue)
- USDTUSD (Poloniex)
# Disclaimer:
This is a free script. Feedbacks are welcome! But I don't have any responsibility when this script has broken or something went wrong.
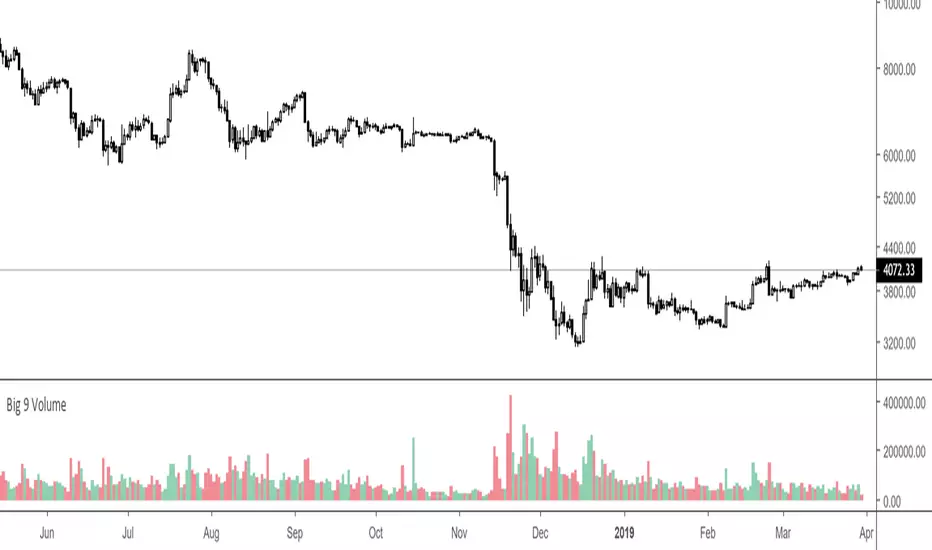
Big 9 Volume - Volume indicator from exchanges with real volumeHere is a very basic indicator combining the volumes of the 9 biggest exchanges trading BTC/USD or BTC/USDT. These 9 exchanges were chosen based on the report by Bitwise Invest stating that 95% of the volume on CoinMarketCap is fake. On these 9 exchanges, however, volume data appears to be reliable. Please note BitFlyer was not included because it does not trade in USD. Please note also that data on all 9 exchanges is only available from June 2018.
Anyone is welcome to modify this and make it more elegant, this was just a quick implementation.
Delta longs-shorts. BITFINEX:BTCUSDFor any timeframe. Use for the BTC/USD pair. It is calculated by the formula: longs - shorts. Used data from Bitfinex. To smooth the values, you can use the EMA embedded in the indicator.

BTC ETH RatioBTCUSD / ETHUSD Ratio.
You might find patterns when to move from BTC to ETH and vice versa.
# Open Source
The code is open source @ github.com and uses the commonpine library github.com

Aggregated Volume BTCAggregates the Bitcoin volume from multiple exchanges into a single indicator.
# Exchanges and Pairs
Included are only exchanges supported by TradingView:
* Binance
* Bitstamp
* Bittrex
* Coinbase
* Gemini
* itBit
* Bitfinex
* Kraken
* Poloniex
* HitBTC
* OKCoin
* BitMEX
Excluded low volume exchanges (not in CMC Top):
* CEX.IO
* Coinfloor
Excluded low volume pairs (not in CMC Top):
* KRAKEN:XBTCAD, COINBASE:BTCUSDC, ITBIT:BTCEUR, ITBIT:BTCSGD, BITFINEX:BTCJPY, BITFINEX:BTCGBP, POLONIEX:BTCUSDC, OKCOIN:BTCUSD, OKCOIN:BTCCNY
Many other top exchanges are not included, because they are not supported by TradingView.
# Inputs
By default the spot exchanges are selected. You can select also the other margin trading and derivatives exchanges.
# Contribute
Feel free to share any ideas and issues you have.
# Open Source
The code is open source @ github.com and uses the commonpine library github.com

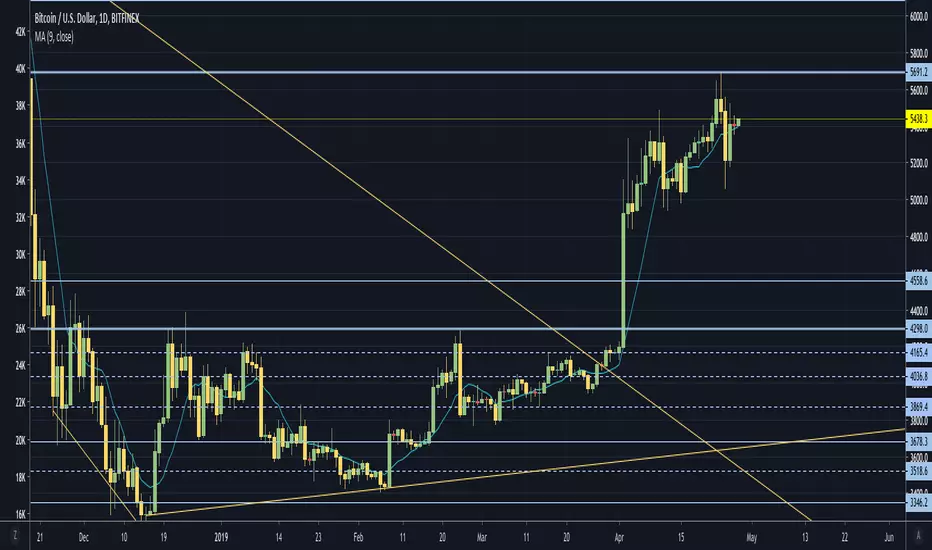
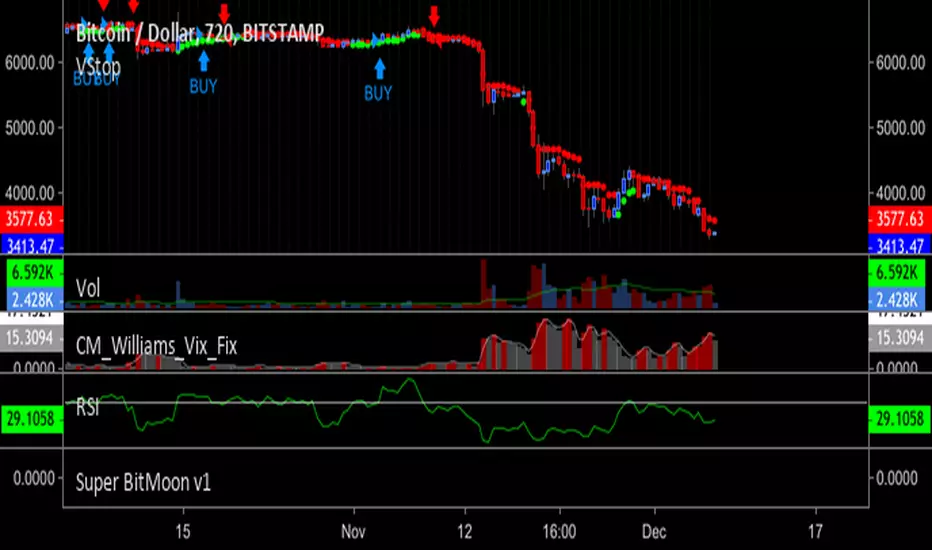
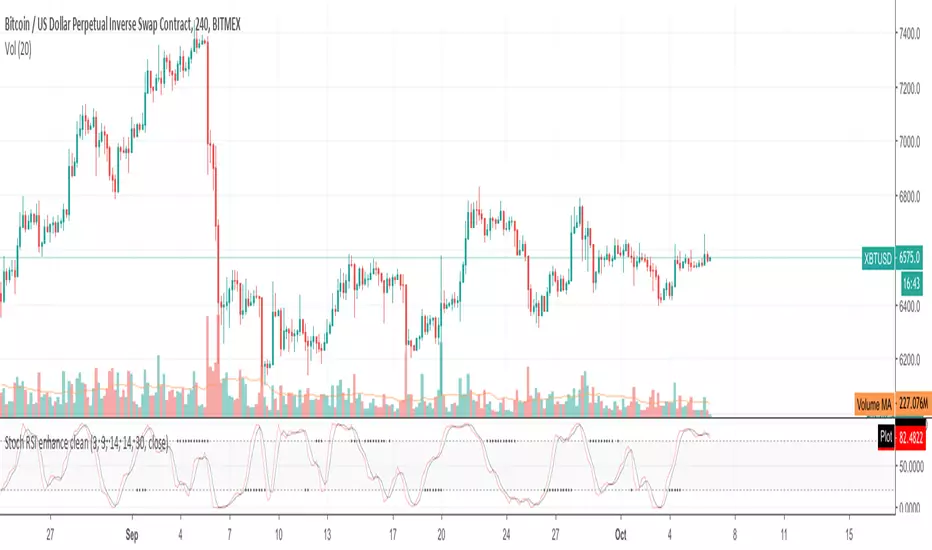
RSI Cross by uykusuzpenguenRSI Cross Explanation;
It's simple,
When short-term RSI crossover long-term RSI ; BUY ( Green Area )
When short-term RSI crossunder long-term RSI ; SELL ( Red Area )
You can change RSI lenghts or moving average lenght on settings.
If you knew that, you would sell all your bitcoins at a price of $13.500 and not look back on 8th January.
Happy trading.


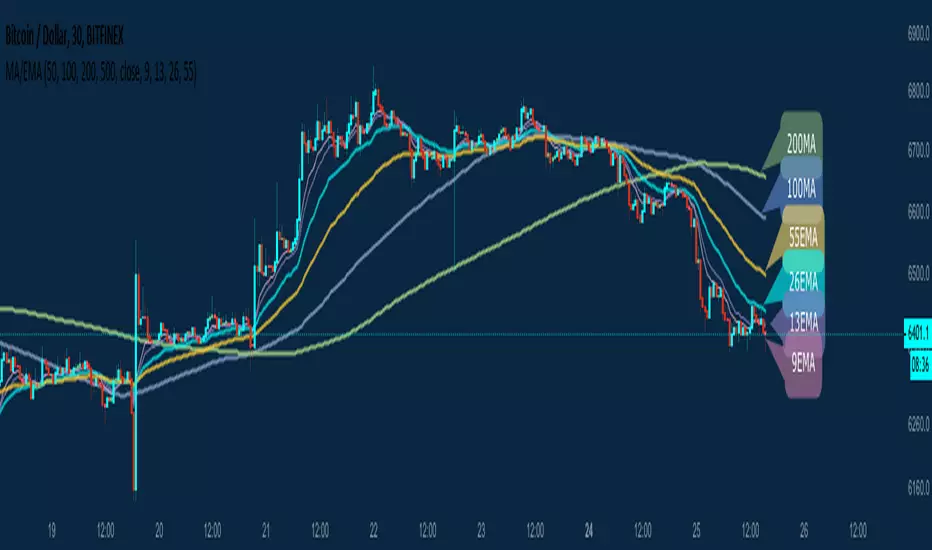
Ruler's Multiple Moving Averages - 8 EMA/MAA handy tool for those who need Multiple Moving Averages in a single indicator!
A great collection of 8 very powerful EMAs and SMAs including:
50MA 9EMA
100MA 13EMA
200MA 26EMA
500MA 55EMA
Of course, completely customizable to your own needs. No need to upgrade your Tradingview account to be able to use multiple MA indicators when you can have all of them in a single Indicator.
All feedback is welcome of course! Enjoy.
Retail vs. Institutional Bitcoin Volume Ratio [@joemccann]Retail Exchanges
Binance
Bitstamp
Coinbase
Kraken
Bithumb
BitFlyer
OkEx
CEX
Huobi
Institutional Exchanges
Bitfinex
Bitmex
The ratio measure the (total volume of retail exchanges) / (total volume of retail exchanges + total volume of institutional exchanges).
Imperfect. Not investment advice.
H/T @cryptorae for the original version.

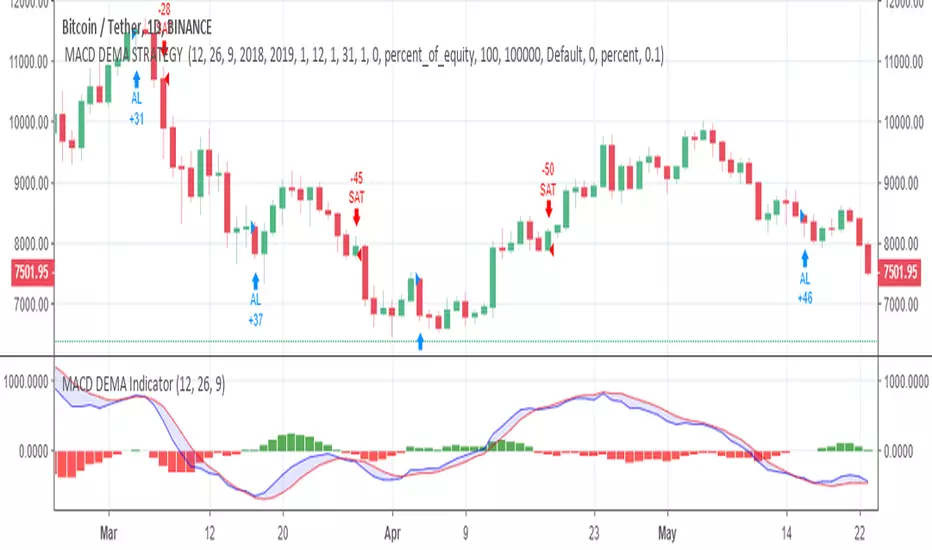
MACD DEMA STRATEGY A strategy based on ToFFF MACD DEMA indicator
Even so , ı dont recommended using MACD DEMA alone.
Combine its code with your favorite indicators.
You can visit ToFFF's indicator :
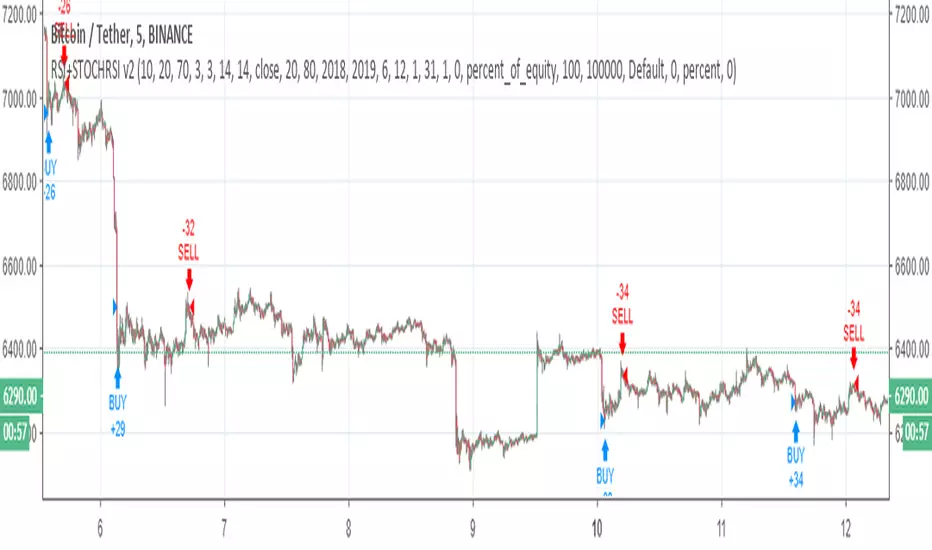
RSI+STOCHRSI v2RSI + STOCHASTIC RSI combination v2 ( for v1 )
For 5 min
Changes
Stcoh RSI creates signal with crossover
RSI created signal with an equation ( above or below the line) ,crossover was added.