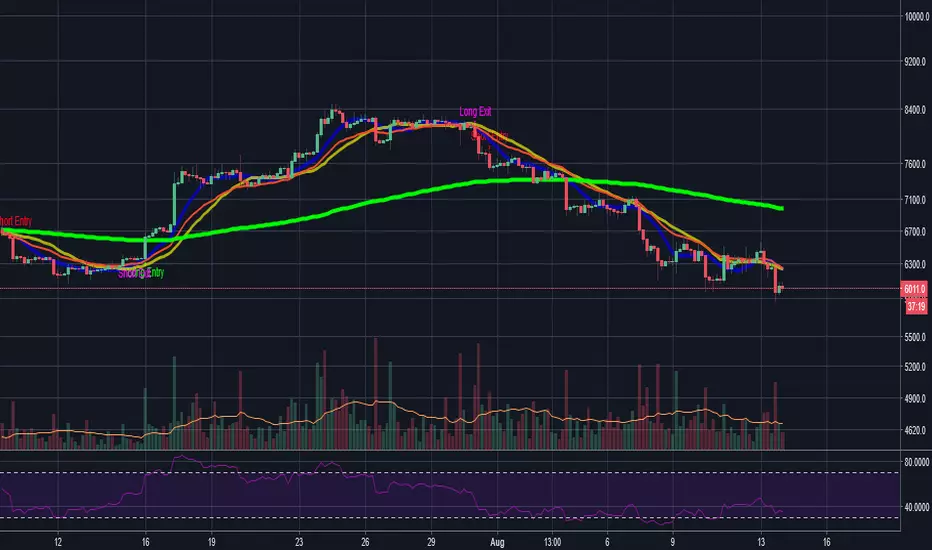
BTCUSD
Satoshi RSI
Custom RSI for Satoshi's friends 😎
Over Bought = 80+
High Line = 60+
Low Line = -40
Over Sold = -20
CHOP ZONE = 40-60
added horizontal points for common valley points
EMA and SMA crossover technique
EMA 5
SMA 21
variables can be changed but this is the standard
RSI crossover EMA5 is a signal and the crossover of the SMA21 is the confirmation vice versa.
although waiting for confirmation may draw from wins.
background is shaded white for bull trend and red for bear.
Colors can be changed
future variants will be released. 🚀

Thoth Utils - Oscillators
"In art he, Thoth, was often depicted as a man with the head of an ibis bird"
999ug
-----
README
Inside:
- No Repaint
- No Lookahead
- Normalized Oscillators -
Hints:
-- Scripts are not for sale or export outside TV.
-- NO Youtube, NO Twitter, NO Telegram!


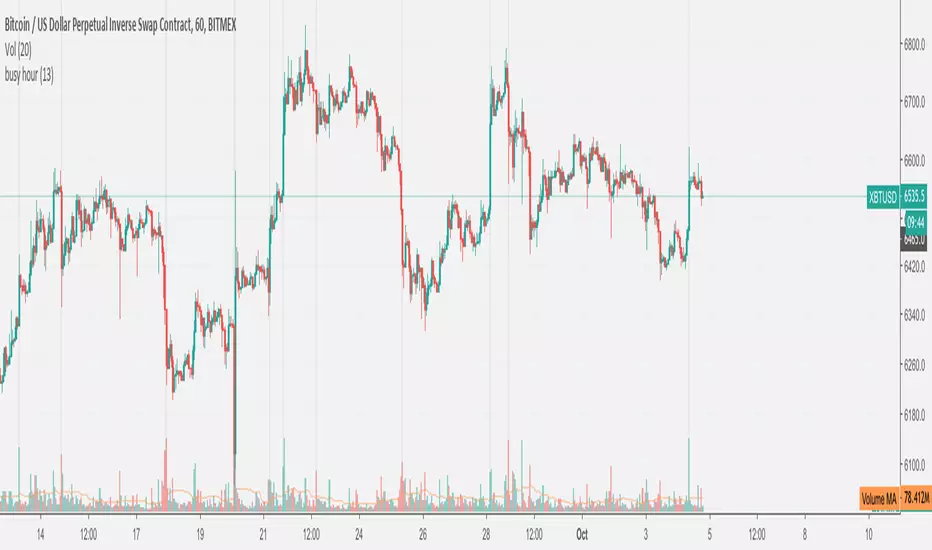
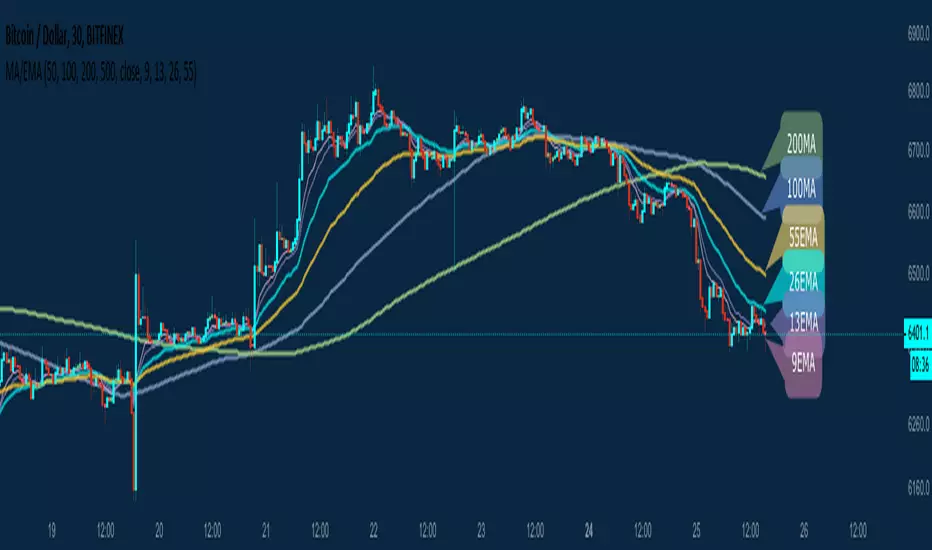
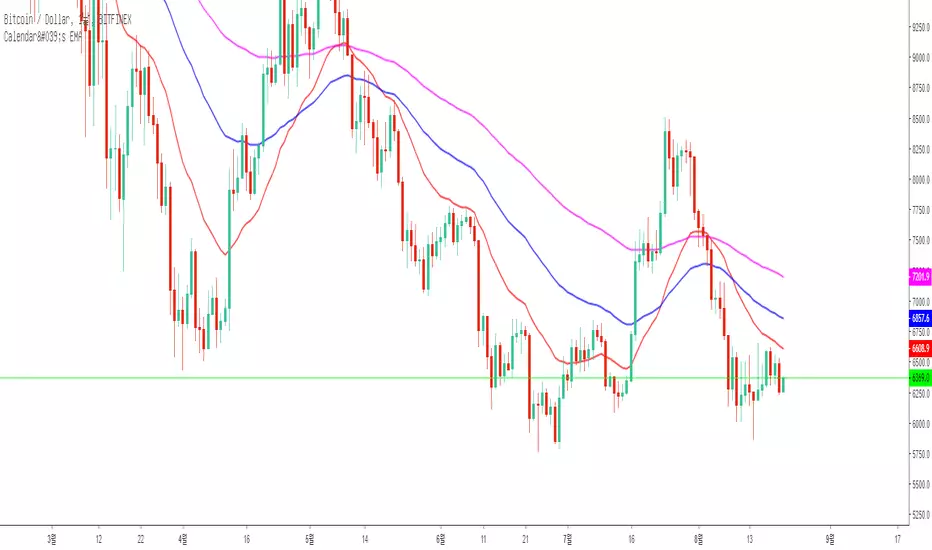
Ruler's Multiple Moving Averages - 8 EMA/MAA handy tool for those who need Multiple Moving Averages in a single indicator!
A great collection of 8 very powerful EMAs and SMAs including:
50MA 9EMA
100MA 13EMA
200MA 26EMA
500MA 55EMA
Of course, completely customizable to your own needs. No need to upgrade your Tradingview account to be able to use multiple MA indicators when you can have all of them in a single Indicator.
All feedback is welcome of course! Enjoy.
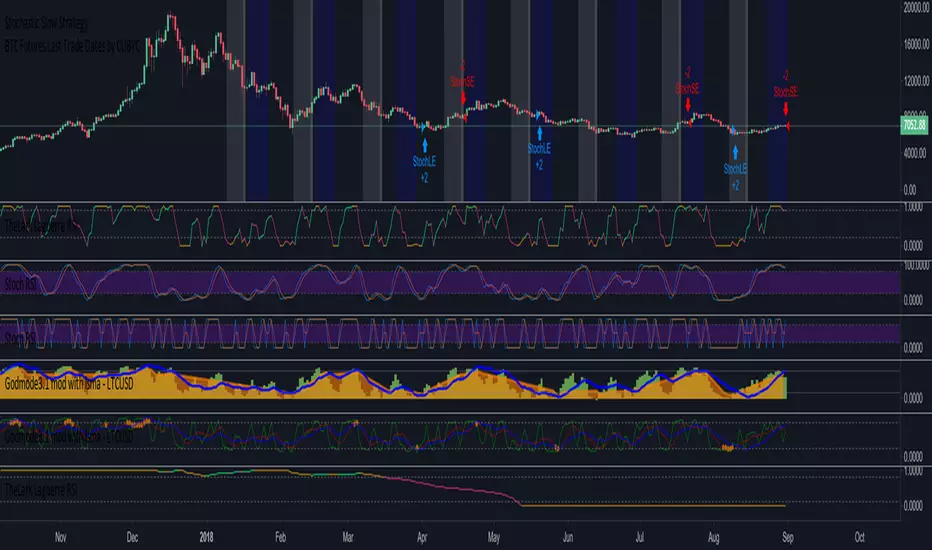
Israr21 [RSI]In Previous Post, I have uploaded Israr21(Reverse Fisher). Now For more accurate results, I am publishing Israr21(RSI), which will be given as bonus with Reverse Fisher after Purchasing. Using both indicators will be helpful for trader to trade as risk-free. For understanding, I have marked signs in Red and Green along text. Before purchasing, you can contact me for Free Trial version of 2 Days. .
If someone Trade short/sell, then Trader should have checked 15Min Chart to close the short. After RSI touched 0.00 Level.

Israr21 [Reverse Fisher]Hi there! That is my first script, which developed in Amazing Code.
A Green mark gives you opportunity to Buy/Long.Also gives opportunity to sell/short & came with Alerts,which will never miss your Chances. Contact me for More Info.....

Retail vs. Institutional Bitcoin Volume Ratio [@joemccann]Retail Exchanges
Binance
Bitstamp
Coinbase
Kraken
Bithumb
BitFlyer
OkEx
CEX
Huobi
Institutional Exchanges
Bitfinex
Bitmex
The ratio measure the (total volume of retail exchanges) / (total volume of retail exchanges + total volume of institutional exchanges).
Imperfect. Not investment advice.
H/T @cryptorae for the original version.

XBT Volatility Weighted Bottom Finder. [For Daily Charts]An update to:
Made it into and indicator.
v. 0.0.1
DESIGNED FOR DAILY CHARTS

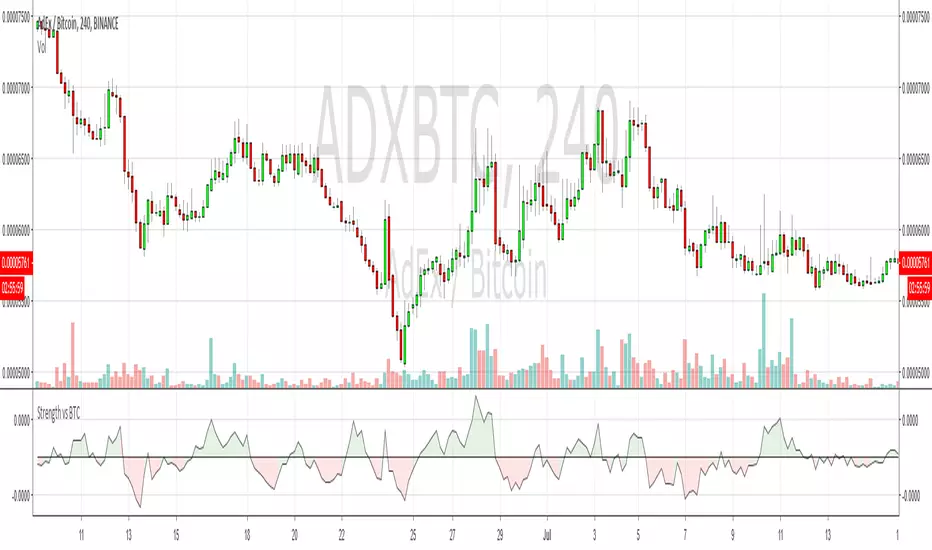
Strength Relative to BTCShows strength of the currently charted alt compared to BTCUSD. If BTC is going down or sideways and the alt is going up, then you'll see green and vice-versa for red. Good for quick at-a-glance strength evaluation when flying through a watchlist. The output uses a normalised moving average to reduce signal noise.
RELEASE THE BEAST! Tortuga V4 FULL RELEASE!GOOD EVENING FELLOW TRADERS!
The Tortuga V.4 indicator is now fully finalized and ready for trading. This indicator utilizes a combination of momentum, volume, volatility, and price action to create top tier condition signals for both long and short positions. In the Tortuga V.4 indicator, I have updated lines of code to: make long signals more common, make long signals more precise, make short signals more precise, and make short signals more common.
If you are interested in the Tortuga V.4 indicator, shoot me a PM.
As always, trade happy!
James

WMHA IndicatorFinalized name of my new indicator - WMHA - is now for sale for $40, on a monthly subscription basis. A free 15 day trial is offered for this indicator as well. This indicator can be used on timeframes above 5 minutes and below 4 hours. On a two week mock portfolio run, the indicator was 76% successful when placing a 0.69% stop-loss. That is right, a stop loss less than 1%. The two week mock portfolio yielded 75% profit compared to your initial trading stack value, and a 15% yield of profit for overall equity. This was using no leverage. With such a successful test run, utilizing such a low stop-loss, one could use 3x-10x leverage when using this indicator to make their profits grow exponentially and successfully. More videos of the WMHA Indicator will be posted shortly, if you have any interest in subscribing to my indicator, shoot me a PM.
As always, trade on.
James

Squeeze indicator V1This is the fifth indicator I am releasing. Will update description, releasing currently for subscribers. If you have any questions about subscribing to any of my indicators, send me a Direct Message.

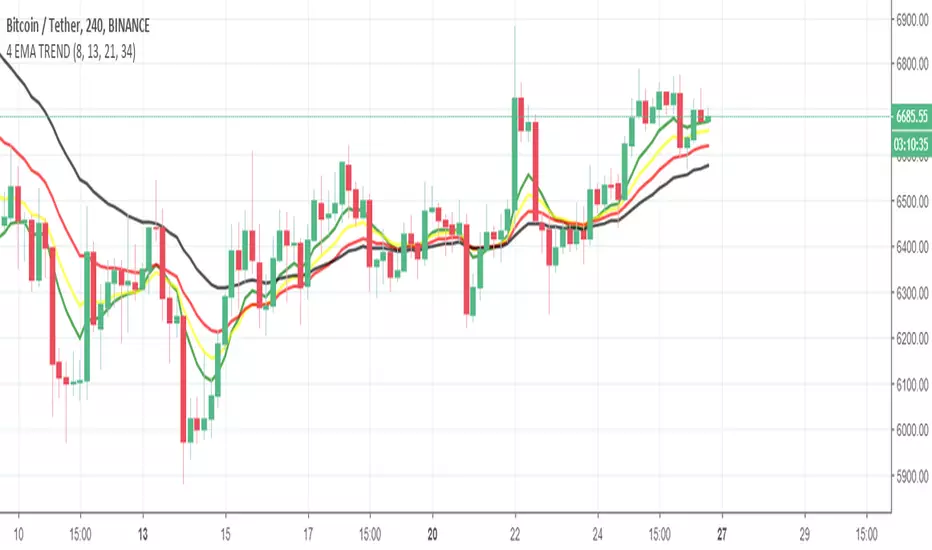
4 EMA TREND INDICATORİf GREEN > YELLOW > RED > BLACK
UPWARD TREND
If BLACK > RED > YELLOW > GREEN
DOWNWARD TREND
In upward trend , if green(fastest ema) crossunder YELLOW or RED or both of them , you can close the position . Dont wait the Downward Trend.
Lengths of EMAs are based on Fibonacci numbers ( 8,13,21,34) , if you want, you can change it based on your strategy.
gentoku MACDThe gentokuMACD is the colored MACD to judge a trend easily.
In the gentokuMACD, both the MACD line and histogram are colored and it is enable to anticipate small movements and determine a convergence of trends.
It also can be used to find a price range by displaying a resistance and support levels, JYA!

Trend Strength Indicator - "Tren"The Tren indicator is a combination of Trend Strength Indicators that I combined in an attempt to better aid position taking. It utilizes certain conditions amongst trend strength indicators and plots numbers 0-12 above (if bullish) or below (if bearish) depending on the conditions. The higher the number, the stronger the Trend Strength is. If one wanted to go long or short, but the trend strength was weak - a trader might want to reconsider their position. If a trader was currently in a position and experienced a retrace, but the trend strength was high and in their favor, a trader might use this indicator to reconsider exiting a trade - therefore maximzing profits.
This indicator is not currently for sale, and is in its beta stages. Follow me for more updates and indicators.

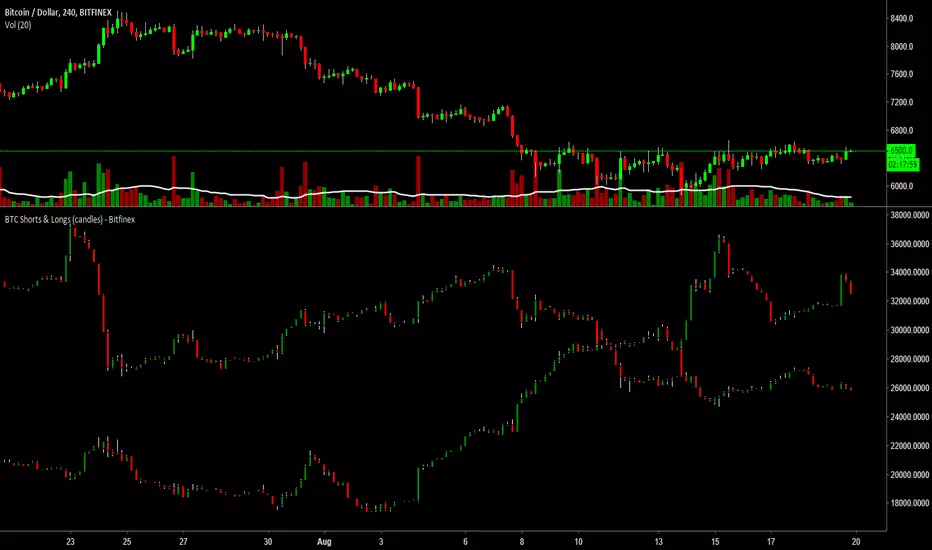
BTC Shorts & Longs (candles) - BitfinexBTCUSDLONGS and BTCUSDSHORTS indicator people like to use but I combined them into one chart/indicator to make them easier to see how the longs or shorts may be building.
Please give it a like if you use or enjoy the indicator.
LazyTrader 1DDon't want to trade every day? This one is for you!
Trade the big swings on the BTCUSD market with ease.