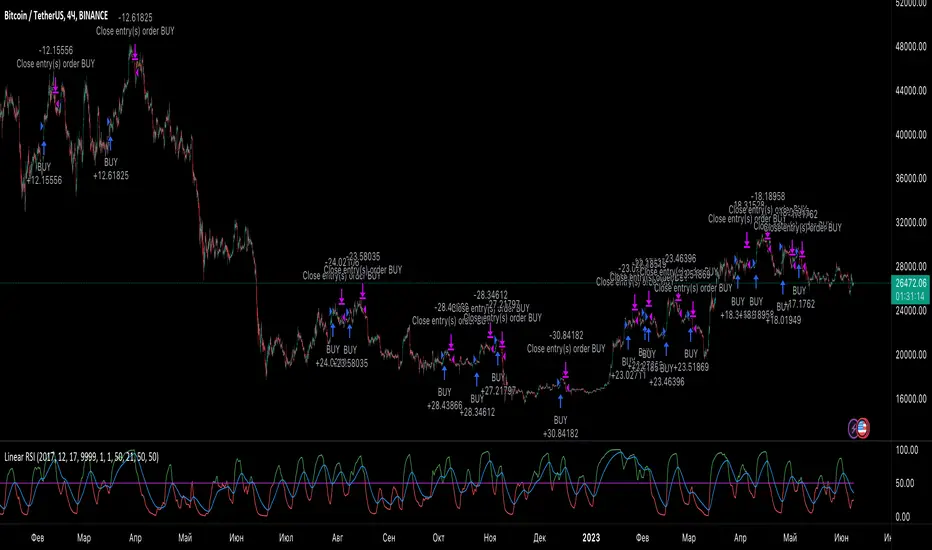
Dual MACD StrategyThis strategy Multi Time Frame Macd Indicator
We take the first long position when we have a buy signal in Weekly Macd (Macd line crosses above Signal line). This open a trading window, showed with green background color
We close the first position when either Weekly or Daily Macd give us a sell signal ((Macd line crosses below Signal line))
Enable Profit and Stop in strategy settings with different percentage to backtest the strategy. Also if it is better to use a Traditional Stop Loss or a Trailing Stop Loss based on a percentage from low prices
Change macd resolution in settings for other time frames to test the strategy
This Strategy was tested on Crypto Market with good results in assets as BTC, ETH, BNB, ADA, LTC, XLM, BCH, among others
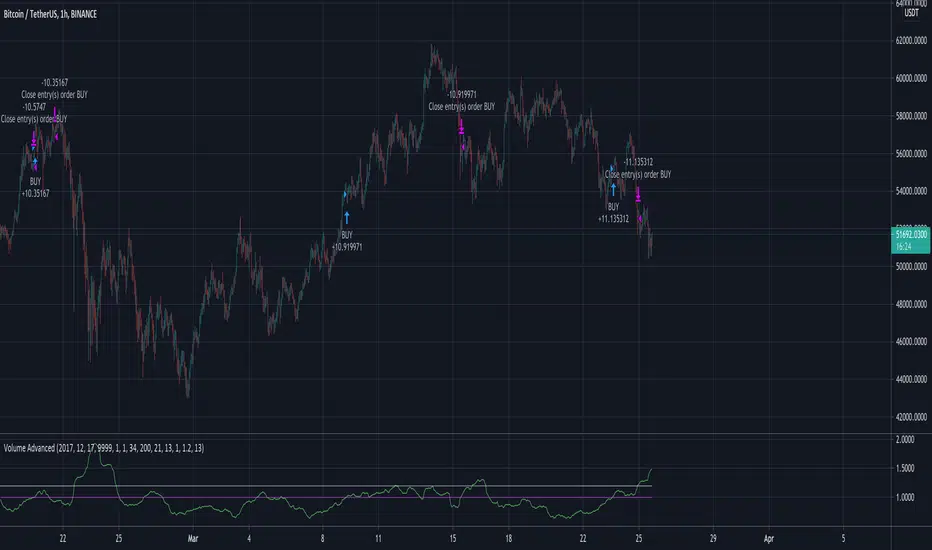
BTCUSDT

Optimized Keltner Channels SL/TP Strategy for BTCThis strategy is optimized for Bitcoin with the Keltner Channel Strategy, which is TradingView's built-in strategy. In the original Keltner Channel Strategy, it was difficult to predict the timing of entry because the Buy and Sell signals floated in the middle of the candle in real time. This strategy is convenient because if the bitcoin price hits the top or bottom of the Keltner Channel and closes the closing price, you can enter Buy or Sell at the next candle start price. In addition, this strategy provides Stop Loss and Take Profit functions to maximize profit.
_________________________________
Recommended settings are below.
- length: 9
- multiplier: 1
- source: close
- (v) Use EMA
- Bands Style: Average True Range
- ATR Length: 19
- Stop Loss (%): 20
- Take Profit (%) : 20
_________________________________
- length: 9
- multiplier: 1
- source: close
- (v) Use EMA
- Bands Style: Average True Range
- ATR Length: 18
- Stop Loss (%): 20
- Take Profit (%) : 5
_________________________________
▶ Usefulness and Originality
- Stop Loss and Take Profit functions are available
- Convenient Buy and Sell entry compared to the original Keltner Channel Strategy
- Optimized for BTCUSD market (maximizing profits)
___________________________________________
이 전략은 TradingView의 Built-in 전략인 Keltner Channel Strategy를 비트코인에 맞게 최적화되었습니다. 기존의 Keltner Channel Strategy는 Buy, Sell 신호가 캔들 중간에 실시간으로 떠서 진입 시점을 예측하기 어려운 불편함이 있었지만 이 전략은 비트코인 가격이 Keltner Channel 상단 혹은 하단을 찍고 종가를 마감하면 그 다음 캔들 시작가에서 Buy 혹은 Sell 진입이 가능하여 편리합니다. 또한, 이 전략은 Keltner Channel을 만나서 캔들을 마감한 가격 (bprice, sprice)을 시각적으로 plot을 제공하여 타점 및 차트를 보기에 편리하며 손절가 및 목표가를 지정한 백테스팅이 가능합니다.

Kimchi Premium Indicator with Selectable SymbolsThis indicator is the Korea Premium, also known as “Kimchi Premium” indicator, which shows how expensive and cheap the bitcoin price of the bitcoin exchange in Korea as compared to the bitcoin price traded in dollars or tether. Previously, the Kimchi premium indicator in TradingView does not have the recently added Upbit BTCKRW market, and it is not possible to select markets. In addition to the recently added Upbit BTCKRW market, this indicator is convenient because you can select all markets offered by TradingView. Therefore, not only bitcoin but also altcoin kimchi premium can be plotted.
▶ Usefulness and Originality
- Users can choose from various BTCKRW and BTCUSD markets.
- Users can plot altcoin Kimchi Premium in addition to Bitcoin.
_____________________________________________________________
이 지표는 달러 혹은 테더로 거래되고 있는 비트코인 가격 대비 한국에 있는 비트코인 거래소의 비트코인 원화 가격이 얼마나 비싸고 싼 지를 나타내는 코리아 프리미엄, 일명 "김치 프리미엄" 지표입니다. 이전에 트레이딩뷰에 있는 김치 프리미엄 지표는 최근에 추가된 업비트 BTCKRW 시장이 없을 뿐만 아니라 마켓을 선택할 수가 없습니다. 이 지표는 최근에 추가된 업비트 BTCKRW 마켓과 더불어 트레이딩뷰에서 제공하는 모든 마켓을 선택할 수 있어 편리합니다. 따라서 비트코인 뿐 만 아니라 알트코인의 김치 프리미엄도 plot할 수가 있습니다.
▶ 유용성과 독창성
- 사용자가 다양한 BTCKRW 및 BTCUSD 마켓을 선택할 수 있음
- 사용자가 비트코인 외에 알트코인 김치프리미엄도 plot 할 수 있음

Chanu Delta StrategyThis strategy is built on the Chanu Delta Indicator, which indicates the strength of the Bitcoin market. When the Chanu Delta Indicator hits “Delta_bull” and “Delta_bear” and closes the candle, long and short signals are triggered respectively. The example shown on the screen is a default setting optimized for a 4-hour candlestick strategy based on the Bybit BTCUSDT futures market. For the 15-minute candle, "Delta_bull=32", "Delta_bear=-31", "Source=hlc3" are best. You can use it by adjusting the setting value and modifying it to suit you.
If you use this strategy in conjunction with the Chanu Delta Indicator, it is convenient to anticipate alert signals in advance. Since the Chanu Delta Indicator represents the price difference based on the Bybit BTCUSDT futures market, backtesting is possible from March 2020.

Chanu Delta IndicatorThe Chanu Delta Indicator was created as the price difference between the two markets using the principle that the Bitcoin price fluctuations in the BTCUSD market on the BYBIT exchange are greater in the BTCUSDT market. This indicator shows the strength of the current market's buys and sells, and helps in short-term trading.
Chanu Delta Indicator (Δ) = BTCUSD ($) - BTCUSDT ($) (Unit: Dollar, Source: Close)
● Δ > 100 : Strong Buy
● 20 < Δ < 100 : Buy
● -20 < Δ < 20 : Neutral
● -100 < Δ < -20 : Sell
● Δ < -100 : Strong Sell

BTC Volatility Band StrategyThis script/strategy is a pullback system designed for securities with high volatility so naturally Bitcoin is an excellent choice for trading this. This could be used both on a daily chart or on lower timeframes (I found good results on 3hr timeframe but haven't tested it on anything under 1hr).
A volatility band is created by comparing the candle close price of the previous 2 candles and and it uses this change in price to create a moving average. A band is wrapped around the moving average with a standard deviation of 1 for the inner band and 2 for the outer band. If the price is above a pre-set MA (moving average filter) then it is determined we are in an uptrend so the strategy will issue a buy signal when we are in an uptrend and there is a pullback which causes the lower inner deviation band to be spiked, but if the price continues and falls through the outer deviation band then a buy signal will not issue as this detriments that the volatility spike is to great. You can see a spike "buy" event occur on the indicator where the background is coloured green. For a short/sell then there will be a spike on the upper inner band and we are below the pre-set MA filter, for this it shows with red background on the indicator.
The user can change the date range they wish to test, the moving average period for the volatility tracking and the inner and outer band deviations. On BTC I left the inner deviation and outer deviation bands on standard settings but found the 3 period volatility tracking to be good for trading 1 day chart and the 5 period volatility tracking good for the 3hr chart. Since this is not a buy and hold strategy then for trading you would probably want to stick with the most liquid coins so you can get in and out very fast on any exchange. If you wanted to tray this on less volatile markets then changing the inner deviation band to ~0.75 would work okay in various futures markets likely stocks as well. The take profit and stop loss levels are based on a multiple of the trading range looking back the past 7 candles.
Attached result is trading 1 BTCUSDT contract on Binance.

BTC Health (OHLC and TEMA)The "health" (ie, price trend) of Bitcoin has a major influence on the whole cryptocurrency market. Therefore, it can be useful to check the price and trend of BTC prior to entering a new position. This indicator displays BTC candles plus a fast & slow TEMA below the primary chart, so you can check how BTC is behaving.
BTC quote is from BINANCE, using the timeframe of the main chart. TEMA periods can be customized.

Linear RSIThis is an attempt to create a strategy based on the previous post. The strategy, as before, is based on the RSI, which is calculated using linear regression, but with the addition of EMA. The crossing of EMA and RSI is a buy and sell signal. There are also two functions to buy (because I haven't decided which is really better), so please use checkbox to order which one you would like to use.
TemaI have found that such simple crossover can show good results. Basically it has only 2 TEMA and nothing more. I don't know what else to write here. The code is simplest and has only one filter, which take into consideration the direction of chart.

Volume AdvancedI have found out this script some time ago. In fact it is not my code (just have modified a little) and I don't know the author (couldn't find). So now I would like to share with the community, maybe somebody would have some idea how to make it better. The script itself is modified volatility oscillator (like ATR) based on volume, making a deal at the moment of price change. To recognize the current trend I have add simple function just to compare the current price with the N bars before, because sometimes in moments of high volatility there may be wrong signals.
BTC Multi Exchange Perpetual PremiumThis script tracks the premium/discount of Bitcoin perpetual contracts at various exchanges.
The premium/discount is calculated against an index price. The index price is calculated from spot exchange prices and are weighted as follows:
Bitstamp:28,81%
Bittrex:5,5%
Coinbase: 38,07%
Gemini: 7,34%
Kraken: 20,28
The difference between this script and other available scripts, is that exciting script seems to only focus on one exchange. This script is also open source.

Heikin Ashi + Price Action Crypto LONG StrategyThis is a simple and efficient crypto strategy, designed for big timeframes like 12/24h.
On history it beats buy and hold strategy in many ocasions, and because of a low DD, pyramid can be used to elevate our winnings while still keeping a low DD < 40% avg.
For the purpose of this example, I used 100% of the capital on each trades, together with a comission of 0.1%
Warning : THERE IS NO STOP LOSS ON THIS STRATEGY ,USE IT AT YOUR OWN RISK
This strategy is made with inside Heikin Ashi candles , together with some price actions logics like for long Close > High and green candle and High > High .
We exit when we have a red candle and the current close is lower than the previous Low
If you have any questions, message me in private !

BTC Longs & Shorts Profile WHAT DOES THIS INDICATOR DO?
I started with the idea of creating another premium indicator with a bunch of features and add it to the bundle. However, the more complex the code was becoming, the less helpful the indicator actually was. So I started from scratch and made BTC Longs & Shorts Profile super simple (as you can see in the code).
The advantage over other similar indicators is that this one has a drop-down menu and allows you to select whether you want to see Longs, Shorts, Ratio, or Difference. Having Longs and Shorts at the same time is a bit confusing because Longs pretty much dwarf the Shorts and the ups and downs are not clearly visible. Also, you can configure the colors for each visible line.
My suggestion is to add this indicator to your BTC chart, save it as a template from the top menu on TradingView and stop switching between BTC, Bitfinex Longs and Shorts. You have everything in one simple window (that's especially the case if you are not a pro or premium member and can't have more than 2 screens simultaneously).
ANYTHING ELSE ?
On a side note, if you are planning on working on a similar indicator, let me tell you what I've tried so far and it didn't work for me:
- RSI calculations including Longs and Shorts as a base
- Longs and Shorts in relation to BTC itself and a relationship with the volume
- Directional Movement Index, where Longs are DM+ and Shorts are DM-
- Smoothing both Longs and Shorts and trying to find a relationship (including some pseudo MACD lookalikes)
Anyway, if you have any ideas or suggestions on improving this indicator, please let me know. Thanks!

Bitcoin Binance Sentiment IndexThe divergence of the price between the futures and spot markets for perpetual contracts could be a gauge of sentiment on a traded cryptoasset.
Sentiment analysis could be used to improve the the predictive value of technical and fundamental analysis.
The price of the perpetual contract is divided by the spot price for Bitcoin on Binance and two simple moving averages of this ratio are plotted together. For graphical purposes, the ratio between the two prices has been multiplied by 100. The moving averages were chosen arbitrarily and can be changed. Values above 100 mean that the average price of the futures over the last x periods was above the spot price over the same period. Conversely, values below 100 mean that the mean price of the futures over the last x periods was below the spot price over the same period. The indicator has been created for a daily timeframe.
This indicator is clearly intended for educational purposes only and does not constitute investment advice.
If you are interested in updates on this indicator or interested on sentiment analysis, put a like, subscribe or contact me in pm.
BIO

GBTC Fomo Panic PremiumIt is rumored that GBTC price action leads the Bitcoin market. This indicator compares GBTC fomo/panic levels to the (Binance) BTC spot market. Fomo is measured as large percentage moves of the high price from the min over a look-back period. Panic is measured as large percentage moves of the low price from the max over a look-back period. A prime example of this indicator's usage would be as a sell signal confirmation during the 2020 pre-Thanksgiving panic exhibited on the 1-hour chart while the 20 EMA was still above the 99 SMA.
You can customize the leading and lagging markets and the length of the lookback period. I would love to hear what parameters, markets and timeframes work for you. Maybe there is a way to leave comments, or hit me up on Twitter: @thirdreplicator
May you profit and enjoy.

Crypto ZigZag RSI strategy 15minThis strategy is designed for crypto markets like ETHUSD/T, BTCUSD/T and so on.
It works amazingly with 15 min time frames.
Its idea consists in :
We have the RSI indicator, and with it we check for the crossover with overbought and oversold levels. At the same time we have the zigzag which is made from the higher highs and the lower lows between a specific price movement in %.
For entries, they are going to be based on the crossover of rsi with overbought or oversold levels , combined together with cross over 0 line from the the zigzag.
At the same time the strategy has the posibility to go only long, only short or both.
Let me know if you have any questions.

BITCOIN Miners Revenue VS Price Correlation OscillatorUse 3D(3-day candle) as timeframe for best reading.
------
original template for Correlation indicator was created by obaranova. credit goes to her.

[2020 Updated]Bitcoin Logarithmic Growth CurvesCredit goes to the original writer of the script, Quantadelic, who generously allowed anyone to copy/edit. I adjusted the value of the bottom/top intercept and slope to better fit the March 2020 coronavirus dip.
Use Bitstamp BTCUSD for better reading.


MA * Fibo levels (canal)Some updates to the scrypt "MA * Fibo levels (auto)"
In the previous scrypt we drew lines using either highs or lows of the candles due to the positiveness or negativeness of given percentages.
But, after some research it seems easier to use CANALS to buy or sell rather than LINES. So these canals are the intervals between SMA(highs) and SMA(lows) multiplied by FIBO coefficients. However, lines can be also used as stop-losses if the price goes out of the canal, and wait until the price reaches the other canal.
Good luck in trading!
If the scrypt was useful let me know!
Any feedbacks and ideas are welcomed!

Stoploss indicatorGood for setting trailing stops and stoplosses when your taking a scalp etc, most recommended for manual trailing stops
Simple EMA trend indicatorSimple EMA trend indicator , pretty straightforward green equates to bullish and usually a retest/wick is often seen , same for the flipside viceversa
