Bulls vs BearsThis indicator helps show whether Bulls or Bears have more power at a given time.
On the chart, you can see how one might use this indicator for entry, exit, and confirmation.
The math used to calculate the indicator line is as follows:
bullPower = high - MA
bearPower = low - MA
indicatorLine = bullPower + bearPower
If the indicator is above the baseline of 0, line is green and Bulls are in power.
If the indicator is below the baseline of 0, line is red and Bears are in power.
Baseline is defaulted to 0. This can be changed in either direction to create more confirmation about bullish or bearish. This line determines the color of the indicator line.
The dark band/channel is based on the Average True Range (ATR). The channel size can be adjusted. When the indicator line moves outside of the channel, it is an extremely strong indicator of who is in power and may precede a reversal or slowdown.
Settings that can be adjusted:
ATR Multiplier - adjusts the size of the channel. Default is 3
Source (default hlc3)
Moving Average Length - Default is 13.
Moving Average Type
- EMA
- SMA
- SMMA (RMA)
- WMA
- VWMA
Baseline - Sets color of indicator line to show what's bullish/bearish. Default to 0.
Colors:
- Indicator Line Colors
- ATR Band upper & lower lines
- ATR band background
Corak Bulis

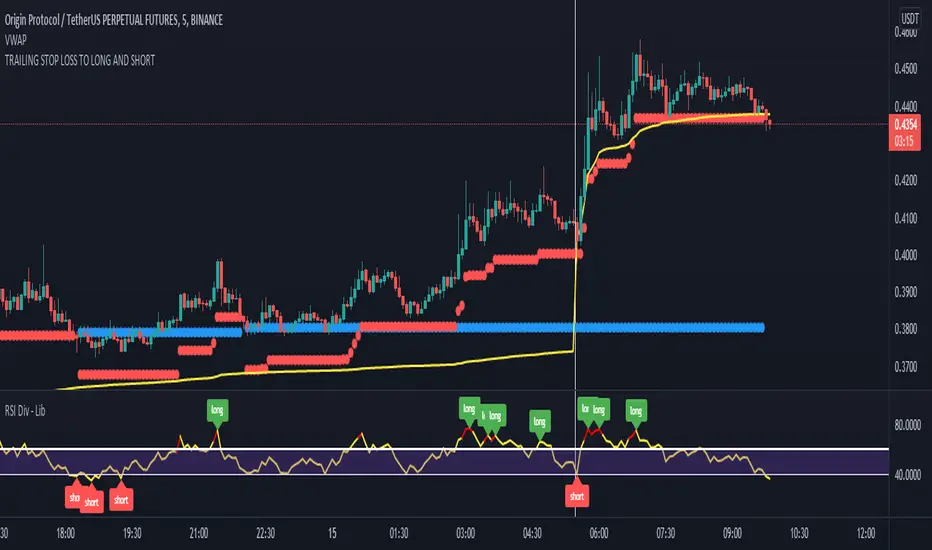
JG RSI/MFI/divergence IndicatorThis is a combination of
- RSI (relative strength index)
- MFI (money flow index)
- Divergences on the RSI
MFI behaves much the same as RSI but it more responsive/to some degree a leading indicator. I find it helps having this overlayed with RSI to help gauge price action and sentiment, as well as for confluence with RSI.
MACD Multiple AlertsThis script help traders to catch bullish and bearish momentum. It creates an alert for 40 altcoins based on the MACD cross over and cross under.
The MACD input are adjustable in the settings and you can choose your favorite assets.
Simply add this indicator to the chart wait that if finish to load and then create an alert on the time frame of your choice.
Enjoy your trading
F_rank_01

Glow Node VolumeThis volume indicator overlays bullish and bearish bars so you can see exactly who's winning the fight
also includes an information box that reads the markets trend to tell you whether it's safe to enter and trade in which direction.
Display Info Box
This box is used to advise whether it's safe to take a trade and tell you what direction (Short / Long).
It analyses the market to find the trend, Then when there is a safe time to take a trade it will advise in the direction the market is trending.
Green / Red Dots
The dots on the top of the indicator give you a quick and easy way to see who's winning the fight buyers or sellers as an average over the last couple bars

LOKEN (v4) BULLISH SMART MONEYThis indicator is based on Smart Money MCDX
(Pine editor @v4)
Indicator built for cryptocurrencies.
Best for day trading.
The coin seems overbought but still pump? Check this indicator
This indicator help you see when institutional buyer enter/exit trade and is a good combination with RSI + Stochastic RSI .
This indicator focus on buying activity by big players and is built for LONG or SPOT, shorter can still use it to determine when to exit short (if smart money appear on a significant TF you may not enter/stay in a short).
Banker plot show strong buyer activities (appear generally when RSI already overbought but still increasing).
It appear as a Histogram with a color code to better see the fading strength of the institutional activity :
Light Blue Bar = Institutional presence ( bullish )
Green Bar = Pump candle (very bullish ), (Banker > Banker MA)
Orange Bar = Retest candle = natural decline after a growth (Banker < Banker MA)
Black Bar = Down candle = progressive exit of institutional leads to this candle, you must have TP before.
Red Bar = Dump candle = steep decline, the institutional take profit hard. You better be out before that one.
Hot-Money plot show momentum and react fast to price action.
It appear as a filled zone (red or green) depending on the plot position compared to its average.
In a downtrend you may only see this one.
Key-Signals:
"Bullish signal 𓃓" = open a long
"Sell signal 💲" = close the long
I recommend you don't keep all the signals enabled at first.
(feel free to ask me the use of the other signals)
It seemed to me that SMART MONEY MCDX was counter-intuitive and archaic,
So i made this one for personal use,
I'm happy if this indicator helps you,
Have a good trade

Jae Flow+Jae_Folw+
- Auxiliary indicator that can judge the overall flow / short-term flow of the market
- Flow Chart is divided into upper / middle / lower part
- There is no timeframe limitation, but like the existing divergence trading, we recommend trading by specifying the mainframe.
🔋 (green line) : It is written with an algorithm based on (5 33 / 10 66 / 20 1212) "3 Stochastic", and is used to check the double peak/double bottom easly.
➕ (Cross): Reports Gold Cross/Dead Cross of existing (5 33 / 10 66 / 20 1212) "3 Stochastic".
🔷 (diamond): It is written with a DCP-based(MA+Volume Trend) algorithm to indicate the turning point of the trend
🌈 Basics of trading 🌈
Reversal of Trend Requires Diver/Finale
A chart with a large trading volume cannot go in the opposite direction.
To relieve the moving inertia, after the beam is finished, the beam is crossed and the wave is drawn (during this sidewalk, a divers of an appropriate size is generated)
Indicators to help you know when and where this inertia will end
Trade with the idea that the downward ball changes its inclination and catches the flow in the opposite direction.
It takes longer than I thought for the ball to stop and move in the opposite direction.
🌈🌈
====Usage====
====Basically recommend using divergence as a base, judging the flow of wave (market) with Jaeflow====
📍0. Identifying mainframes and specifying frames to buy and sell
📍1. "Top Flow"
A Need to check the double ceiling/double bottom of the green line of “top flow” (think of the green line as RSI and check the divergence with the candle BEST)
B Cross signal from double ceiling/double floor = flow is changing
C Does a diamond occur at this time + what is the shape of the lower "interrupted flow" (overbought/overbought? double floor/ceiling? etc.)
D Rather than trading with “upper flow”, it is better to see the upper flow following the stop flow
📍2. "Middle Flow"
A Use the same as above
B "Middle flow" consists of the strongest signal to judge the flow
C Active participation in trading if the “Top flow” double peak + stop flow double bar + cross signal + diamond signal continues
📍3. "bottom flow"
A When the above trading conditions are established, check whether the "bottom flow" is also the form immediately preceding the desired shape (BEST)
B If you can see the double-floor/double-ceiling shape in "Bottom Flow", it is recommended to increase the time frame by one level (there is a possibility that it is not the main frame)
📍4. "2 diamonds" or "3 diamonds"
A If “upper/middle/lower flows” occur at the same time, it can be seen as a signal of a strong trend reversal.
🥇 "When Diver Occurs" 🥇
Use it to overlap with items 1,2,3,4 above to judge the trend
===============================================================================================
🥇 Jaedie 사용자를 위한 JaeFlow
- 시장의 전체 흐름 / 단기 흐름을 판단할 수 있는 보조지표
- Flow Chart는 상단 / 중단 / 하단부 로 나뉜다
- 타임프레임의 제한은 없지만, 기존 다이버전스 매매와 같이 메인프레임을 특정하여 매매를 추천
🔋 (녹색선) : (5 33 / 10 66 / 20 1212) 3스토 기반의 알고리즘으로 작성되어, 쌍봉/쌍바닥을 확인하는데 쓰임
➕(크로스) : 기존 (5 33 / 10 66 / 20 1212) 3스토의 골드크로스/데드크로스를 알려줌
🔷(다이아) : DCP기반의 알고리즘으로 작성되어 추세의 전환점을 나타냄
🌈매매의 기본에 대하여🌈
추세의 전환에는 다이버/피날레가 필요함
큰 거래량의 빔형태의 차트가 바로 반대방향으로 갈수는 없음
움직이던 관성을 해소하기 위해 빔이 끝난 후 횡보를 하며 파동을 그림 (이 횡보 도중 적당한 크기의 다이버가 발생하게 되고)
이 관성이 끝날 타이밍과 흐름(Flow)을 알 수 있도록 도와주는 지표
내려가던 공이 기울기가 바뀌어 반대방향으로 굴러가는 흐름을 잡는다는 생각을 하며 매매를 수행
이 공이 멈춰가며 반대방향으로 움직이기엔 내 생각보다 더 긴 시간이 필요함
🌈🌈
====사용법====
====기본적으로 Jaedie의 다이버전스를 Base로 활용 추천, Jaeflow로 파동(시장)의 흐름을 판단====
📍0. 메인프레임 특정 및 매매할 프레임 특정하기
📍1. "상단 플로우"
A "상단 플로우"의 녹색 선 쌍천장/쌍바닥을 확인해야 함 (녹색 선을 RSI라 생각하고 캔들과의 다이버전스를 확인 BEST)
B 쌍천장/쌍바닥에서 나오는 크로스 신호 = 흐름이 변하고 있다
C 이때 다이아가 발생하는지 + 아래쪽 "중단 플로우"의 형태는 어떠한지 (과매수/도 인지? 쌍바닥/천장 인지? 등)
D "상단 플로우"로 매매를 수행하기보단 상단 플로우가 중단 플로우와 이어지는 형태를 보는게 좋음
📍2. "중단 플로우"
A 위와 마찬가지로 활용
B "중단 플로우"는 흐름을 판단하기에 가장 강력한 신호로 이루어져 있음
C "상단 플로우"의 쌍봉 + 중단플로우의 쌍봉 + 크로스 신호 + 다이아 신호등이 이어진다면 매매에 적극적으로 참여
📍3. "하단 플로우"
A 위의 매매조건이 성립했을때, "하단 플로우" 또한 원하는 모양의 바로 직전형태인지 확인(BEST)
B "하단 플로우"에서 대놓고 쌍바닥/쌍천장의 형태가 보인다면 타임프레임을 한단계 높이는걸 추천 (메인프레임이 아닐 확률이 있음)
📍4. "2다이아" or "3다이아"
A "상/중/하단 플로우"가 동시에 다이아가 발생하는 경우 강한 추세전환의 신호로 볼 수있음
🥇 "Jaedie 다이버 발생 시" 🥇
위의 1,2,3,4 항목들과 중첩하여 사용하여 추세를 판단
캔들이 빔을 쏘는 도중 or 관성이 끝나지 않은 도중 반대포지션 진입을 자제합시다
충분히 유연한 곡선으로 그려질 경우 + 다이버가 추가 될 경우 포지션 진입을 하는 매매습관을 들입시다

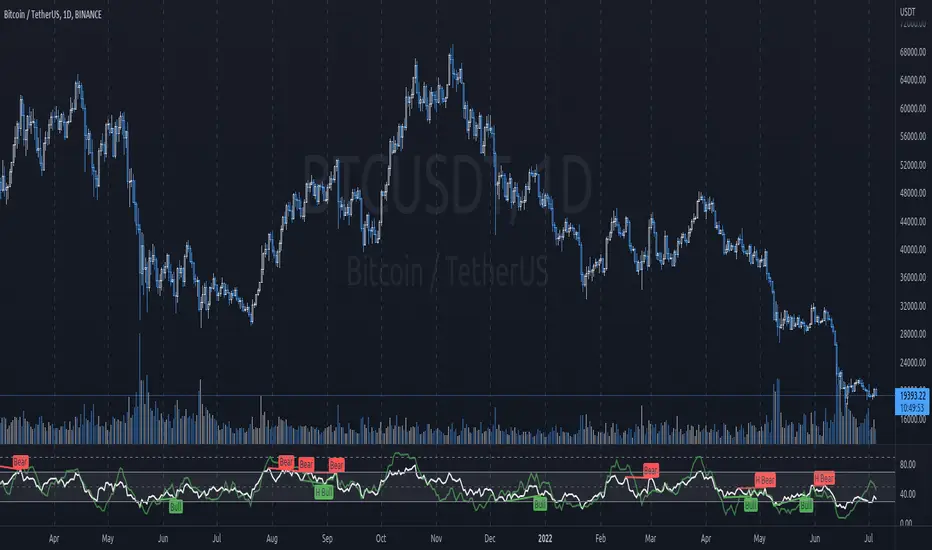
Artharjan - RSI and RSI-Moving Avg Crossover SignalsHi,
I have created "Artharjan - Index Heavy Weight Components RSI and RSI-Moving Avg Crossover Bullish/Bearish/Neutral Signal" (Short Name - ARSICROSSOVER) indicator for Traders whereby they can see the RSI and RSI Moving Average Values for Indices and Index heavyweight Components at the same time in a Dashboard.
The analysis is based on 2 different timeframes. Basically when Higher timeframe RSI is Bullish and Lower timeframe is Bearish then you enter the LONG trade when Lower Timeframe RSI shows "Bullish Reversal Signal" &
when Higher timeframe RSI is Bearish and Lower timeframe is Bullish then you enter the SHORT trade when Lower Timeframe RSI shows "Bearish Reversal Signal"
The two timeframes which I have selected by Default are Weekly (Higher timeframe) and 30 min Lower (Trade Entry) Timeframe
Also I have used to source to calculate the RSI as 5 period WMA of hlc3, if you want use raw RSI to generate crossover signals then change the source to "close" and input soothing to '1' instead of '5'
The system generates very accurate Buy and Sell Signals and when the script is range bound in its respective timeframe it shows Neutral signal
The overbought and oversold levels for Higher and Lower timeframes are set to be 60/40 and 70/30 respectively, however Traders may change these levels as per their preferences.
For intraday trades I would recommend using Higher time frame as "Daily" and Lower (Trade Entry) Timeframe as "15 min"
For Swing trades I would recommend using Higher time frame as "Weekly" and Lower (Trade Entry) Timeframe as "75 min"
For Positional trades I would recommend using Higher time frame as "Monthly" and Lower (Trade Entry) Timeframe as "Daily"
Also you can select maximum 10 Scripts at any given point in time.
My recommendation would be to use Sector Index as Script 1 and then Heavy weight components of that Sector in Script 2 to 10
This will help you to identify which Stock is responsible to pull index Up or Down and then you may decide to take either a Long Trade or Short Trade accordingly.
The Background Color and Bullish/Bearish/Neutral stages are decided based on following logic
1] If Higher timeframe RSI > Overbought Level - Stock is in a Bull Run
2] If Higher timeframe RSI > If Higher timeframe EMA of RSI = Positively Bullish
3] If Higher timeframe RSI < Oversold Level - Stock is in a Bear Run
4] If Higher timeframe RSI < If Higher timeframe EMA of RSI = Positively Bearish
5] Bulls will be said to have control if Condition 1 & 2 are true
6] Bears will be said to have control if Condition 3 & 4 are true
7] The Stock/Index will be said to be in a Neutral zone if its RSI is less than Overbought Level but greater than Oversold Level
The same rules are applicable for a Lower (Trade Entry) Timeframe
Hope you guys like this indicator and are able to make decent money by using it.
Regards
Rahul Desai
@Artharjan

AMACD - All Moving Average Convergence DivergenceThis indicator displays the Moving Average Convergane and Divergence ( MACD ) of individually configured Fast, Slow and Signal Moving Averages. Buy and sell alerts can be set based on moving average crossovers, consecutive convergence/divergence of the moving averages, and directional changes in the histogram moving averages.
The Fast, Slow and Signal Moving Averages can be set to:
Exponential Moving Average ( EMA )
Volume-Weighted Moving Average ( VWMA )
Simple Moving Average ( SMA )
Weighted Moving Average ( WMA )
Hull Moving Average ( HMA )
Exponentially Weighted Moving Average (RMA) ( SMMA )
Symmetrically Weighted Moving Average ( SWMA )
Arnaud Legoux Moving Average ( ALMA )
Double EMA ( DEMA )
Double SMA (DSMA)
Double WMA (DWMA)
Double RMA ( DRMA )
Triple EMA ( TEMA )
Triple SMA (TSMA)
Triple WMA (TWMA)
Triple RMA (TRMA)
Linear regression curve Moving Average ( LSMA )
Variable Index Dynamic Average ( VIDYA )
Fractal Adaptive Moving Average ( FRAMA )
If you have a strategy that can buy based on External Indicators use 'Backtest Signal' which returns a 1 for a Buy and a 2 for a sell.
'Backtest Signal' is plotted to display.none, so change the Style Settings for the chart if you need to see it for testing.

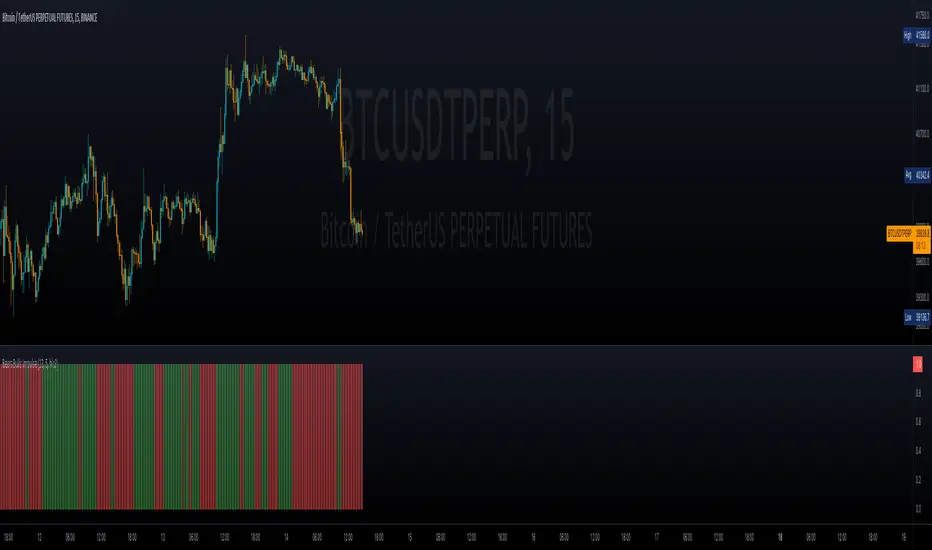
Bears Bulls Impulse█ OVERVIEW
Maybe another version of the Bears Bulls indicator, but with a unique interpretation on the scripts found here on Tradingview. Again, this indicator is not meant to be used alone but as an entry/exit confirmation with other indicators.
█ CONCEPTS
Using a modified version of the WMA indicator, the LWMA , this indicator will work similarly to the Bears Bulls Power indicator. Quoting from Admiral Markets, "Bulls Power measures the capability of buyers in the market to lift prices above an average consensus of value. Bears Power measures the capability of sellers to drag prices below an average consensus of value. Using them in tandem with a trend measure allows you to identify favorable entry points."
█ HOW TO USE IT
As soon as the color changes, it indicates a change in the price direction and divergences. Green buy, red sell? Not that simple, but following that pattern for scalping may result in some good entries. Following this indicator blindly will not be accurate as using another indicator to filter the signals in favor of a major trend (that indicator could be another Bears Bulls Inpulse from a higher time frame)
Botvenko ScriptI just test&learn pine script...
Damn, what should I write here? So... Its just a differense between the logarithms of two prices of different periods (You can set the period you want)... And it looks really nice... Ahem...
I hope, you enjoy this piece of... Have a nice day, my dear.
Lankou VS BTC all
/!\ To make it work well use -> pin at new right scale
This script displays the comparison with BTCUSDT
it permits to see if an asset is gaining value against BTC, and fastly scan USDT asset to determine if they are bullish
It works for ANY asset, as it's dividing it's price by the BTCUSDT one

Bias Pivot PointA simple indicator that uses Pivot Points as a filter and to generate a Directional Bias .
How to use this indicator?
1. Directional Bias
Bullish => Closing Price > Pivot Point
Bearish => Closing Price < Pivot Point
2. Support / Resistance
Each Pivot Points can be used as Support or Resistance
3. Take Profit Targets
Each Pivot Points can be used as targets for taking profit

Naked Bar Upward ReversalAMEX:SPY
The Naked Bar Upward Reversal is a three bar candlestick pattern with an inside candle as a entry point. This pattern is bullish since it has a candle closing red from the previous candle; the most bearish pattern possible. The following inside candle is a reversal of its previous candle with an open above the previous candle's close. Look to buy the next open above the inside candle's close.
This is a bullish reversal pattern and should be used in this context. Successful entries are found in corrections along an upward trend, or buying into a dip. Performance drops when the pattern appears at tops. To improve profitability, use a cluster of evidence to enhance the performance of this pattern. The intended time frame is within the daily and weekly.

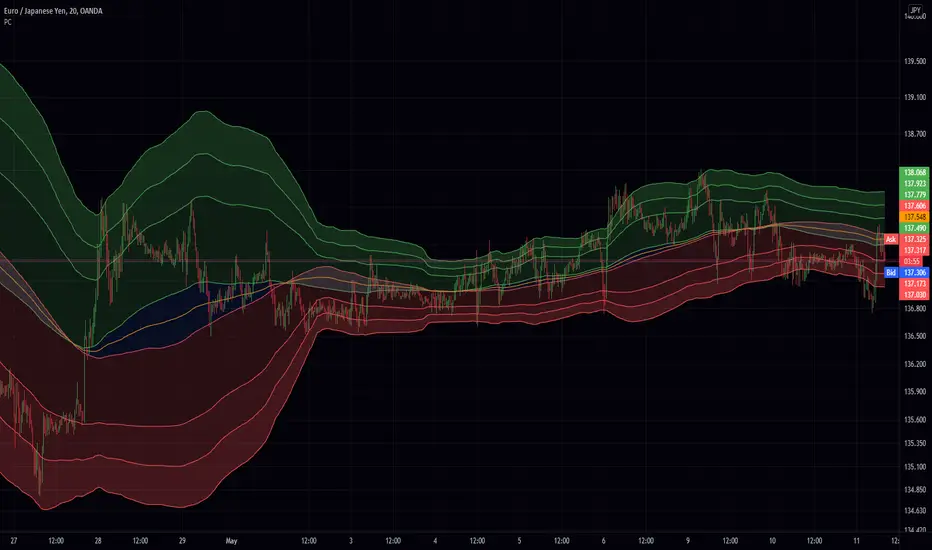
K's EnvelopesTrading is all about finding reactionary levels from where we assume prices will take a certain direction. And from that assumption, we initiate either a long (Buy) position or a short (Sell) position. Many techniques can be used to find support and resistance levels such as pivot points, Fibonacci retracements, and graphical levels. However, these techniques are all static in time, i.e. they do not move with real time data. In contrast, moving averages are dynamic and do a great job at finding support and resistance levels.
The idea of K's Envelopes is to form support and resistance zones so that we find good entry points. It is a combination of two 800-period moving averages where one is applied to the highs and the other applied to the lows, thus forming a moving zone used to support or place a ceiling on the market price.

The Namib SpikeThank you to Karl S who coded my idea. Below are the trigger conditions. Testing would be welcomed. I have not looked at the effectivity on higher or lower timeframes. Feedback highly appreciated.
A 3-tiered alert/notification system:
Level 1 Alert (Pop-up notification "Level 1 Bullish Alert" or "Level 1 Bearish Alert"
1. Determine bullish or bearish trend of price above or below 200 EMA
2. RSI level (customizable level)
3. ADX (customizable level as well as option to filter that the current ADX value is higher/lower as 1,2,3,4,or 5 candles ago)
AND/OR
Level 2 Alert (Pop-up notification "Level 2 Bullish Alert" or "Level 2 Bearish Alert"
1. Determine bullish or bearish trend of price above or below 200 EMA
2. RSI level (customizable level)
3. ADX (customizable level as well as option to filter that the current ADX value is higher/lower as 1,2,3,4,or 5 candles ago)
4. Higher Timeframe trends for 2 higher Timeframes (price above/below 200EMA) agrees with current Timeframe
AND/OR
Level 3 Alert (Pop-up notification "Level 3 Bullish Alert" or "Level 3 Bearish Alert"
1. Determine bullish or bearish trend of price above or below 200 EMA
2. RSI level (customizable level)
3. ADX (customizable level as well as option to filter that the current ADX value is higher/lower as 1,2,3,4,or 5 candles ago)
4. Higher Timeframe trends for 2 higher Timeframes (price above/below 200EMA) agrees with current Timeframe
5. Percentage (customizable) from previous H1/H4/D1/W1's (customizable) high & low prices

Price Clouds (PS)Price could shows you dynamic support resistance levels. It also displays two bands (ie clouds) that show you where the trend is. If the price hits the bottom of the high band thats a buy and if it hits the top of the high band its a sell. During times of volatility the price can break support but you will find that the opposite band will work as the next level. I added tool tips for every option to help explain what everything does and I also left suggestions for other settings.
This works great on everything! That being said I have this setup in a general way that works really well for 20m forex. If you are scalping you might want to speed up the indicator. This is also true if you want go to the daily chart or above. Adjust the Stdev to match the market.. and I mean really play around with.. dont be shy! With all that out of the way this really will work out of the box. If you like this indicator its actually the same thing as my (PBS) but this one is an overlay on the chart. (Also as of publishing this script the code for this version is way cleaner. In fact I plan on replacing PBS with this as its base)
If you find this indicator is useful to you, Star it, Follow, Donate, Like and Share.
Your support is a highly motivation for me.
4x Stochastic Dingue4 Stochastic indicator into 1.
Different lengths produce short-term and long-term indicators that can help with finding the trend and impulses within the trend.
It can also find reversal points when all 4 are at the extreme at the same time. Ex. All 4 Stoch are above 90 or under 10 !! This could signal a bottom or top is soon to happen. (This is not always true as it depends on many factors.)
Many visual options make it even more customizable. Fill between Stoch, background colors, Crosses.
Divergences are not always accurate, depending on settings and timeframe, but they can be useful in certain situations.
---------------------
In closing, no indicator can give perfect signals, you need to use them in conjunction with other information to make better decisions.
I hope you like my indicators and that they help your trading.
If you have any questions please ask.
Thank you.

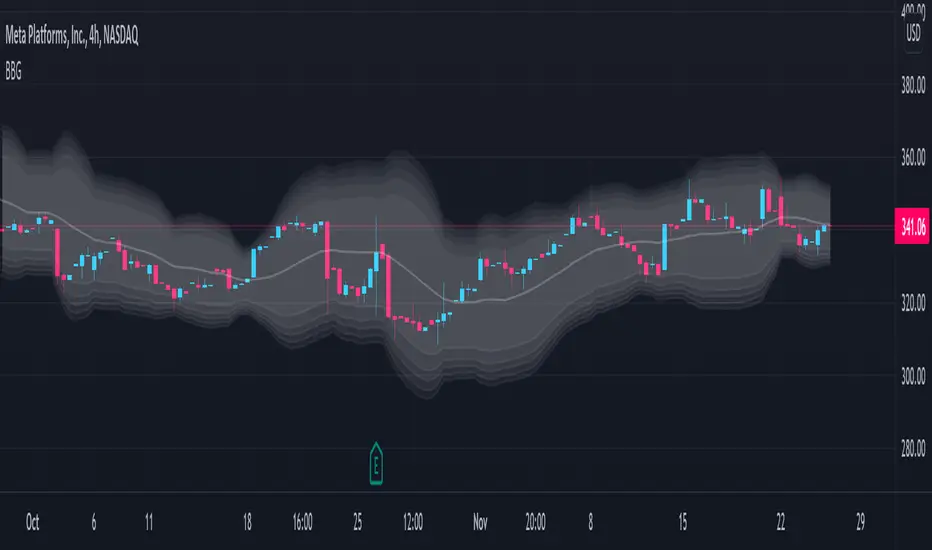
Bollinger Band Gradient (BBG)The Bollinger Band Gradient Indicator uses plenty of Bollinger Bands to create a gradient-looking indicator to help with layered entries . It is similar to a Ribbon but better. This indicator is best used with any volume-related indicator so you can recede from entering into any position with too much momentum to rebound off of any line. Note that this indicator is best used with another strategy like pair trading. It is not recommended to trade based on this indicator only . Please stay aware of any news about the stock you are trading because some events may have a big impact and force the market to go bullish/bearish by a lot. This indicator can be used with all chart types and works well with many other indicators. It allows for complete customization and offers easy-to-understand settings which can be designated to a certain individual. You can modify all settings for the BBs which allows for an even more personalized and adapted Indicator that reflects your trading/ investing needs. You also have the option to choose which type of MAs will be used to create the Bollinger Bands , a few of which include: SMA, EMA, WMA, HMA, RMA, DMA, LSMA, VAMA, TMA, MF.
Bollinger Bands are a way to measure and visualize volatility . As volatility increases, the wider the bands become, and the more they deviate from the basis. Likewise, when volatility decreases, the gap between the bands and basis decreases. Yet a big advantage for not only this but many other indicators is created due to the ample count of different settings that are widely used, it is difficult to view the market through the eyes of all types of investors/traders . This indicator manages to counter exactly this issue, you will be able to see all of these settings on one chart and at one time and enter/exit positions accordingly.
Using this indicator will allow you to visualize entry and exit points with ease and make order layering (buying/selling in layers) much more simple. You can choose a certain amount of Bollinger Bands you would like displayed and customize all technical and style-related settings related to the BBs .
A few of the technical settings you can change for the Bollinger Bands are:
Bollinger Band count (Select how many BBs you want to be displayed.)
MA type used to make the Bollinger Bands ( EMA, SMA, WMA, etc.)
Source (close, open, high, low.)
BB length separately (The length of each Bollinger Band, its lookback. How many previous candles should it be based on? Choose each Bollinger Band's lookback length.)
BB deviator separately(The standard Deviator applied for the BB for both the upper and lower line.)
A few of the style settings you can change for each Bollinger Band are:
Fill (the color used to fill from the upper to the lower band)
Fill opacity % (the opacity used when filling the upper line to the lower line)
This indicator is unique because it can be used for all strategies and all trading styles , for example, day trading or long-term investing, really anything if used correctly. The reason it can be used in so many instances is a result of the detailed and in-depth settings tab that allows for complete customization. This allows the indicator to be used and to be useful in various situations and allows you to dominate the market. Integrated alerts also enhance your efficiency while using this indicator because you can choose to be notified at the crossing of any of the Bollinger Bands.
The technical part of this indicator plots the selected amount of Bollinger Bands using custom-built specified Bollinger Bands accordingly. Then it uses the style settings and styles it as you selected.
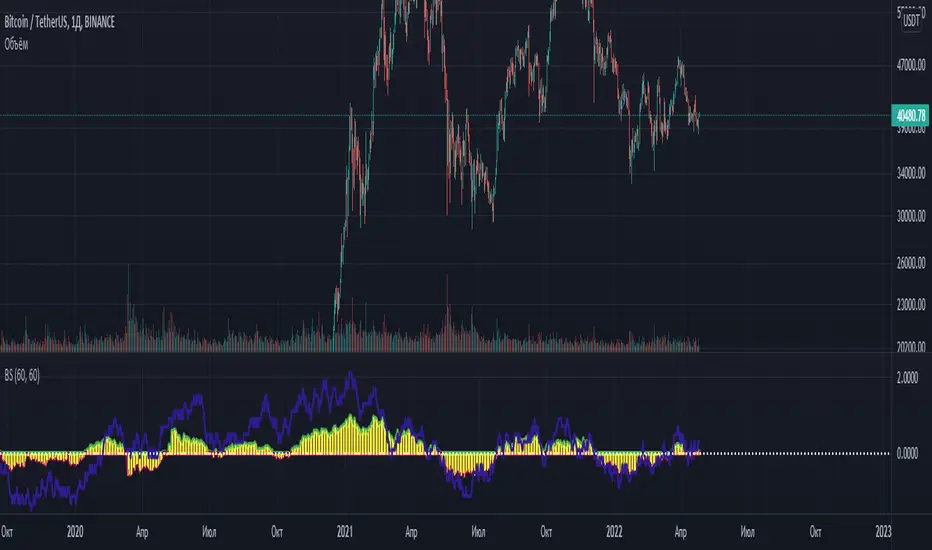
Bitcoin Bull Runs Mid Cycle Aligned This script plots 2 lines which are the 2013 and 2016 bull run. The plots are aligned on their mid cycles to the 2021 mid cycle.
Settings:
You can move the plots on the x and y axis in the settings for the Daily, Weekly and Monthly TFs.
The plot is weird on the Monthly TF, best to use the Daily and Weekly.
If it doesn't load at first you have to zoom out fully and go back to 2013 for it to load. Then it will load.

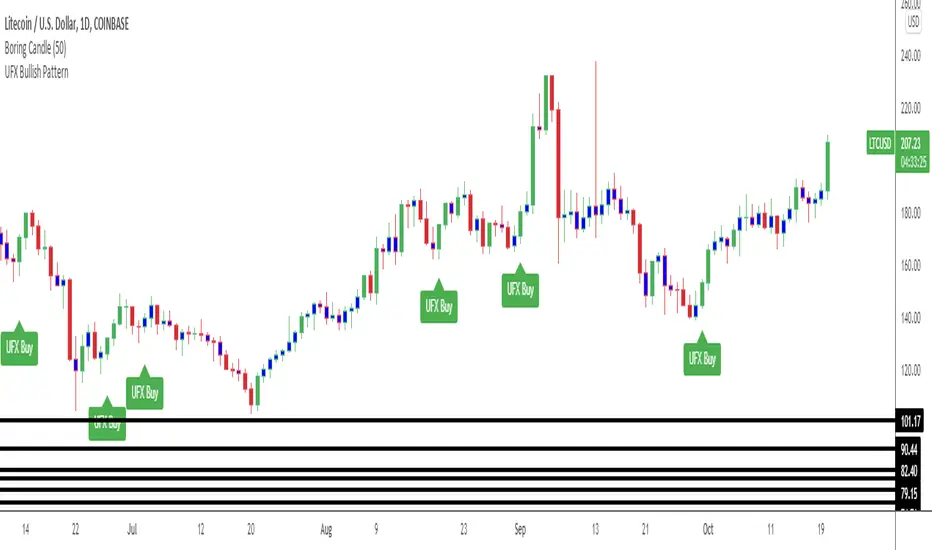
*UFX Bullish Candlstick Pattern*The UFX Buy Patern Must Consist of: Red - Blue - Green Bar or Red - Blue - Blue - Green Bar after a decline in price action.
This indicator also shows Bullish Engulfing Pattern.
Harmonic Pattern Educational Volume 0 (Source Code)This indicator was intended as educational purpose only for Harmonic Patterns using XABCD Pattern Tool.
Gartley and Butterfly patterns were ideal patterns explained from The Harmonic Trader written by Scott M Carney.
Some values are further updated later in Harmonic Trading: Volume Three, also by Scott M Carney.
The Harmonic Trader book was also known as Harmonic Trading: Volume Zero.
Usually Bullish Patterns show as "M" shape while Bearish Patterns show as "W" shape.
";" indicates range, example : 1.27;1.618 meaning that value between 1.27 to 1.618.
Indikator ini bertujuan sebagai pendidikan sahaja untuk Harmonic Pattern menggunakan XABCD Pattern Tool.
Pattern Gartley dan Butterfly, juga sebagai pattern ideal telah diterangkan dari buku The Harmonic Trader ditulis oleh Scott M Carney.
Beberapa nilai kemudiannya telah dikemaskini dalam Harmonic Trading: Volume Three, juga oleh Scott M Carney.
Buku The Harmonic Trader book juga dikenali sebagai Harmonic Trading: Volume Zero.
Kebiasaanya Bullish Pattern tunjuk sebagai bentuk "M" manakala Bearish Pattern tunjuk sebagai bentuk "W".
";" menunjukkan range, contoh : 1.27;1.618 bermaksud nilai 1.27 hingga 1.618.
Indicator features :
1. List XAB=CD patterns including ratio and reference page.
2. For desktop display only, not for mobile.
Kemampuan indikator :
1. Senarai XAB=CD pattern termasuk ratio and rujukan muka surat.
2. Untuk paparan desktop sahaja, bukan untuk mobile.
FAQ
1. Credits / Kredit
Scott M Carney, The Harmonic Trader
2. Pattern and Chapter involved / Pattern dan Bab terlibat
Bullish Ideal Gartley - Page 160
Bearish Ideal Gartley - Page 171
Bullish Ideal Butterfly - Page 194
Bearish Ideal Butterfly - Page 204
3. Code Usage / Penggunaan Kod
Free to use for personal usage but credits are most welcomed especially for credits to Scott M Carney.
Bebas untuk kegunaan peribadi tetapi kredit adalah amat dialu-alukan terutamanya kredit kepada Scott M Carney.
Bullish (M) / Bearish (W) Ideal Gartley
Bullish (M) / Bearish (W) Ideal Butterfly

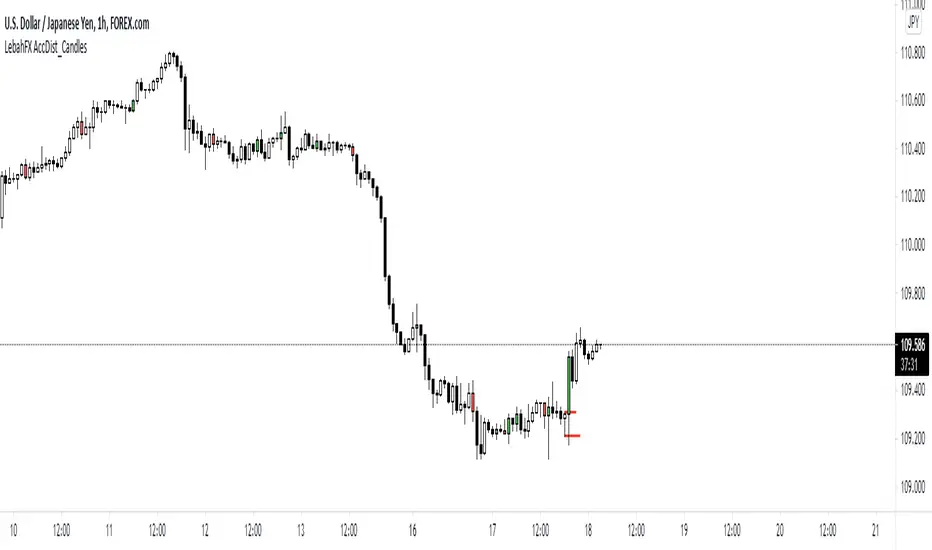
LebahFX AccDist_CandlesLebahFX Indicator that showing Accumulation and Distribution Signal in HTF Candlestick