Alex trading stragedyOverview
This script, named "ALEX TRADING STRATEGY", is a technical trading strategy designed for new investing groups. It uses a combination of various technical indicators to identify potential buying and selling opportunities in the market. The script includes the Relative Strength Index (RSI), Simple Moving Averages (SMA), Exponential Moving Averages (EMA), and Higher High Lower Low (HHLL) strategies to create a complete trading solution.
The user can change the position from long to short in the Input Settings. The script uses bar colors to indicate the current trading position. The script also has exit strategies to help manage the open trades. The user can also set the period for the various indicators used in the strategy.
The script provides various technical indicators and entry/exit signals to make the trading decision easier for the user. It also includes pivot lines, resistance and support levels to help the user make a more informed decision.
This Pine script implements a multi-indicator trading strategy that combines several technical analysis techniques for making trading decisions. The script uses the Relative Strength Index (RSI) to determine overbought and oversold conditions in the market and plots the RSI values on the chart. The RSI values above 70 are considered overbought and plotted as red upward triangles, while the RSI values below 30 are considered oversold and plotted as green downward triangles.
The script also calculates Simple Moving Averages (SMAs) with the user-defined period and plots them along with the Exponential Moving Averages (EMAs) of 20, 50, and 100 periods. Based on the crossover of the close price and the moving averages, the script enters long or short trades. The script sets the trade exit conditions as the low or high crossing the lower or upper band, respectively.
In addition to the moving average crossover, the script uses the highest high and lowest low over a user-defined period to determine long and short entries. The script plots the long and short conditions on the chart as green upward and red downward triangles, respectively. The script allows the user to switch between long and short trades by changing the input settings.
Finally, the script changes the bar colors based on the trade direction, with green bars indicating a long trade, red bars indicating a short trade, and blue bars indicating no trade. Overall, this Pine script provides a comprehensive trading strategy that combines several technical analysis techniques to make informed trading decisions.
HOW TO USE
Input Settings: In the Input Settings section, you can change the long to short position. You can also change the period value (default is 10) used to calculate the Simple Moving Average (SMA) for the Keltner channel.
Indicators: The script uses RSI (Relative Strength Index) with 14 periods as well as multiple EMAs (Exponential Moving Averages) with periods 20, 50, and 100 to help in making trading decisions.
Entry Signals: The script uses two main entry signals: (1) Keltner Channel and (2) HHLL (High-Low). When the closing price crosses above the upper band of the Keltner channel, the script generates a long signal, and when the closing price crosses below the lower band of the Keltner channel, the script generates a short signal. The HHLL strategy generates a long signal when the current high crosses above the highest high of the last "nPeriod" bars, and generates a short signal when the current low crosses below the lowest low of the last "nPeriod" bars.
Exit Signals: The script uses two exit signals: (1) Stop Loss based on Keltner channel and (2) Profit Target based on Keltner channel. The script exits the long position when the closing price crosses below the lower band of the Keltner channel, and the script exits the short position when the closing price crosses above the upper band of the Keltner channel.
To use this script, you will need to have access to a trading platform that supports PineScript, such as TradingView, and attach the script to a chart. The script will then automatically generate entry and exit signals based on the rules described above. It's important to note that this script is just a tool and not a guarantee of profit. As with any trading strategy, it's important to thoroughly test and understand the script before using it for live trading.
Buy-sell-signal

Davin's 10/200MA Pullback on SPY Strategy v2.0Strategy:
Using 10 and 200 Simple moving averages, we capitalize on price pullbacks on a general uptrend to scalp 1 - 5% rebounds. 200 MA is used as a general indicator for bullish sentiment, 10 MA is used to identify pullbacks in the short term for buy entries.
An optional bonus: market crash of 20% from 52 days high is regarded as a buy the dip signal.
An optional bonus: can choose to exit on MA crossovers using 200 MA as reference MA (etc. Hard stop on 50 cross 200)
Recommended Ticker: SPY 1D (I have so far tested on SPY and other big indexes only, other stocks appear to be too volatile to use the same short period SMA parameters effectively) + AAPL 4H
How it works:
Buy condition is when:
- Price closes above 200 SMA
- Price closes below 10 SMA
- Price dumps at least 20% (additional bonus contrarian buy the dip option)
Entry is on the next opening market day the day after the buy condition candle was fulfilled.
Sell Condition is when:
- Prices closes below 10 SMA
- Hard stop at 15% drawdown from entry price (adjustable parameter)
- Hard stop at medium term and long term MA crossovers (adjustable parameters)
So far this strategy has been pretty effective for me, feel free to try it out and let me know in the comments how you found :)
Feel free to suggest new strategy ideas for discussion and indicator building

MOM+RSI StrategyThis is a momentum based strategy which generates signals when the price moves with momentum in either direction. This strategy works well on liquid stocks. Its not necessary to close the trade as soon as the close signal is generated and one can wait for the price to move in the direction as indicated by the prior signal unless price starts to go in the opposite direction. The best set up for a trader is his/her own set up and hence it is recommended to use this strategy with your set up/research.

BUY/SELL_Strategy_Paydar_V.07BUY/SELL_Strategy_Paydar_V.07
Hello dear friends
This system can be considered as a signal system.
*** This system just Suggests you for points. ***
My suggestion is not to use this system alone and conclude about entry and exit points according to charts, news, market fluctuations and trend direction.
The agenda of this system is as follows:
- Buy signal means:
Time to enter the trade / buy / take a long position and ...
- Sell signal means:
Time to leave the trade / sell / exit the long position
* I suggest you use this system in trading for cryptocurrency and especially for bitcoin.
* My suggested time frame is 1 minute, because during this time and according to the settings of this system, a better result was obtained for me.
* I suggest using this system first in spot trading and then in future trading.
System function:
This system is based on the analysis of 74 different systems, which are:
> 19 indicators and oscillators separately which include:
MACD, RSI, STOCHASTIC, STOCHASTIC RSI, BOLLINGER BANDs, PARABOLIC SAR, VOLATILITY and ...
(All of which can be used on the Trading View site as a public domain and open source)
> 11 cases of previous oscillators and indicators in combination
(All of which can be used in public view and open source on the Trading View site)
> 27 items MA, EMA, VMA, WM, MSM, etc. in combination and separately
> 9 lines and areas of automatic support and resistance
(All of which can be used in public view and open source on the Trading View site)
> 8 different strategies, all of which can be used in public view and open source on the Trading View site
Points.
*** All indicators, oscillators, lines and areas of automatic support and resistance, strategies, etc. can be used as a public domain and open source on the Trading View site. ***
Comment on using this system as well as how to use it.
_______________________________________________________________________________
* In this system, the main and basic indicators and oscillators are used, all of which are in the public view and open source site in Trading View *
I am very grateful and very loyal to Trading View, which built all the indicators, oscillators and strategies, because I used them to build this strategy system.
_______________________________________________________________________________
Be successful and profitable.

WMA CrossoverNormally we have Moving average which is lagging indicator but in this script we have removed the lag and get signal upfront to maximize the profit and minimize the losses.
This is good for Entry purpose, for exit also it can be used but profit might be less. It is suggested to use one of the below method for exit
Target based
RSI divergence or
Price & Volume Based Analysis
VWAP (Volume for Index (Nifty & BankNifty is not available on Tradingview. Investing.com can be used for the same.)
If need more information on any of the above method, Please comment i will share more information on this either on tradingview or could be on the yourtube video.

Retail Slayer StrategyRetail Slayer Strategy
Intended Markets: Forex, Indices, Cryptocurrencies, and metals (Gold, Silver)
Timeframe Use: 15 minutes only
Trailing Stop: 35-pips for Forex
The purpose of this strategy is to answer the question many retail traders have: Why does it feel like trades go against me immediately after placing a buy/sell? This strategy puts you into the position of taking trades against the majority of retail traders.
The underlying logic of this strategy involves the use of specific momentum, volatility, intra-week, and intra-day data to determine whether certain extremes that exist in common retail oscillators are truly indicative of a corrective move or a trend reversal. This strategy checks against those conditions to monitor whether certain breaks of certain price ranges are truly honest, or just fake-outs.
The 35-pip trail is intended for all of the Intended Markets listed above (ticks/points where necessary), and the 15-minute chart is also intended for all of the above-Intended Markets. There are options for you to adjust the trailing-stop, profit target, and stop(s) to fine-tune an instrument to your desired settings. However, I would recommend you stick with the 15-min, 35-pip default settings until you are more familiar with how this strategy works.
To utilize this strategy as an alert, simply add it to your chart then click on the Strategy Tester below. You will see a small alarm clock icon next to the cog-wheel - click the Alarm Icon and you can create the alert utilizing this strategy.
You will receive a notification warning you that this strategy can cause issues with repainting, and that is a known issue. However, with any strategy, it pays to confirm and do your own due diligence before committing to any trade. This strategy is intended to help identify and confirm entries in conjunction with your own analysis.
To inquire about access, please send me a PM. Please reach out if you have any questions.

[BERA] POWER STRATEGYHey below my new strategy test, hope you like.
Work better with BTC
H1 and H4 timeframe.
How this work?
RSI based script.
-Modified length and different metrics for long and short.
Moving Averages.
-RSI panel below with color labels to identify the rsi levels.
-Simple trailing stop included.
Entry orders and exit orders for both -long and -short.
The default setup is the best perfomance i've find testing it.
If you are interest in the script contact me.

AlgoNinja RSI/MACDAlgoNinja buy/sell signal based on MADC/RSI/StochRSI data. BETA - Use at your own risk!

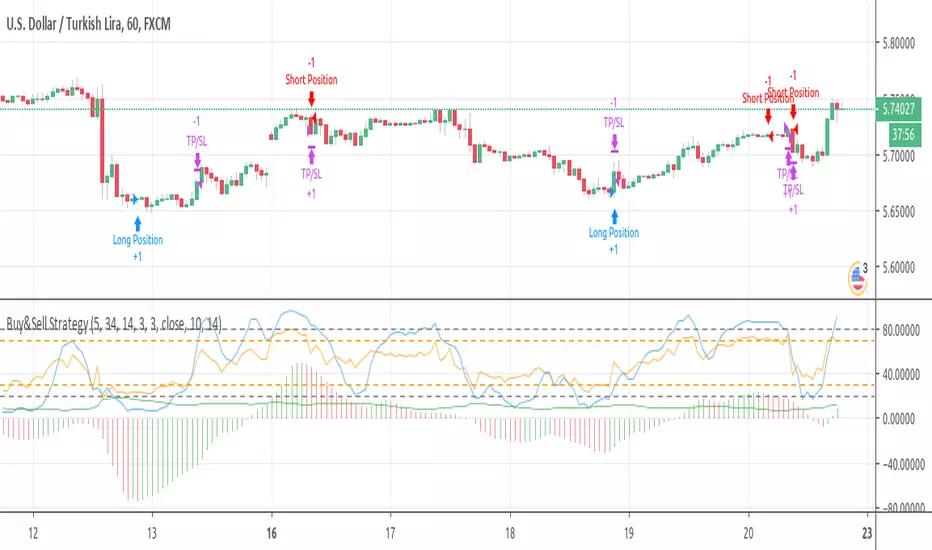
Buy&Sell Strategy depends on AO+Stoch+RSI+ATR by SerdarYILMAZThis strategy is just for training, its purpose is just learning code in pine script.
Don't make buy or sell decision with this strategy.
Turkish/Turkce
Bu strateji sadece pine script'te kodlamanın nasıl yapildigini ogrenmek icindir.
Bu stratejiye dayanarak, kesinlikle al-sat islemleri yapmayin.
How it works?
When RSI and Stoch are in oversold area and if awesome osc. turns positive, take long position. Stop loss and take profit levels were defined with ATR ind.
When RSI and Stoch are in overbought are and if awesome osc. turns negative, take short position. Stop loss and take profit levels were defined with ATR ind.
Turkish/Turkce
RSI ve Stoch asiri satım bölgesinde iken awesome pozitife döner ise long pozisyon açar, zarar kes ve kar al seviyeleri ATR indikatoru ile tanımlandı.
RSI ve Stoch asırı alım bölgesinde iken awesome negatife döner ise short pozisyon açar, zarar kes ve kar al seviyeleri ATR indikatoru ile tanımlandı.
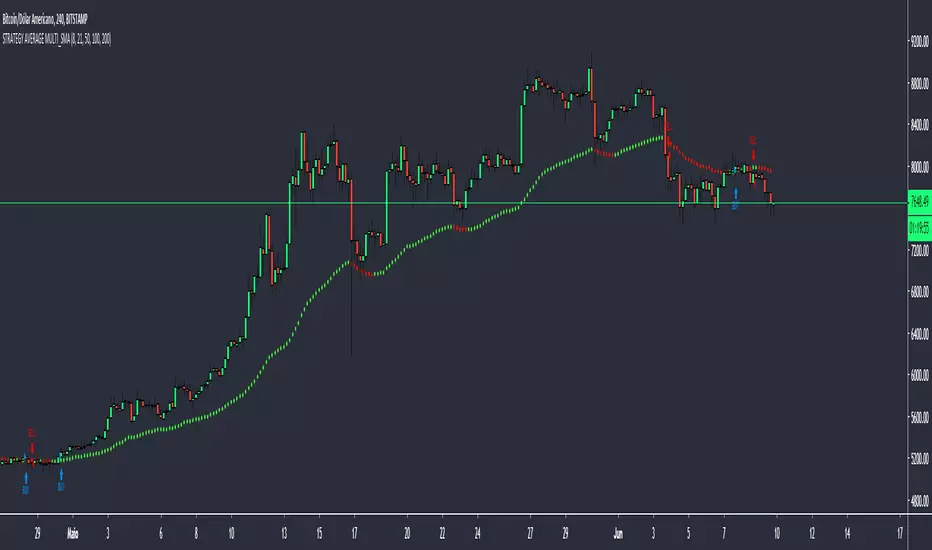
STRATEGY AVERAGE MULTI_SMAThis strategy is based on my script "AVERAGE MULTI_SMA"
The strategy is based on the created media, giving BUY signal when the price closes above the average and the average is rising. For the SELL signal the price closes below the average with the average falling.
For those who are interested in how the "AVERAGE MULTI_SMA" script works, I ask you to analyze it there, because I explain how it works.
Please do not use the indicator as the only factor to do your operations, try to use more as a study.
____PTBR_____
Essa estrategia é baseada no meu script "AVERAGE MULTI_SMA"
A estrategia é baseada na media criada, para o sinal de compra(BUY) o preço fecha acima da média e a média está subindo. Para o sinal de venda(SELL) o preço fecha abaixo da média e a média caindo.
Para quem se interessar em saber como funciona o script "AVERAGE MULTI_SMA", peço que analise ele lá, pois explico como funciona.
Peço que não use o indicador como único fator para fazer suas operações, tente usar mais como um estudo.
MULTIPLE TIME-FRAME STRATEGY(TREND, MOMENTUM, ENTRY) Hey everyone, this is one strategy that I have found profitable over time. It is a multiple time frame strategy that utilizes 3 time-frames. Highest time-frame is the trend, medium time-frame is the momentum and short time-frame is the entry point.
Long Term:
- If closed candle is above entry then we are looking for longs, otherwise we are looking for shorts
Medium Term:
- If Stoch SmoothK is above or below SmoothK and the momentum matches long term trend then we look for entries.
Short Term:
- If a moving average crossover(long)/crossunder(short) occurs then place a trade in the direction of the trend.
Close Trade:
- Trade is closed when the Medium term SmoothK Crosses under/above SmoothD.
You can mess with the settings to get the best Profit Factor / Percent Profit that matches your plan.
Best of luck!
