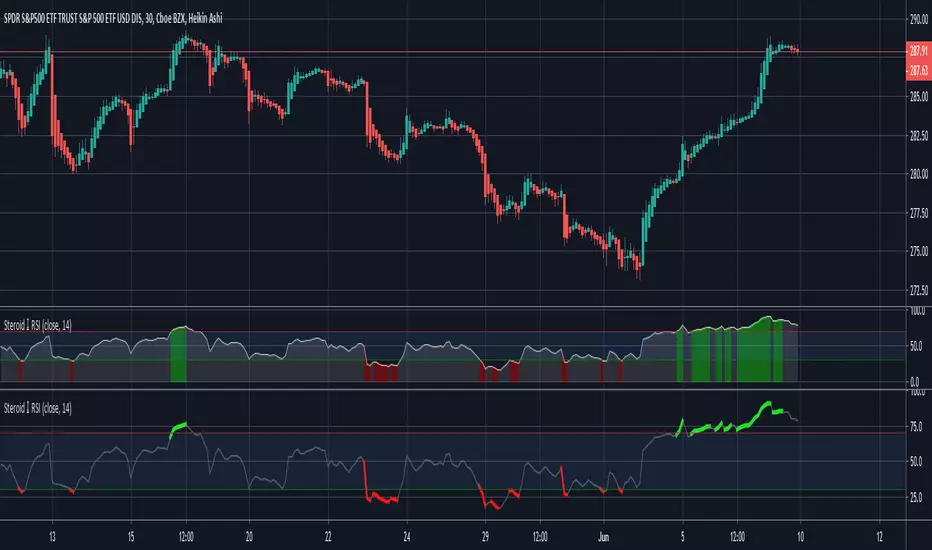
Steroid RSI w/ Overbought & Oversold Alert/@version=2
//By Tantamount
//RSI with overbought and oversold alert features! Highly configurable indicator that includes a Topography map feature, used to detect & easily show threshold crossovers.
//RSI is used to measure the velocity and change of directional price movements. It is very useful to help determine when an asset is reaching an overbought or oversold condition.
//This RSI tool comes loaded with features and is easily configurable back to standard RSI or configure with your own preferences.
Customize to your liking:
Topo map view or standard with highlighted crossover color.
If you like this tool and would like to DONATE/TIP:
Stellar XLM address: GA5XIGA5C7QTPTWXQHY6MCJRMTRZDOSHR6EFIBNDQTCQHG262N4GGKTM
Bitcoin BTC address: 3QwPUnZvAKBXBMU7WMckNgDyfv6PApYduA
Buy

Multi-TF Avg BBandsMULTI-TF AVERAGE BBANDS - with signals (BETA)
Overall, it shows where the price has support and resistance, when it's breaking through, and when its relatively low/high based on the magic of standard deviation.
created by gamazama. send me a shout if u find this useful, or if you create something cool with it.
%BB: The price's position in the boilinger band is converted to a range from 0-1. The midpoint is at 0.5
Description of parameters
"BB:Window Length" is the standard BB size of 20 candles.
The indicator plots up to 7 different %BB's on different timescales
They are calculated independently of the timescale you are viewing eg 12h, 3d, 30m will be the same output
You can enter 7 timescales, eg. if you want to plot a range of bbands of the 12h up to 3d graphs, enter values between 0.5 and 3 (days) - you can also select 0 to disable and use less timescales, or select hours or minutes
Take note if you eg. double the main multiplier to 40, it is the same as doubling all your timescales
You can turn the transparency of the 7 x %BB's to 100 to hide them, their average is plotted as a thick cyan line
"Variance" is a measure of how much the 7 BB's agree, and changes colour based on the thresholds used for the strategy
---- TO START FROM SCRATCH ----
- set all except one to ZERO (0), set to 0, and everything after to 0.
Turn ON and right click -> move the indicator to a new pane - this will show you the internal workings of the indicator.
Then there is a few standard settings
"Source Smoothing Amount" applies a basic small sma on the price.
It should be turned down when viewing candles with less information, like 1D or more.
Standard BBands use an SMA, there one uses a blend between VWMA or SMA
Volume Weight settings, the same as SMA at 0, and the same as VWMA at 1
BB^2 is a bband drawn around the average %BB. Adjust the to change its window length
The BB^2 changes color when price moves up or down
Now its time to look at the parameters which affect the buy/sell signals
turn on "show signal range" - you see some red lines
buy and sell each have 4 settings
min/max variance will affect the brigtness of the signal range
range adjust will move the range up/down
mix BB^2 blends between a straight line (0) and BB^2's top or bottom (1)
a threshold of "variance" and "h/l points" is available to generate weaker signals.
these thresholds can be increased to show more weak signals
ONCE YOU ARE HAPPY WITH THE SIGNALS being generated, you can turn OFF , and move it back to the price pane
the indicator then draws a bband around the price to maps some info into the chart:
fills a colour between 0.5 & the mid BB^2 and converts relative to the price chart
draws a line in the middle of the midband.
controls how much these lines diverge from the price - adjust it to reduce noise
converts the signal range (red lines) to be relative to the price chart
if you like, you can adjust the sell & buy signals in the tab from and to and to match the picture. It messes with auto-scaling when moving back to though
enjoy, I hope that is easy enough to understand, still trying to make this more user-friendly.
If you want to send me some token of appreciation - btc: 33c2oiCW8Fnsy41Y8z2jAPzY8trnqr5cFu
I promise it will put a fat smile on my face

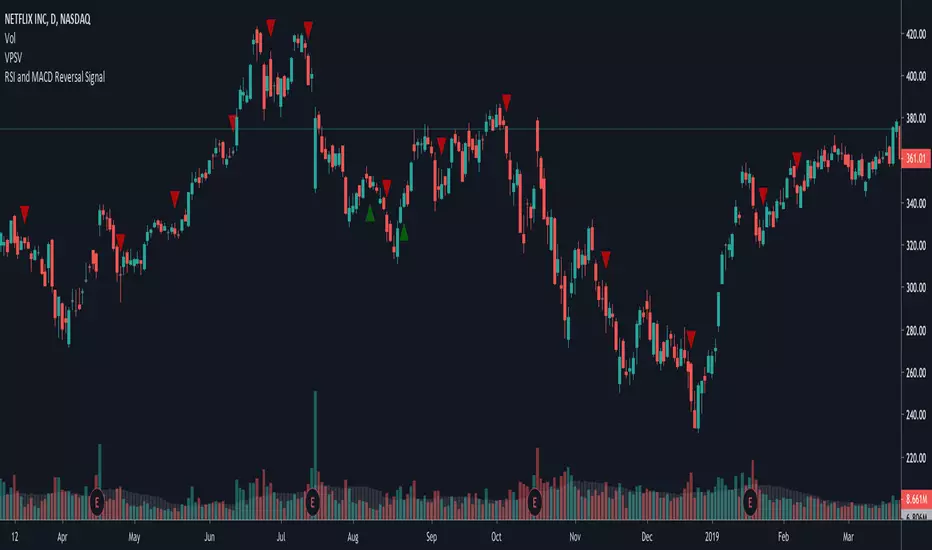
~RMCF~ RSI and MACD Reversal SignalFor AkibaDeep. Checks if RSI < 30 recently and if MACD diverges, placing a buy signal. Then, places a sell signal when MACD converges back.
Ichimoku Cloud signalswith this indicator you will get buy and sell signals with 7 different strategies by Ichimoku clouds

BuySell Trend‴ BuySell Trend‴ is a Moving Average oscillator that allows you to have a better understanding and interpretation trend as it goes and then reverses with or without pressure.
If the black line crosses up the red line it will indicate possible up trend. But if both lines cross up the blue line, than you have a strong up trend going on.
What is the best is that you can use it with any kind of graphic that it will always considere the real open, close, high and low trading values.
To have access to this indicator, please contact me at: contato @ moneywise . com . br
Believe me, this indicator will make your life much easier!


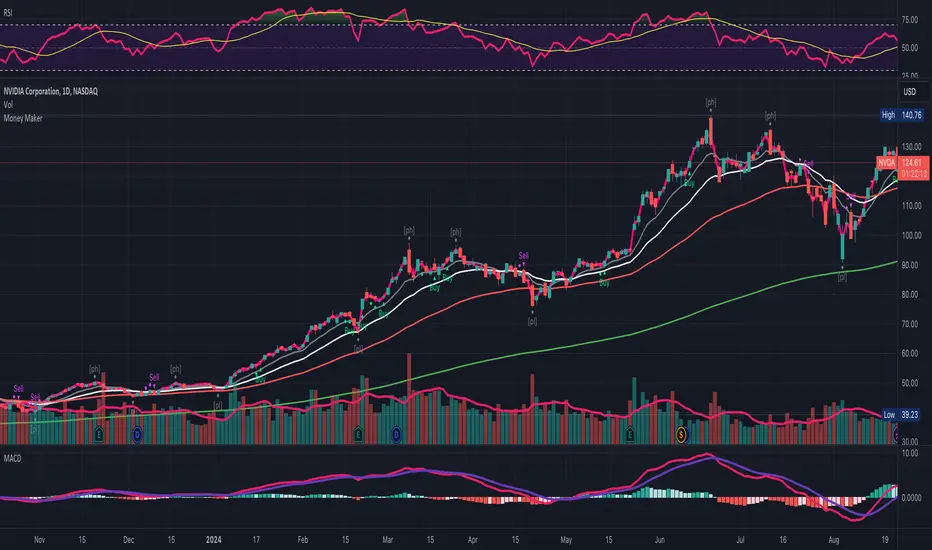
Money Maker [Buy/Sell Signals] | Easy To UseThis script will give you simple buy and sell signals based on price, moving averages and volume.
The diamonds shaped signals are for you to watch for a breakout. Green to upside and pink to the downside.
If the breakout occurs, then you will see either a Buy signal or a Sell signal.
Examples:
Enjoy!
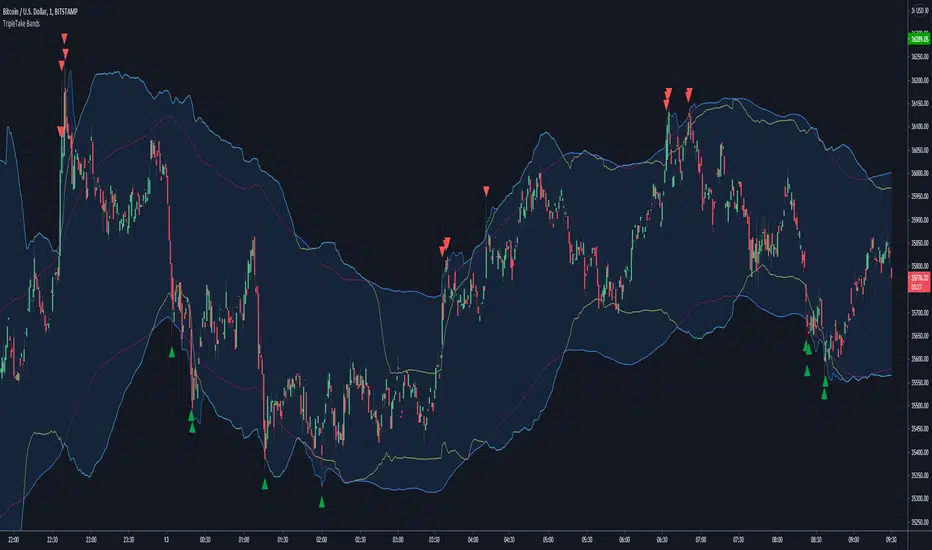
TripleTake BandsOur Most Requested Release (So you can all stop spamming me with PM's asking when it is going to be ready :D )
The original TripleTake indicator has been getting high praise from members of CryptoProTools.com but there was just one problem.. It only provided the buy signals.
This updated version comes with both the buy/long and sell/short signals. Margin traders rejoice!
-------------------------------------------------------------------
May the profits be with you! <(-.-)>
Auto TrendlinesAuto Trendlines
-This indicador show automatically trendlines
- Allows you to select the amount and importance of the trendlines.
-Works in any timeframe or market like Forex, Crypto, Commodities even Stocks.
-Recommended manual trading.
Do you need an Script or an expert adviser for Forex, contact our coding service!
Get this indicator today! contact us.

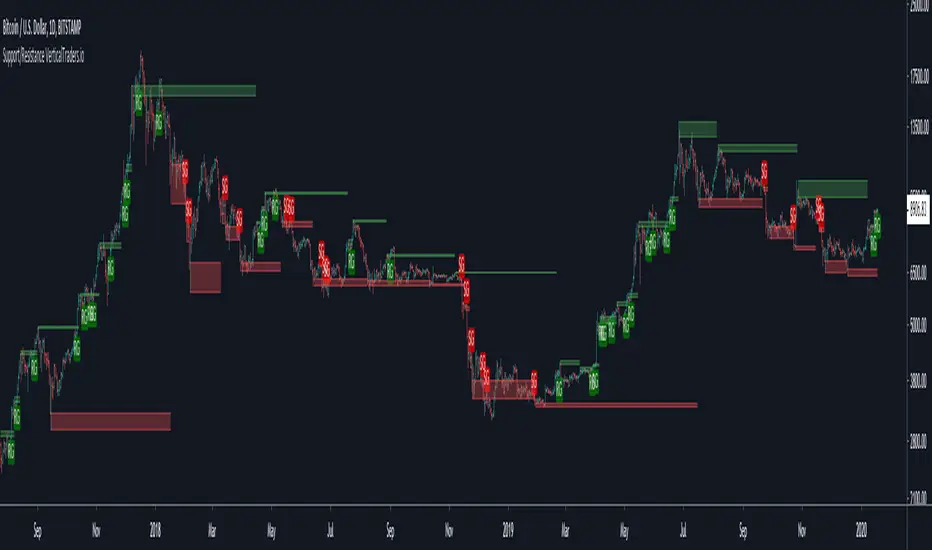
Support and Resistance LevelsSupport and Resistance Levels
-This indicador show automatically the support and resistance levels.
- Allows you to select the amount and importance of the S/R levels.
-This indicator allows to overlay a custom timefame S/R levels.
-You can activate notification alerts for any of the conditions.
-Works in any timeframe or market like Forex, Crypto, Commodities even Stocks.
-Recommended manual trading.
Do you need an Script or an expert adviser for Forex, contact our coding service!
Get this indicator today! contact us.
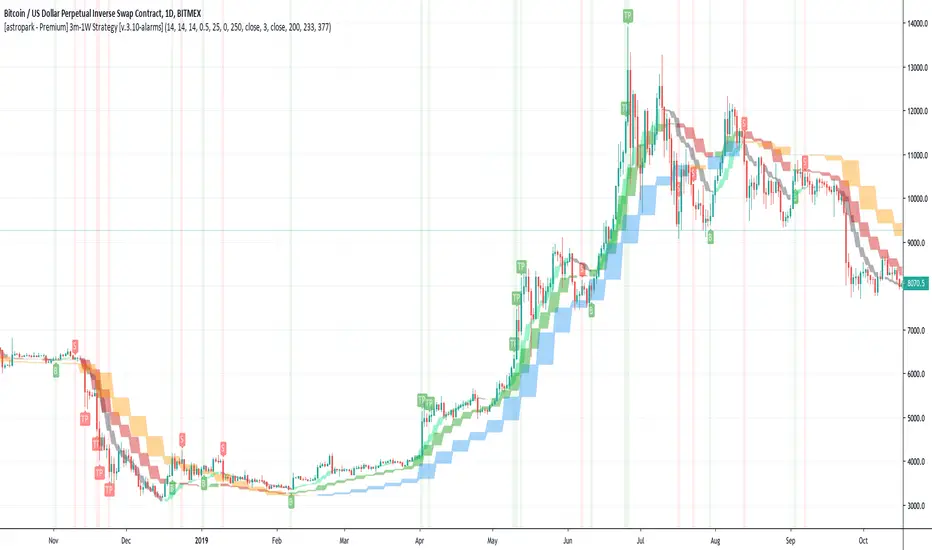
[astropark - Premium] 3m-5m-15m-30m Renko ScalperHi Followers!
Is it possibile to multiply your capital by 30 times in one year?
YES, it is! Just use this script on Renko charts!
This script is the study version of this strategy:
Why is this version necessary? With this script you can set alarms and get notified when a new signal appears on the Renko chart ! With strategy you can't!
This strategy works great at following timeframes:
30 minutes
15 minutes
5 minutes
3 minutes
Keep in mind that this is not the Holy Grail and price manipulation can create great volatility!
So always set a stop loss in trades, like -3%/-5% from entry point, depending on your risk management style.
This is a premium indicator , so send me a private message in order to get access to this script.
Do you like my scripts? Offer me a coffee, a beer, a pizza or whatever :)
BTC jar: 1K5kuYQPEqoNo6GRmJbHWMPmqwKM5S3oRR
ETH jar: 0x091b541a6dd6fe08c4e7bd909baafb2fce9b975e
LTC jar: LSVoAChsZrVsvbNyUfdpxtFpDAUSaUTUig
XRP jar: (XRP deposit tag) 103997763 (XRP deposit address) rEb8TK3gBgk5auZkwc6sHnwrGVJH8DuaLh
PS: Do you need a customization or do you need a dev who implements your strategy? send me a private message ;-)

Sell / Buy RatesThis script finds sell / buy rates and adds its linear regression to the chart. its aim is finding buying and selling power, then you can try to find trend reversals. Also you can find divergences, it's very important signal for trend reversal.
Linear regression is a basic and commonly used type of predictive analysis.
if you choose lower periods then it will be more sensitive. I choose 34 as it's one of fibonnaci number.
If you find my works useful, please consider a donation
BTC: 16XRqyS3Vgh1knAU1tCcruqhUrVm4QWWmR

Trader Set - Trading Signal IndicatorThe indicator version of my trading signal strategy, again DON'T EVEN ASK FOR GETTING ACCESS. This is pine version 3, no repainting and enhanced with personally trained neural network (not the one you find around in trading view, that neural network has serious issues and no, i'm not talking about repainting. the neural's network itself is not standard and full of issues).
Why did I make an indicator version? to better understand what is going on when tweaking the numbers and different inputs of my strategy system.
Also, that strategy, uses price action, side by side a personally trained neural network (dedicated for btc usd) and beside all of them, i used one of my original tools that i published during last few months for getting iron grasp on the best signals.
The result?
Leverage 10 on Bitmex, one week of trading, 100+ GAIN !!!!!!
This is a money making machine that i won't share on trading view, I have other plans for this and you will be informed when the time comes.
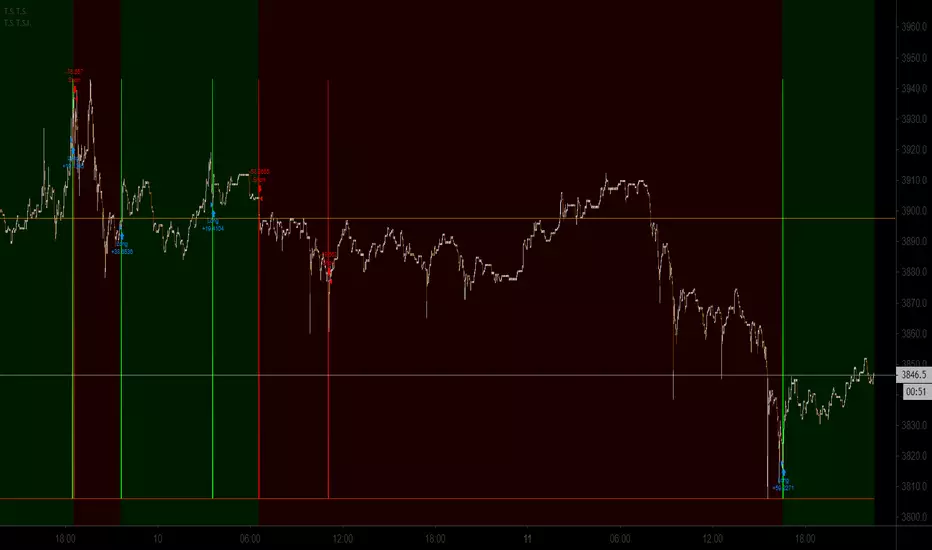
[astropark - Premium] Long-Short Strategy V3This indicator works nicely between 5m and 1W timeframes :))) and you can set any alerts you like on both buy, sell and take profit signals!
Buy/Long at next candle's open price when you see a green "B" label on the screen, considering green cloud as support for more buys/longs (the bigger the cloud, the stronger the support).
Sell/short at next candle's open price when you see a red "S" label on the screen, considering red cloud as resistance for more shorts (the bigger the cloud, the stronger the resistance).
This indicator suggests some TP (Take Profit) for both longs (in blue color) and shorts (in purple color): you can start (at least partially!) closing the current trade
This is a premium indicator, so send me a private message in order to get access to this script.
Do you like my scripts? Offer me a coffee , a beer, a pizza or whatever :)
BTC jar: 1K5kuYQPEqoNo6GRmJbHWMPmqwKM5S3oRR
ETH jar: 0x091b541a6dd6fe08c4e7bd909baafb2fce9b975e
LTC jar: LSVoAChsZrVsvbNyUfdpxtFpDAUSaUTUig
XRP jar: (XRP deposit tag) 103997763 (XRP deposit address) rEb8TK3gBgk5auZkwc6sHnwrGVJH8DuaLh
PS: Do you need a customization or do you need a dev who implements your strategy? send me a private message ;-)
Power Fractals Open Source I decided to make my power fractals indicator open source.
(/script/el8MaHcq-Power-Fractals/)
Feel free to use/change/improve.

Icarus - by @cryptomrdavis -this indicator plots green and red triangles under or above a bar to show you, when you should buy or sell.
if you use it with the crypto trading helper you can find better entry or exit points.
try it out and let me know what you think. there is no repaint , plots only on candle close.
will improve this script with single buy & sell signals and add some alerts. don't know why its not working on this script with just one entry position..

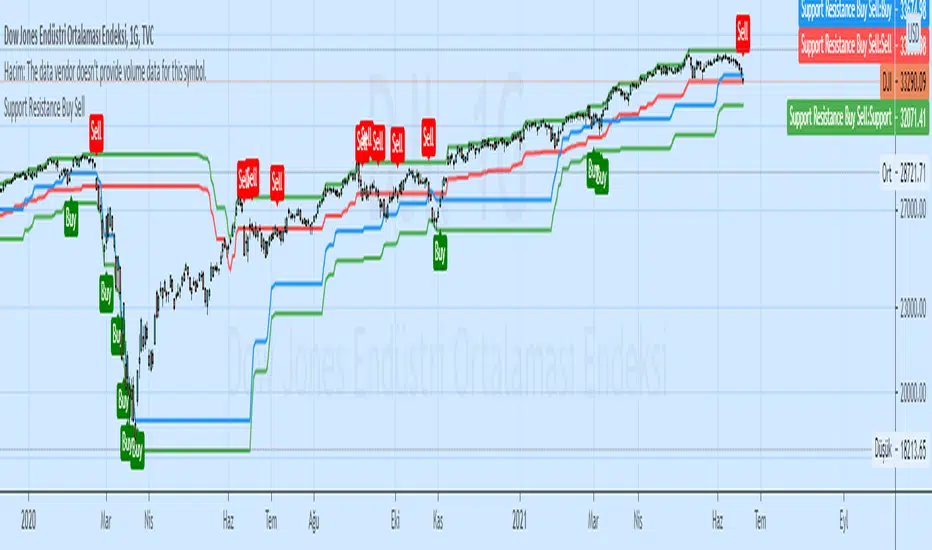
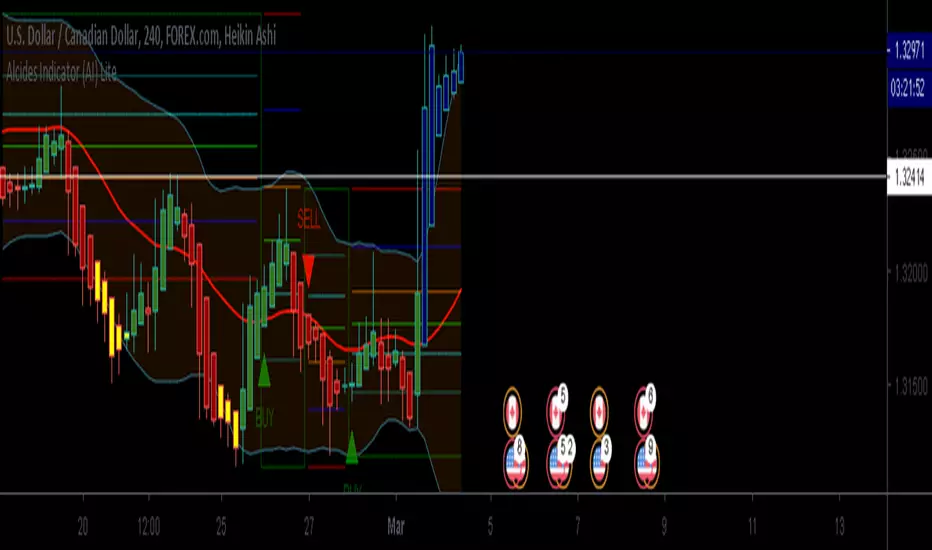
Alcides Indicator(AI) LiteAlcides Indicator (AI) Lite is a simple to use indicator that can be used with any type of asset, trading in any market including FOREX, Stocks, Commodities, Cryptocurrencies etc. The Lite version uses levels from either 1 hr or 4 hr time frame based on user input to indicate entry (BUY) into or exit (SELL) from an asset. The indicator also plots support for BUYs and Resistance for SELLs which can be used as a reference while setting your Stop Loss. BUY, SELL and TAKE GAINS alerts can be set on trading view to help monitor the asset as well.
Even though the indicator signals BUYs and SELLs based on chosen Time Frame levels, the user must always use their discretion based on their TA and FA. Also, indicator repainting can occur based on time of signal/chart used (ex. 5m chart on 1 hr timeframe levels can repaint a BUY/SELL after 1 hr closes).
Works best with Heikin Ashi candles and lower timeframes like 5m, 15m, 30m.
The full version has more time frame levels to choose from, a few extra useful features and also recommends sell and buy levels based on the chosen time from.
Contact me for access and more information.
Steroid CCI w/ Overbought & Oversold Alert//@version=2
//By Tantamount
//Channel Commodity Index (CCI) with overbought and oversold alert features! Highly configurable indicator that includes a Topography map feature, used to detect & show minute threshold crosses.
//CCI is a momentum based technical trading tool used to help determine when an asset is reaching an overbought or oversold condition and is an great alternative to RSI.
//This CCI tool comes loaded with features and is easily configurable back to standard CCI or with your own preferences.
Customize to your liking:
Simple alert signals
The full enchilada, with Topo map view!
Stand alone CCI oscillator

[AN] AC ScalperScalp indicator.
Uses trend to switches to find the direction and entries. Has a built in exit system.
Also uses a trailing stop system in order to maximize gains.
Alerts can be added so trades can be automated.
Strategy that tests it:

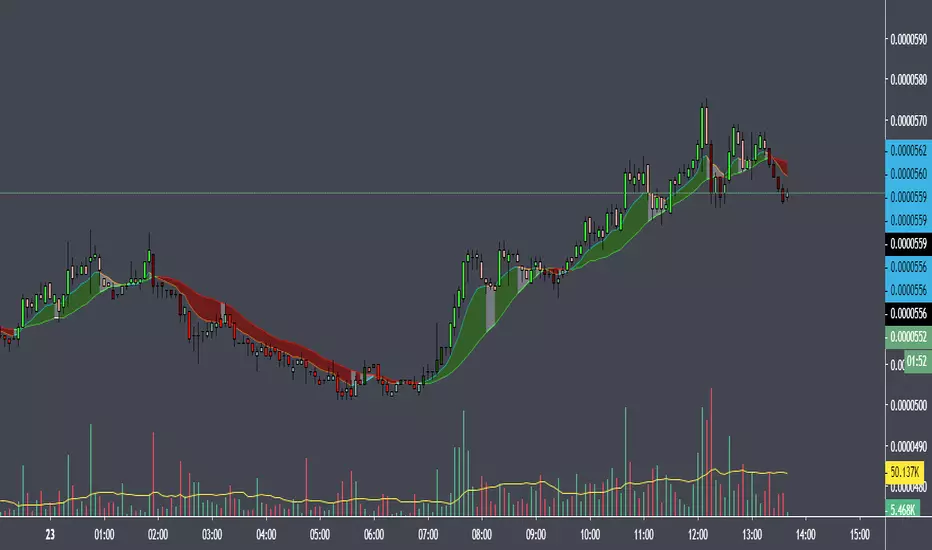
Directional filterThe idea is to show simply through colors "stronger or weaker" the relevance of candles in the current direction of the asset.
the indicator was made to be used in the graphics of 5m and 15m. based on the SMA20 already indicated previously and with a SMA20 of the graph of 60m.
candles will have their colors modified according to their relevance in the current trend, "A" through "D", where "A" is the strongest and "D" is the weakest.
Conditions:
Buy candle A: price closes above SMA20 (5m or 15m) and above SM20 of 60m.
Buy candle B: price closes above the SMA20 (5m or 15m) and below the SMA20 of 60m.
Buy candle C: Price closes below the SMA20 (5m or 15m) and above the SMA20 60m.
Buy candle D: price closes below the SMA20 (5m or 15m) and below the SMA20 of 60m.
Sell candle A: price closes below the SMA20 (5m or 15m) and below the SMA20 of 60m.
Sell candle B: price closes below the SMA20 (5m or 15m) and above the SMA20 of 60m.
Sell candle C: price closes above the SMA20 (5m or 15m) and below the SMA20 of 60m.
Sell candle D: price closes above the SMA20 (5m or 15m) and above the SMA20 of 60m.
Note 1: SMA8 and SMA200 are also inserted (but they do not interfere with the indicator)
Note 2:
I will leave an image with the colors that represent the relevance of each candle.
imageshack.com