Ma PullbackThis indicator is based on ema band....
condition for buy =>
1) price should crossover ema band
2) price pullback on ema band but price should not close below lower band
3)after pullback green candle should close above ema band
4)check candle size when its crossing ema band
5)check previous canlde 7 should not touching cloud so (we can reduce range signal)
condition for sell =>
1) price should crossunder ema band
2) price pullback on ema band but price should not close above upper band
3)after pullback red candle should crossunder ema band
4)check candle size when its crossing ema band
5)check previous canlde 7 should not touching cloud so (we can reduce range signal)
this indicator also for education purpuse how we can make pullback condition....
Buy

Orb breakout Buy condition =>ORB range 9:20-9:25. On 5 min TF if candle breaks high and next candle break high of that candle. buy signal when third candle breaks high of 2nd candle
Sell condition=>ORB range 9:20-9:25. On 5 min TF if candle breaks low and next candle break low of that candle. sell signal when third candle breaks low of 2nd candle
this indicator is extended version of my previous indicator i got a comment request from @RISHISAKHARE to devlope indicator based on above mention rule ....

HMA Breakout Buy/Sell indicator for Scalping & Intraday - ShyamHi All,
This is a very simple indicator which provides the buy signal, when the moving average lines turns Green and sell signal, when the moving average signal turns red. This can be used for both intraday and scalping method with different timeframes. But best time frame is 5 minutes.
Buy Signal >>> Line turns GREEN (Use trailing SL to cover maximum profit)
Sell Signal >>> Line turns RED (Use trailing SL to cover maximum profit)
No trade >>> Line turns GRAY
Best timeframe >>> 5 minutes
Thanks,
Shyam

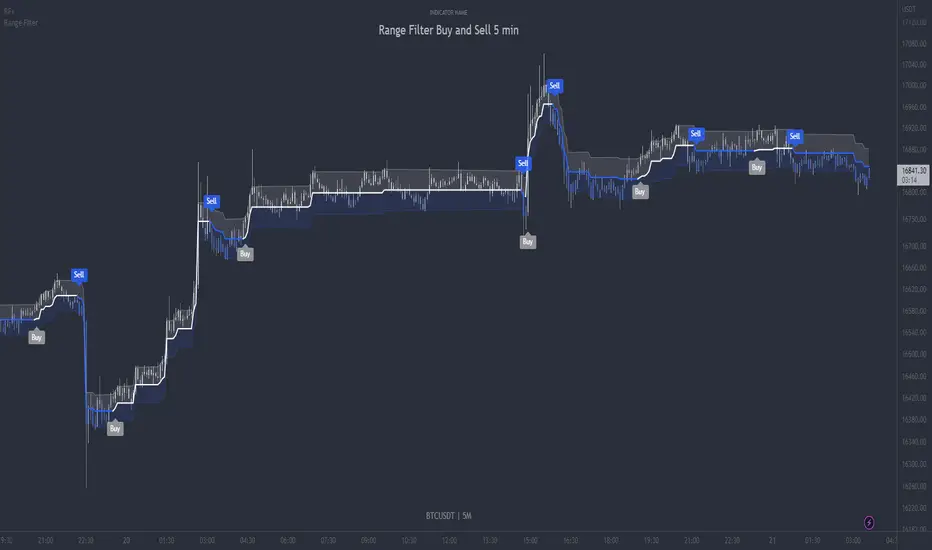
Range Filter Buy and Sell 5min - guikroth versionRange Filter Buy and Sell 5min - the @guikroth version, republished.
Since this popular version of the Range Filter is no longer available via the original author, I republish it here under the same name.
This version remains true to the guikroth version from the calculations to the default settings and comments in the code, with the exception of an update to the latest version of PineScript, minor styling adjustments and the addition of an all-in-one 'buy or sell' alert option.
The guikroth version was a simplified modification of the original Range Filter by @DonovanWall .
Including having just 3 bar colours based on the filtered price trend, different source input options to the original, and the addition of buy and sell signals and alerts based upon the Range Filter colour change. It consisted of just three inputs; source, sampling period, and range multipler. With the update to version 5, external indicators can also be used as inputs, for example using a VWAP or EMA loaded on your chart as the input on the Range Filter is now also possible.
What is the Range Filter?
As the author of the original Range Filter describes it:
"This is an experimental study designed to filter out minor price action for a clearer view of trends. Inspired by the QQE's volatility filter, this filter applies the process directly to price rather than to a smoothed RSI .
First, a smooth average price range is calculated for the basis of the filter and multiplied by a specified amount.
Next, the filter is calculated by gating price movements that do not exceed the specified range.
Lastly the target ranges are plotted to display the prices that will trigger filter movement.
Custom bar colors are included. The color scheme is based on the filtered price trend."
Popularity of the Range Filter
The Range Filter is a very popular and effective indicator in its own right, with adjustments to the few simple settings it is possible to use the Range Filter for helping filter price movement, whether helping to determine trend direction or ranges, to timing breakout or even reversal entries. Its practical versatility makes it ideal for integrating it's signals into a variety of trading strategies or even other indicators.
With many thanks to the authors of the previous and original versions; @guikroth and @DonovanWall .
Most Power V5 Most Power V5
The MOST indicator is an indicator used as a Moving Stoploss. The MOST indicator also generates a buy signal in case the prices rise, unlike the traditional indicators that allow you to make stop losses.In the MOST POWER V5 indicator, stoploss generates its signals using moving averages such as 'SMA', 'EMA', 'WMA', 'VWMA', 'HMA', 'SMMA', 'DEMA' rather than just the current price. In this way, it aims to prevent false signals that may be produced by excessive price movements during the day.
MOST POWER Indicator follows the average by preserving the stop loss distance in the movement of the moving average in the same direction.
The second variable that creates the MOST POWER curve is the stop loss distance that gives power to MOST with the moving average used and the shift rate that provides the stop signal. In this version, this distance is prepared with 2 separate inputs for both buy and sell.You can set these values as "percentage for long trend" and "percentage for short trend" in the indicator input properties.
You can also enter your Take Profit-1, Take Profit-2-, Take Profit-3- and Stop Loss levels in the indicator input properties, especially if you are interested in algo trading or to take advantage of the wonderful alarm setup features of tradingview and get the chance to get maximum profit. (If you enter Take Profit-1, Take Profit-2-, Take Profit-3- and Stop Loss levels as 0. Only buy and sell labels will appear on the indicator.)
Also, activate the amplitude filter option from the indicator input settings to get less signal and filter our inputs.
In addition, the entry price, take profit1, take profit2, take profit3 values for the last transaction opened to make things easier are located in the upper right corner of your graph as a table.
Important note: No indicator guarantees investment. That's why the tests you will do before real trades are very important in this indicator. I wish you all successful trades.
i will show how works with examples
Example 1
If you enter Take Profit-1, Take Profit-2-, Take Profit-3- and Stop Loss levels greater than 0
Example 2
If you enter Take Profit-1, Take Profit-2-, Take Profit-3- and Stop Loss levels as 0 (u will see only buy - sell labels)
Example 3
if select Amplitude Filter is on . you will see less signal
how works Amplitude Filter whats logic ?
if Amplitude Filter is active the signal from mostpower will be combined with Amplitude Filter.
for example, if the amplitude value is 2, the highest price and the lowest price of the last 2 bars are calculated. then this amplitude value is calculated for sma with its source high and low. Based on these values, the trend is determined in the amplitude of the price movement.
Important note: No indicator guarantees investment. That's why the tests you will do before real trades are very important in this indicator. I wish you all successful trades.

Buy and Sell Indicator This indicaor is draw time(ex 09:15 nifty 50) high and low of candle ..
for buy condition -
1) when price is crossing time candle high open a long trade
2) check for condition is this trade open less thn previous trade
if both condition are true thn open a buy trade
for sell condition -
1) when price is crossing time candle low open a short trade
2) check for condition is this trade open grater thn previous trade
if both condition are true thn open a sell trade
to build logic of 2nd condition @fikira help me thnx mate ...

Band of Filtered RS by Mustafa ÖZVERBand of Filtered RS by Mustafa ÖZVER
This code shows a range (max-min values) price may get if we get strong movements. These values is based on RSI (Relative Strange Index). And also these are calculated using RSI, if we get trades to make rsi is equal to 25 (or rsi down limit) or 75 (rsi up limit) or any value you set, how much will price value get? This code calculate these and shows these to you on graph.
This price are between these band limits because we expect cross reaction to hard movements on price.
For scalping, we can use these values as
long signal when price under down limit,
short signal when price over up limit,
But only these values can not guarantee good results for trading. BE CAREFUL

POWER OF STOCK'S 5 EMA BUY / SELL Indicator is based mainly on two conditions :
1. Previous candle should not touch 5 EMA.
2. Current candle should close “ABOVE/BELOW” 5 EMA.
Features -
* Buy candle is represented by Aqua Color
* Sell candle is represented by Fuchsia Color
* You can set Risk: Reward ratio. ( Default = 1:2)
* It also shows label for Entry, Stop Loss & Target.
* Suggested timeframe 15 Minutes for intraday.
* Use closing basis Stop loss.
Moving Grid Trader - With AlertsThis script used a grid system that is set when a "buy" signal is sent to generate profits inside of a range. This script used macd to weed out bad buys and then sells once the price either reaches the grid - or hits the stoploss. This works best in bullish and ranging markets.

DoubleRSI fast/slow signal buy/sell with alert Relative StrengthA combination of two Relative strength index. One fast and one slow line. In a system, this indicator can serve as an additional confirmation.
For example, for a long entry:
slow RSI cross above 50 level and fast RSI cross above 70 level. then check volume and use another indicator such as a MACD for extra confirmation
For example, for a short entry:
slow RSI cross below 50 and fast RSI cross below 30 level. then check volume and use another indicator such as a MACD for confirmation
An alarm function has also been added.
the following settings are possible:
- Source
- Length
- Color
I do not recommend to use this indicator alone.
have fun using this simple and helpful tool.

sohail Anjum EMA buy sellBased on Sohail anjum
Ema crossing teaching
Crossover alerts, only in trend 200 Ema (yellow line) make sure If the price is above the 200 EMA, you can prefer a long position and ignore short positions.
If the price is below the 200 EMA, you are allowed to open only short positions and avoid long positions.
Do not use this indicator alone, Use other recommended indicators by ShohailAnjum Rsi, Macd , chart pattren, etc
This indicator good win rate in 15m TF recommended 1H, 4H
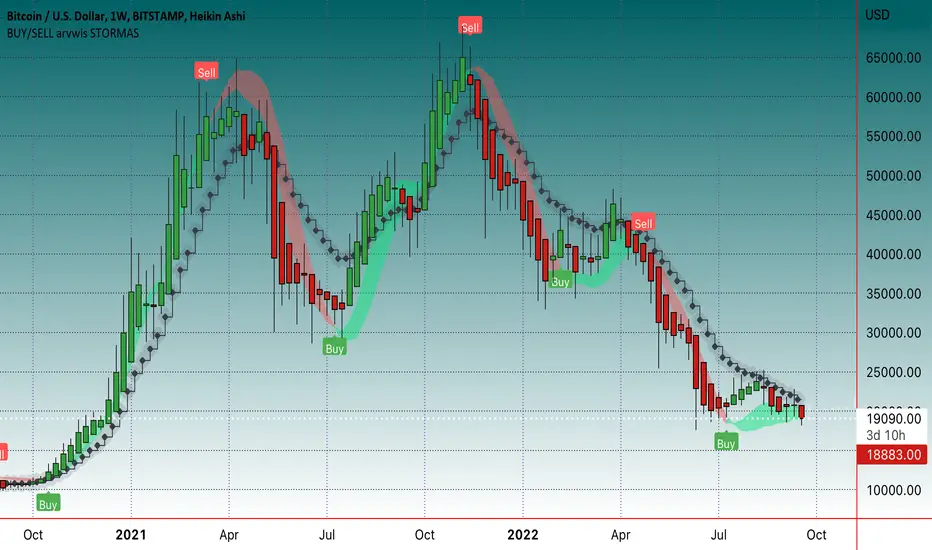
BUY/SELL arvwis STORMASBuy/sell indikatorius, geriausia naudoti ant didesnių timefreimų, bet tinka ir ant mažesnių
Better DiNapoli Stoch oscillator with buy/sell signals and alertThis version of Joe DiNapoli stochastic oscillator uses only one line for a better overview. Signals are displayed as soon as the line exceeds or falls below the center line. Also the candle color changes with this signal.
Alarms can also be set for these signals.
As long as the current candle is not closed, the line is displayed in yellow.
The following settings can be made:
- Lockback periode for highest high and lowest low
- Smoothing
- Candle Color
- Stochastic line color
This indicator works well with indicators such as EMA or others.
Have fun using it.

Line Chart with circles on sub chart / LineChart no CandlesLine Chart with circles as a subchart. The circle will appear only after the candle has been confirmed.
Things you can change:
- Source: open, high, low, close, hl2, hlc3, ohlc4, hlcc4
- Color: change the color of the line and the circles
have fun with it!

Volume Buy/Sell (by iammaximov)Buy/Sell Volume
Buy/Sell volume based on total bar amplitude (high/low price) and close/open (for calculate vbuy > vsell or vbuy < vsell)

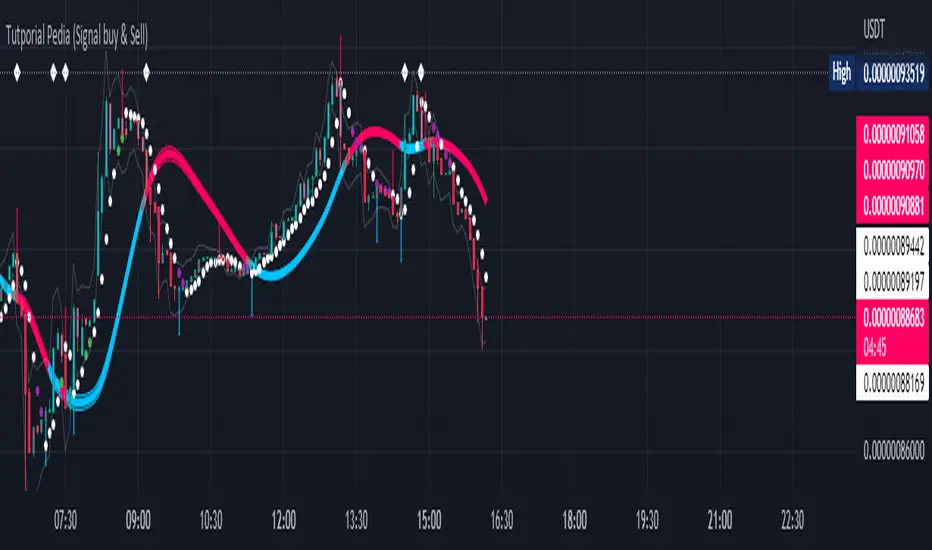
Tutporial Pedia (Signal buy & Sell)Untuk mempermudah kita dalam bermain dan memahami Signal Trade View Rate 98 %
BBSS - Bollinger Bands Scalping SignalsModified Bollinger Bands Indicator
Added:
- color change divergence (green) and narrowing (red) of the upper and lower bands
- color change of the moving average - upward trend (green) and downward trend (red)
- the appearance of a potential signal for long and short positions when the candle closes behind the upper or lower bands.
How to use the indicator:
Long conditions:
- the price breaks through the upper band
- Bollinger bands are expanding and should be green
- the mid-line is green
- the trigger candle should be green
Short conditions:
- the price breaks through the lower band
- Bollinger bands are expanding and should be red
- the mid-line is red
- the trigger candle should be red

Simple Buy and Sell SignalsThis is a Simple Indicator which shows buy and sell signals based on MACD and SSL channel.
It is not a Holy Grail Indicator. It shows a lot of false signals when the market is Consolidation Zone.
So don't use this indicator to place trades based on signals given by the indicator.
Use this as a confluence along with your technical analysis
On lower timeframes there are a lot of signals so to eliminate false signals , get a signal on higher timeframe and place a trade in the direction of the trend on lower timeframe.
Hope you'll find this helpful. Enjoy👍.
Crodl Pump & DumpThe reason why this indicator is called Pump and Dump is because it is based on volume.
The indicator focuses on volume levels to see if there is an increase in volume before deciding if it is worth entering a Position.
Long example = This will use ATR and price averages to trend Bullish and once the trend favours the upside it will then look at the Volume candles and if a candle is bigger then the average volume and the trend (ATR) is above a certain level it will then Give us a long entry if those conditions are true. We can have more than one long after one another since it will give us a position every-time the conditions are true and after TP(take profit) 1 or a Stop Loss was hit.
Short example = If the trend based on average price is trending downwards and we can see an increase of volume it will wait till we break a certain level breaks when we get the average price from the highs and Lows, then once the trend has met the bearish conditions it will wait for increase in volume and trigger a Sell. The sell will close once TP(take profit) 1 or a Stop Loss is hit.
In the inputs you can adjust the MA (moving average length. This helps to decide if the Trend is bearish or bullish. Higher moving averages will give you less entries and a lower moving average will give you more entries ,since price crosses lower MA's more it will change the trend more often.
Sensitivity is a divider of the MA values is so the higher the Sensitivity the lower the more trades you get since the trend is changing faster.
You will see that there is a backtesting panel on your chart when you look in the inputs there will be a statistics tab which will have 1. Simple 2. Mobile 3. Hide options
1. Simple is designed when you are using a PC or Laptop
2.Can be used when you are using your mobile it will show less data but won't be in your way
3.This will hide the backtesting panel on your screen.
Exit strategy.
there are 3 Types of exits for this indicator.
1 .CrodlExit which is ATR indicator based Exit with a divider.
2 . fIxed SL , this works in % so 1 = 1% market move.
3 .Reverse exits = Longs exit shorts and shorts exit longs.
there are 4 take profit targets and all of them are adjustable.
1= 0.5% by default
2=1% by default
3=1.5% by default
4=2% by default
on the Back tester you will find the following information :
Timeframe of your chart and then the Symbol or pair you are trading.
First trade = when the back tester starts to read data.
Total trade = Total buy and total sell signals and then total trades are buy + sell signals.
total win = total buys hit take profit 1 and total sells that hit take profit 1 and then total buy + total sells that hit take profit 1.
total loss = total buys that hit which ever exit mode you selected in the inputs by default it is crodl exit and total sells that hit which ever exit mode you selected in the inputs by default it is crodl exit and then you will get total buy losses + total sell losses to get total loss.
TP1= the % difference between total trades won and lost for the 1st take profit target and your stop loss method you chose.
TP2= the % difference between total trades won and lost for the 2nd take profit target and your stop loss method you chose.
TP3= the % difference between total trades won and lost for the 3rd take profit target and your stop loss method you chose.
TP4= the % difference between total trades won and lost for the 4th take profit target and your stop loss method you chose.
average win streak give you the average of how many winning trades you had every time before hitting a stop loss.
average loss streak is how many stop loss you hit on average before take profit one has been reached.
longest win streak give you the amount of winning trades you had without hitting a stop lossl that is selected in your inputs.
longest loss streak give you the amount of losing trades you had one after the other before hitting take profit 1.

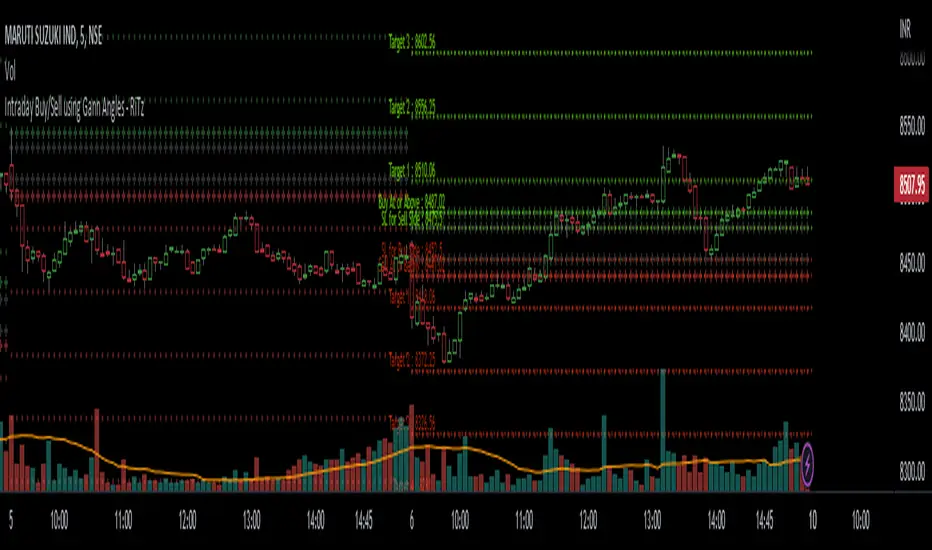
Intraday Buy/Sell using Gann Angles - RiTzIntraday Buy/Sell Levels using Gann Angles based on Todays Open/previous Day High/Low/Close prices
How to use this :
The Buy/Sell levels will be calculated on 1 of 4 things (you can choose any one which you prefer)
1. Todays Open price
2. Previous Day High
3. Previous Day Low
4. Previous Day Close
The Buy/Sell levels will be displayed in these ways
1. In a Table
2. on the Chart
You can turn them on/off according to your preference!
I can't seem to find the original documentation or a link to it.
i have it's excel file, in which we have to enter following data :
1. Todays Open price
2. Previous Day High
3. Previous Day Low
4. Previous Day Close
and the buy/sell levels are calculated by using the above data in following manner :
Based On Today's Opening Price
(lets call it TDO)
Degree's````````````````` Degree Factor```````````````````````` Buy````````````````````````` Sell
11.25```````````````````` =degree/180=11.25/180=0.0625````````` =(sqrt(TDO)-0.0625)^2``````` =(sqrt(TDO)+0.0625)^2````` SL
22.5````````````````````` =degree/180=22.5/180=0.125``````````` =(sqrt(TDO)+0.125)^2```````` =(sqrt(TDO)-0.125)^2`````` Buy/Sell At
45``````````````````````` =degree/180=45/180=0.25`````````````` =(sqrt(TDO)+0.25)^2````````` =(sqrt(TDO)-0.25)^2``````` Target-1
90``````````````````````` =degree/180=90/180=0.5``````````````` =(sqrt(TDO)+0.5)^2`````````` =(sqrt(TDO)-0.5)^2```````` Target-2
135`````````````````````` =degree/180=135/180=0.75````````````` =(sqrt(TDO)+0.75)^2````````` =(sqrt(TDO)-0.75)^2``````` Target-3
180`````````````````````` =degree/180=180/180=1```````````````` =(sqrt(TDO)+1)^2```````````` =(sqrt(TDO)-1)^2`````````` Target-4
225`````````````````````` =degree/180=225/180=1.25````````````` =(sqrt(TDO)+1.25)^2````````` =(sqrt(TDO)-1.25)^2``````` Target-5
270`````````````````````` =degree/180=270/180=1.5`````````````` =(sqrt(TDO)+1.5)^2`````````` =(sqrt(TDO)-1.5)^2```````` Target-6
315`````````````````````` =degree/180=315/180=1.75````````````` =(sqrt(TDO)+1.75)^2````````` =(sqrt(TDO)-1.75)^2``````` Target-7
360`````````````````````` =degree/180=360/180=2```````````````` =(sqrt(TDO)+2)^2```````````` =(sqrt(TDO)-2)^2`````````` Target-8
sqrt = square root
TDO = Today's Opening Price
PDH = Previous Days High
PDL = Previous Days Low
PDC = Previous Days Close
Based On Previous Days High Price
(lets call it PDH)
Degree's````````````````` Degree Factor```````````````````````` Buy````````````````````````` Sell
11.25```````````````````` =degree/180=11.25/180=0.0625````````` =(sqrt(PDH)-0.0625)^2``````` =(sqrt(PDH)+0.0625)^2````` SL
22.5````````````````````` =degree/180=22.5/180=0.125``````````` =(sqrt(PDH)+0.125)^2```````` =(sqrt(PDH)-0.125)^2`````` Buy/Sell At
45``````````````````````` =degree/180=45/180=0.25`````````````` =(sqrt(PDH)+0.25)^2````````` =(sqrt(PDH)-0.25)^2``````` Target-1
90``````````````````````` =degree/180=90/180=0.5``````````````` =(sqrt(PDH)+0.5)^2`````````` =(sqrt(PDH)-0.5)^2```````` Target-2
135`````````````````````` =degree/180=135/180=0.75````````````` =(sqrt(PDH)+0.75)^2````````` =(sqrt(PDH)-0.75)^2``````` Target-3
180`````````````````````` =degree/180=180/180=1```````````````` =(sqrt(PDH)+1)^2```````````` =(sqrt(PDH)-1)^2`````````` Target-4
225`````````````````````` =degree/180=225/180=1.25````````````` =(sqrt(PDH)+1.25)^2````````` =(sqrt(PDH)-1.25)^2``````` Target-5
270`````````````````````` =degree/180=270/180=1.5`````````````` =(sqrt(PDH)+1.5)^2`````````` =(sqrt(PDH)-1.5)^2```````` Target-6
315`````````````````````` =degree/180=315/180=1.75````````````` =(sqrt(PDH)+1.75)^2````````` =(sqrt(PDH)-1.75)^2``````` Target-7
360`````````````````````` =degree/180=360/180=2```````````````` =(sqrt(PDH)+2)^2```````````` =(sqrt(PDH)-2)^2`````````` Target-8
Based On Previous Days Low Price
(lets call it PDL)
Degree's````````````````` Degree Factor```````````````````````` Buy````````````````````````` Sell
11.25```````````````````` =degree/180=11.25/180=0.0625````````` =(sqrt(PDL)-0.0625)^2``````` =(sqrt(PDL)+0.0625)^2````` SL
22.5````````````````````` =degree/180=22.5/180=0.125``````````` =(sqrt(PDL)+0.125)^2```````` =(sqrt(PDL)-0.125)^2`````` Buy/Sell At
45``````````````````````` =degree/180=45/180=0.25`````````````` =(sqrt(PDL)+0.25)^2````````` =(sqrt(PDL)-0.25)^2``````` Target-1
90``````````````````````` =degree/180=90/180=0.5``````````````` =(sqrt(PDL)+0.5)^2`````````` =(sqrt(PDL)-0.5)^2```````` Target-2
135`````````````````````` =degree/180=135/180=0.75````````````` =(sqrt(PDL)+0.75)^2````````` =(sqrt(PDL)-0.75)^2``````` Target-3
180`````````````````````` =degree/180=180/180=1```````````````` =(sqrt(PDL)+1)^2```````````` =(sqrt(PDL)-1)^2`````````` Target-4
225`````````````````````` =degree/180=225/180=1.25````````````` =(sqrt(PDL)+1.25)^2````````` =(sqrt(PDL)-1.25)^2``````` Target-5
270`````````````````````` =degree/180=270/180=1.5`````````````` =(sqrt(PDL)+1.5)^2`````````` =(sqrt(PDL)-1.5)^2```````` Target-6
315`````````````````````` =degree/180=315/180=1.75````````````` =(sqrt(PDL)+1.75)^2````````` =(sqrt(PDL)-1.75)^2``````` Target-7
360`````````````````````` =degree/180=360/180=2```````````````` =(sqrt(PDL)+2)^2```````````` =(sqrt(PDL)-2)^2`````````` Target-8
Based On Previous Days Close Price
(lets call it PDC)
Degree's````````````````` Degree Factor```````````````````````` Buy````````````````````````` Sell
11.25```````````````````` =degree/180=11.25/180=0.0625````````` =(sqrt(PDC)-0.0625)^2``````` =(sqrt(PDC)+0.0625)^2````` SL
22.5````````````````````` =degree/180=22.5/180=0.125``````````` =(sqrt(PDC)+0.125)^2```````` =(sqrt(PDC)-0.125)^2`````` Buy/Sell At
45``````````````````````` =degree/180=45/180=0.25`````````````` =(sqrt(PDC)+0.25)^2````````` =(sqrt(PDC)-0.25)^2``````` Target-1
90``````````````````````` =degree/180=90/180=0.5``````````````` =(sqrt(PDC)+0.5)^2`````````` =(sqrt(PDC)-0.5)^2```````` Target-2
135`````````````````````` =degree/180=135/180=0.75````````````` =(sqrt(PDC)+0.75)^2````````` =(sqrt(PDC)-0.75)^2``````` Target-3
180`````````````````````` =degree/180=180/180=1```````````````` =(sqrt(PDC)+1)^2```````````` =(sqrt(PDC)-1)^2`````````` Target-4
225`````````````````````` =degree/180=225/180=1.25````````````` =(sqrt(PDC)+1.25)^2````````` =(sqrt(PDC)-1.25)^2``````` Target-5
270`````````````````````` =degree/180=270/180=1.5`````````````` =(sqrt(PDC)+1.5)^2`````````` =(sqrt(PDC)-1.5)^2```````` Target-6
315`````````````````````` =degree/180=315/180=1.75````````````` =(sqrt(PDC)+1.75)^2````````` =(sqrt(PDC)-1.75)^2``````` Target-7
360`````````````````````` =degree/180=360/180=2```````````````` =(sqrt(PDC)+2)^2```````````` =(sqrt(PDC)-2)^2`````````` Target-8
example based On Today's Opening Price = 4339
Degree's```````` Degree Factor```````` Buy`````````` Sell
11.25``````````` 0.0625``````````````` 4330.77`````` 4347.24```````` SL
22.5```````````` 0.125```````````````` 4355.48`````` 4322.55```````` Buy/Sell At
45`````````````` 0.25````````````````` 4372.00`````` 4306.13```````` Target-1
90`````````````` 0.5`````````````````` 4405.12`````` 4273.38```````` Target-2
135````````````` 0.75````````````````` 4438.37`````` 4240.76```````` Target-3
180````````````` 1```````````````````` 4471.74`````` 4208.26```````` Target-4
225````````````` 1.25````````````````` 4505.24`````` 4175.88```````` Target-5
270````````````` 1.5`````````````````` 4538.86`````` 4143.64```````` Target-6
315````````````` 1.75````````````````` 4572.61`````` 4111.51```````` Target-7
360````````````` 2```````````````````` 4606.48`````` 4079.52```````` Target-8
Note : ignore the '`' , inserted them to fill up the spaces , it was looking very weird!, tried to fix it as much as I can.
Note :- Please correct me if I'm wrong , as I've already mentioned I don't have it's original documentation.
if anyone can find it or already has it then please feel free to share it.
Refracted EMARefracted EMA is a price based indicator with bands that is built on moving average.
The price range between the bands directly depends on relationship of Average True Range to Moving Average. This gives us very valuable variable constant that changes with the market moves.
So the bands expand and contract due to changes in volatility of the market, which makes this tool very flexible exposing psychological levels.

MACD + RSI with Trade SignalsThis indicator by default comes with the MACD shown but can be switched to show the RSI instead. Settings for each indicator can also be customized as well as Buy/Sell signals given based on pull back crossovers that follow the 200 EMA of the price Chart. There's an above/below middle fill option you can use but I tend not to but I know some traders like to see when an oscillator is above/below the middle and use it as a trend diretion. By the way, the fourth setting for the MACD (which is 2 by default) is the size of the histogram.
Buy Signal = Price is above the 200 EMA. Current or previous MACD or RSI line is/was below middle line and now crossed above the signal line.
Sell Signal = Price is below the 200 EMA. Current or previous MACD or RSI line is/was above middle line and now crossed below the signal line.
There are alerts for each signal as well (MACD and RSI, both buy and sell).
Feel free to leave a comment regarding issues or suggestions for this indicator or ideas for the next one I should do :)

SST-V2this scrips is combination of Moving average that you can alter with buy and Sell signal.
it is easy to use. u can go with the trend as of the bar color turn to blue it is indcate tha ur in bullish trend
and with turn to red it indicate that your in down trend.
Use Ema 200 for trend confluences
hope you like it.
thank's
Sadflute
