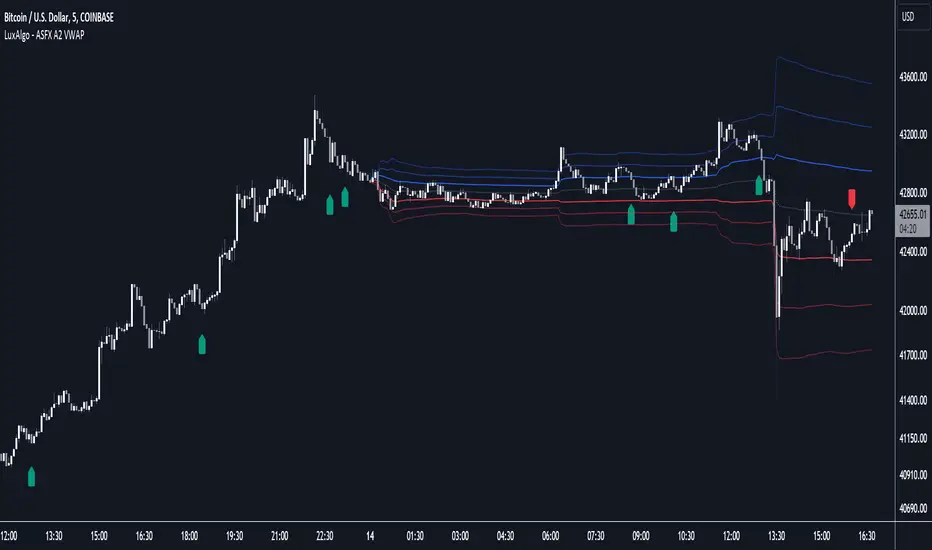
ASFX A2 VWAP [LuxAlgo]The ASFX A2 VWAP is a toolkit based on A2 signals and daily anchored VWAP bands, a methodology proposed by trader & educator Austin Silver (ASFX).
Pre-built alerts are also included.
🔶 USAGE
The A2 strategy involves identifying potential trades using specific signals and confirmation from the 21 EMA (Exponential Moving Average). Below we can see a bullish A2 signal triggering as price is closing below the 21 EMA with less than half of the candles closing price.
Within the settings, we have enabled the stop loss setting to assist us with trade setups generated from A2 signals.
Users can enable multiple layers of StDev multipliers on the AAVWAP to find areas of support & resistance alongside the A2 signals & other features included.
🔶 DETAILS
If 'Filter Based On VWAP' is enabled, bullish signals will only be displayed if located above the anchored VWAP, while bearish signals will only be displayed when located under the VWAP. The image above illustrates this, with transparent signals showing the ones that are supposed to be filtered.
The Stop Loss is based on the most recent A2 signal, and is constructed from the 1.618 Fibonacci retracement using the following points depending on the A2 signal:
Bullish: From candle low to the current daily maximum.
Bearish: From candle high to current daily minimum.
🔶 SETTINGS
🔹 A2
Validation EMA Period : Period of the EMA used to validate triggered A2 signals.
Trigger EMA Period : Period of the EMA used to trigger A2 signals.
Filter Based On VWAP : Filter A2 signals based on their location relative to the VWAP output.
🔹 VWAP
source : Input data for the anchored VWAP calculation
Show Central AVWAP : Display central VWAP on the chart
StDev Multiplier 1 : Display first VWAP bands, using a StDev multiplier of 1 by default.
StDev Multiplier 2 : Display second VWAP bands, using a StDev multiplier of 2 by default.
StDev Multiplier 3 : Display third VWAP bands, using a StDev multiplier of 3 by default.
🔹 Stop Loss
Stop Loss : Display stop loss based on the most recent A2 signal
Buysellsignal
Logical Trading Indicator V.1Features of the Logical Trading Indicator V.1
ATR-Based Trailing Stop Loss
The Logical Trading Indicator V.1 utilizes the Average True Range (ATR) to implement a dynamic trailing stop loss. You can customize the sensitivity of your alerts by adjusting the ATR Multiple and ATR Period settings.
Higher ATR Multiple values create wider stops, while lower values result in tighter stops. This feature ensures that your trades are protected against adverse price movements. For best practice, use higher values on higher timeframes and lower values on lower term timeframes.
Bollinger Bands
The Logical Trading Indicator V.1 includes Bollinger Bands, which can be customized to use either a Simple Moving Average (SMA) or an Exponential Moving Average (EMA) as the basis.
You can adjust the length and standard deviation multiplier of the Bollinger Bands to fine-tune your strategy. The color of the basis line changes to green when price is above and red when price is below the line to represent the trend.
The bands show a range vs a single band that also represents when the price is in overbought and oversold ranges similar to an RSI. These bands also control the take profit signals.
You also have the ability to change the band colors as well as toggle them off, which only affects the view, they are still active which will still fire the take profit signals.
Momentum Indicator
Our indicator offers a momentum filter option that highlights market momentum directly on the candlesticks, identifying periods of bullish, bearish, or consolidation phases. You can enable or disable this filter as needed, providing valuable insights into market conditions.
By default, you will see the candlestick colors represent the momentum direction as green or red, and consolidation periods as white, but the filter on the BUY and SELL signals is not active. The view options and filter can be toggled on and off in the settings.
Buy and Sell Signals
The Logical Trading Indicator V.1 generates buy and sell signals based on a combination of ATR-based filtering, Bollinger Band basis crossover, and optional momentum conditions if selected in the settings. These signals help you make informed decisions about when to enter or exit a trade. You can also enable a consolidation filter to stay out of trades during tight ranges.
Basically a BUY signal fires when the price closes above the basis line, and the price meets or exceeds the ATR multiple from the previous candle length, which is also editable in the settings.
If the momentum filter is engaged, it will not fire BUY signals when in consolidation periods. It works just the opposite for SELL signals.
Take Profit Signals
We've integrated a Take Profit feature that helps you identify points to exit your trades with profits. The indicator marks Long Take Profit when prices close below the upper zone line of the Bollinger Bands after the previous candle closes inside the band, suggesting an optimal point to exit a long trade or consider a short position.
Conversely, Short Take Profit signals appear when prices close above the lower zone after the previous candle closes inside of it, indicating the right time to exit a short trade or contemplate a long position.
Alerts for Informed Trading
The Logical Trading Indicator V.1 comes equipped with alert conditions for buy signals, sell signals, take profit points, and more. Receive real-time notifications to your preferred devices or platforms to stay updated on market movements and trading opportunities.

buy/sell signals with Support/Resistance (InvestYourAsset) 📣The present indicator is a MACD based buy/sell signals indicator with support and resistance, that can be used to identify potential buy and sell signals in a security's price.
📣It is based on the MACD (Moving Average Convergence Divergence) indicator, which is a momentum indicator that shows the relationship between two moving averages of a security's price.
📣 The indicator also plots support and resistance levels, which can be used to confirm buy and sell signals. The support and resistance can also be used as a stoploss for existing position.
👉 To use the indicator, simply add it to your trading chart. The indicator will plot three sections:
📈 Price and Signals: This section plots the security's price and the MACD buy and sell signals.
📈 MACD Oscillator: This section plots the MACD oscillator, which is a histogram that shows the difference between the two moving averages.
📈 Moving Averages: This section plots the two moving averages that the MACD oscillator is based on.
📈 Support and Resistance: This section plots support and resistance levels, which are calculated based on the security's recent price action.
👉 To identify buy and sell signals, you can look for the following:
📈 Buy signal: When shorter Moving Average crosses over longer Moving Average.
📈 Sell signal: When shorter moving average crosses under longer moving average.
📈 You can also look for divergences between the MACD oscillator and the security's price. A divergence occurs when the MACD oscillator is moving in one direction, but the security's price is moving in the opposite direction. Divergences can be a sign of a potential trend reversal.
👉 To confirm buy and sell signals, you can look for support and resistance levels take a look at below snapshot. If a buy signal occurs at a support level, it is a stronger signal than if it occurs at a random price level. Similarly, if a sell signal occurs at a resistance level, it is a stronger signal than if it occurs at a random price level.
⚡ Here is a example of how to use the indicator to identify buy signal:
☑ Add the indicator to your trading chart.
☑Look for a buy signal when short MA crosses over Long MA.
☑Look for the buy signal to occur at a support level.
☑Enter a long position at the next candle.
☑Place a stop loss order below the support level.
☑Take profit when the MACD line crosses below the signal line, or when the security reaches a resistance level.
⚡ Here is an example of how to use the indicator to identify a sell signal:
☑Add the indicator to your trading chart.
☑Look for a sell signal, when shorter moving average crosses under longer moving average.
☑Look for the sell signal to occur at a resistance level.
☑Enter a short position at the next candle.
☑Place a stop loss order above the resistance level.
☑Take profit when the MACD line crosses above the signal line, or when the security reaches a support level.
✅Things to consider while using the indicator:
📈Look for buy signals in an uptrend and sell signals in a downtrend. This will increase the likelihood of your trades being successful.
📈Place your stop losses below the previous swing low or support for buy signals and above the previous swing high or resistance for sell signals. This will help to limit your losses if the trade goes against you.
📈Consider taking profits at key resistance and support levels. This will help you to lock in your profits and avoid giving them back to the market.
Follow us for timely updates regarding indicators that we may publish in future and give it a like if you appreciate the indicator.

Brutal ScalpsThe "Brutal Scalps" indicator is designed for both novice and expert traders looking to take advantage of short-term price movements. This powerful tool provides a multi-timeframe trend analysis along with dynamic Take Profit (TP) and Stop Loss (SL) levels, enhancing your trading decisions and risk management.
Features:
Multi-Timeframe Trend Analysis - You get a bird's eye view of the main oscillators on the selected timeframe
Last trade panel - Overview of the last trade values: TPs, SL and entry along with a quick stat on the performance over the last 10 trades
Baseline - MA based on either volatility or volume . Changes color depending on the angle and the consolidation area threshold that can be modified.
ATR(Average True Range) dynamic take profits and stop losses
Trend color - Can be enabled to highlight local trend start and end
Leverage setting
This setting is used to send a leverage amount with your alerts, this can be useful if you send your alerts though webhooks.
Signalling type - Classic
The original Brutal scalps signal detection mechanism based on order block/ engulfing candle detection only. Conditions in the MTF trend analysis panel must be met.
Signalling type - Breakout
Prioritizes candle formation that break a given number of candle formation(Eg. Highest high in the last x candles) , combined with the baseline entry condition
Signalling type - Trend following
Angled more towards longer direction moves. Uses adx combined with the price relationship to the 200MA
Key levels zone- Plots the liquidity pockets on the chart
Swing detections- uses moving averages that are plotted in regards to the selected number of candles.
Candle colors - The yellow candles are bullish engulfing candles, while the purple candles are bearish engulfing candles. These candles are also highlighted because their volume exceeds that of the previous 10 candles.
Peak profit - shows a label that displays the highest profit level reached after the signal was triggered , multiplied by the leverage in the input.
How to use:
Brutal Scalps is like your battle plan, you prepare for facing the markets with tools and insights.
1. Use the Multi TF Trend settings to set up the Trend Table in the top right (default position) panel. This will give you an overview of the oscillators in the selected timeframe. You should always watch a higher timeframe than the one you are using on the chart.
Ex.: If you are charting 15m , use the 1hr setting on the trend panel.
2. The baseline is one of the key factors in signal identification, use this wisely. The baseline consolidation threshold is the sensitivity of the line to stagnating candles. If the market is static and no trades come out , it might be because the threshold is set too high. The default of 3 should be a good fit for most setups. Just bare in mind that the higher the threshold the more candles will be considered as a consolidation area. Higher threshold also means better confirmation but also less trades coming in.
3. Signalling types can and should be used in regards to the current market formation.
Examples:
- If a market is moving in a stairs pattern, a good way to tackle it would be through the breakout signalling type.
- When the market is clearly trending, the use of the trend following type is most suited.
- If you want an all-rounder setup that is a jack of all trades but master of nothing, then the Classic type would be the most suited.
Additionally, if the market is extremely undecided and the above types don't perform that well on their own, the use of Allow Opposite Signal Only can reduce losses by only posting trades that are in the opposite direction, no more consecutive buys or sells.
Set the key levels zones to have extra manual confirmation. These zones are based on order blocks and highlight important liquidity areas. While these don't have any direct impact on the signal recognition, they can help to visually validate them.

YinYang TrendTrend Analysis has always been an important aspect of Trading. There are so many important types of Trend Analysis and many times it may be difficult to identify what to use; let alone if an Indicator can/should be used in conjunction with another. For these exact reasons, we decided to make YinYang Trend. It is a Trend Analysis Toolkit which features many New and many Well Known Trend Analysis Indicators. However, everything in there is added specifically for the reason that it may work well in conjunction with the other Indicators prevalent within. You may be wondering, why bother including common Trend Analysis, why not make everything unique? Ideally, we would, however, you need to remember Trend Analysis may be one of the most common forms of charting. Therefore, many other traders may be using similar Trend Analysis either through plotting manually or within other Indicators. This all boils down to Psychology; you are trading against other traders, who may be seeing some of the similar information you are, and therefore, you may likewise want to see this information. What affects their trading decisions may affect yours as well.
Now enough about Trend Analysis, what is within this Indicator, and what does it do? Well, first let’s quickly mention all of its components, then we will, through a Tutorial, discuss each individually and finally how each comes together as a cohesive whole. This Indicator features many aspects:
Bull and Bear Signals
Take Profit Signals
Bull and Bear Zones
Information Tables displaying: (Boom Meter, Bull/Bear Strength, Yin/Yang State)
16 Cipher Signals
Extremes
Pivots
Trend Lines
Custom Bollinger Bands
Boom Meter Bar Colors
True Value Zones
Bar Strength Indexes
Volume Profile
There are many things to cover within our Tutorial so let's get started, chronologically from the list above.
Tutorial:
Bull and Bear Signals:
We’ve zoomed out quite a bit for this example to help give you a broader aspect of how these Bull and Bear signals work. When a signal appears, it is displaying that there may be a large amount of Bullish or Bearish Trend Analysis occurring. These signals will remain in their state of Bull or Bear until there is enough momentum change that they change over. There are a couple Options within the Settings that dictate when/where/why these signals appear, and this example is using their default Settings of ‘Medium’. They are, Purchase Speed and Purchase Strength. Purchase Speed refers to how much Price Movement is needed for a signal to occur and Purchase Strength refers to how many verifications are required for a signal to occur. For instance:
'High' uses 15 verifications to ensure signal strength.
'Medium' uses 10 verifications to ensure signal strength.
'Low' uses 5 verifications to ensure signal strength.
'Very Low' uses 3 verifications to ensure signal strength.
By default it is set to Medium (10 verifications). This means each verification is worth 10%. The verifications used are also relevant to the Purchase Speed; meaning they will be verified faster or slower depending on its speed setting. You may find that Faster Speeds and Lower Verifications may work better on Higher Time Frames; and Slower Speeds and Higher Verifications may work better on Lower Time Frames.
We will demonstrate a few examples as to how the Speed and Strength Settings work, and why it may be beneficial to adjust based on the Time Frame you’re on:
In this example above, we’ve kept the same Time Frame (1 Day), and scope; but we’ve changed Purchase Speed from Medium->Fast and Purchase Strength from Medium-Very Low. As you can see, it now generates quite a few more signals. The Speed and Strength settings that you use will likely be based on your trading style / strategy. Are you someone who likes to stay in trades longer or do you like to swing trade daily? Likewise, how do you go about identifying your Entry / Exit locations; do you start on the 1 Day for confirmation, then move to the 15/5 minute for your entry / exit? How you trade may determine which Speed and Strength settings work right for you. Let's jump to a lower Time Frame now so you can see how it works on the 15/5 minute.
Above is what BTC/USDT looks like on the 15 Minute Time Frame with Purchase Speed and Strength set to Medium. You may note that the signals require a certain amount of movement before they get started. This is normal with Medium and the amount of movement is generally dictated by the Time Frame. You may choose to use Medium on a Lower Time Frame as it may work well, but it may also be best to change it to a little slower.
We are still on the 15 Minute Time Frame here, however we simply changed Purchase Speed from Medium->Slow. As you can see, lots of the signals have been removed. Now signals may ‘hold their ground’ for much longer. It is important to adjust your Purchase Speed and Strength Settings to your Time Frame and personalized trading style accordingly.
Above we have now jumped down to the 5 Minute Time Frame. Our Purchase Speed is Slow and our Purchase Strength is Medium. We can see it looks pretty good, although there is some signal clustering going on in the middle there. If we change our Settings, we may be able to get rid of that.
We have changed our Purchase Speed from Slow->Snail (Slowest it can go) and Purchase Strength from Medium->Very Low (Lowest it can go). Changing it from Slow-Snail helped get rid of the signal clustering. You may be wondering why we lowered the Strength from Medium->Very Low, rather than going from Medium->High. This is a use case scenario and one you’ll need to decide for yourself, but we noticed when we changed the Speed from Slow->Snail that the signal clustering was gone, so then we checked both High and Very Low for Strengths to see which produced the best looking signal locations.
Please remember, you don’t have to use it the exact way we’ve displayed in this Tutorial. It is meant to be used to suit your Trading Style and Strategy. This is why we allow you to modify these settings, rather than just automating the change based on Time Frames. You’ll likely need to play around with it, as you’ll notice different settings may work better on certain pairs and Time Frames than others.
Take Profit Signals:
We’ve reset our Purchase Settings, everything is on defaults right now at Medium. We’ve enabled Take Profit signals. As you can see there are both Take Profit signals for the Bulls and the Bears. These signals are not meant to be used within automation. In fact, none of this indicator is. These signals are meant to show there has been a strong change in momentum, to such an extent that the signal may switch from its current (Bull or Bear) and now may be a good time to Take Profit. Your Take Profit Settings likewise has a Speed and Strength, and you can set them differently than your Purchase Settings. This is in case you want to Take Profit in a different manner than your Purchase Signals. For instance:
In the example above we’ve kept Purchase Strength and Speed at Medium but we changed our Take Profit Speed from Medium->Snail and our Take Profit Strength from medium->Very Low. This greatly reduces the amount of Take Profit signals, and in some cases, none are even produced. This form of Take Profit may act more as a Trailing Take Profit that if it’s not hit, nothing appears.
In this example we have changed our Purchase Speed from Medium->Fast, our Purchase Strength from Medium->Very Low. We’ve also changed our Take Profit Speed from Snail->Medium and kept our Take Profit Strength on Very Low. Now we may get our signals quicker and likewise our Take Profit may be more rare. There are many different ways you can set up your Purchase and Take Profit Settings to fit your Trading Style / Strategy.
Bull and Bear Zones:
We have disabled our Take Profit locations so that you can see the Bull and Bear Zones. These zones change color when the Signals switch. They may represent some strong Support and Resistance locations, but more importantly may be useful for visualizing changes in momentum and consolidation. These zones allow you to see various Moving Averages; and when they start to ‘fold’ (cross) each other you may see changes in momentum. Whereas, when they’re fully stretched out and moving all in the same direction, it can provide insight that the current rally may be strong. There is also the case where they look like they’re ‘twisted’ together. This happens when all of the Moving Averages are very close together and may be a sign of Consolidation. We will go over a few examples of each of these scenarios so you can understand what we’re referring to.
In this example above, there are a few different things happening. First we have the yellow circle, where the final and slowest Moving Average (MA) crossed over and now all of the MA’s that form the zone are Bullish. You can see this in the white circle where there are no MA’s that are crossing each other. Lastly, within the blue circle, we can see how some of the faster MA’s are crossing under each other. This is a bullish momentum change. The Faster moving MA’s will always be the first ones to cross before the Slower ones do. There is a color scheme in place here to represent the Speed of the MA within the Zone. Light blue is the fastest moving Bull color -> Light Green and finally -> Dark Green. Yellow is the fastest moving Bear color -> Orange and finally -> Red / Dark Red within the Zone.
Next we will review a couple different examples of what Consolidation looks like and why it is very important to look out for. Consolidation is when Most, if not All of the MA’s are very tightly ‘twisted’ together. There is very little spacing between almost all of the MA’s in the example above; highlighted by the white circle. Consolidation is important as it may indicate a strong price movement in either direction will occur soon. When the price is consolidating it means it has had very little upwards or downwards movement recently. When this happens for long enough, MA’s may all get very similar in value. This may cause high volatility as the price tries to break out of Consolidation. Let's look at another example.
Above we have two more examples of what Consolidation looks like and how high Volatility may occur after the Consolidation is broken. Please note, not all Consolidation will create high Volatility but it is something you may want to look out for.
Information Tables displaying: (Boom Meter, Bull/Bear Strength, Yin/Yang State):
Information tables are a very important way of displaying information. It contains 3 crucial pieces of information:
Boom Meter
Bull/Bear Strength
Yin/Yang State
Boom Meter is a meter that goes from 0-100% and displays whether the current price is Dumping (0 - 29%), Consolidating (30 - 70%) or Pumping (71 - 100%). The Boom Meter is meant to be a Gauge to how the price is currently fairing. It is composed of ~50 different calculations that all vary different weights to calculate its %. Many of the calculations it uses are likewise used in other things, such as the Bull/Bear Strength, Bull/Bear Zone MA cross’, Yin/Yang State, Market Cipher Signals, RSI, Volume and a few others. The Boom Meter, although not meant to be used solely to make purchase decisions, may give you a good idea of current market conditions considering how many different things it evaluates.
Bull/Bear Strength is relevant to your Purchase Speed and Strength. It displays which state it is currently in, and the % it is within that state. When a % hits 0, is when the state changes. When states change, they always start at 100% initially and will go down at the rate of Purchase Strength (how many verifications are needed). For instance, if your Purchase Strength is set to ‘Medium’ it will move 10% per verification +/-, if it is set to High, it will move 6.67% per verification +/-. Bull/Bear Strength is a good indicator of how well that current state is fairing. For instance if you started a Long when the state changed to Bull and now it is currently at Bull with 20% left, that may be a good indication it is time to get out (obviously refer to other data as well, but it may be a good way to know that the state is 20% away from transitioning to Bear).
Yin/Yang State is the strongest MA cross within our Indicator. It is unique in the sense that it is slow to change, but not so much that it moves slowly. It isn’t as simple as say a Golden/Death Cross (50/200), but it crosses more often and may hold similar weight as it. Yin stands for Negative (Bearish) and Yang stands for Positive (Bullish). The price will always be in either a state of Yin or Yang, and just because it is in one, doesn’t mean the price can’t/won’t move in the opposite direction; it simply means the price may be favoring the state it is in.
16 Cipher Signals:
Cipher Signals are key visuals of MA cross’ that may represent price movement and momentum. It would be too confusing and hard to decipher these MA’s as lines on a chart, and therefore we decided to use signals in the form of symbols instead. There are 12 Standard and 4 Predictive/Confirming Cipher signals. The Standard Cipher signals are composed of 6 Bullish and 6 Bearish (they all have opposites that balance each other out). There can never be 2 of the same signal in a row, as the Bull and Bear cancel each other out and it's always in a state of one or the other. When all 6 Bullish or Bearish signals appear in a row, very closely together, without any of the opposing signals it may represent a strong momentum movement is about to occur.
If you refer to the example above, you’ll see that the 6 Bullish Cipher signals appeared exactly as mentioned above. Shortly after the Green Circle appeared, there was a large spike in price movement in favor of the Bulls. Cipher signals don’t need to appear in a cluster exactly like the white circle in this photo for momentum to occur, but when it does, it may represent volatility more than if it is broken up with opposing signals or spaced out over a longer time span.
Above is an example of the opposite, where all 6 Bearish Cipher signals appeared together without being broken by a Bullish Cipher signal or being too far spaced out. As you can see, even though past it there was a few Bullish signals, they were quickly reversed back to Bearish before a large price movement occurred in favor of the Bears.
In the example above we’ve changed Cipher signals to Predictive and Confirming. Support Crosses (Green +) and Blood Diamonds (Red ♦) are the normal Cipher Signals that appear within the Standard Set. They are the first Cipher Signal that appears and are the most common ones as well. However, just because they are the first, that doesn’t mean they aren’t a powerful Cipher signal. For this reason, there are Predictive and Confirming Cipher signals for these. The Predictive do just that, they appear slightly sooner (if not the same bar) as the regular and the Confirming appear later (1+ bars usually). There will be times that the Predictive appears, but it doesn’t resort to the Regular appearing, or the Regular appears and the Confirming doesn’t. This is normal behavior and also the purpose of them. They are meant to be an indication of IF they may appear soon and IF the regular was indeed a valid signal.
Extremes:
Extremes are MA’s that have a very large length. They are useful for seeing Cross’ and Support and Resistance over a long period of time. However, because they are so long and slow moving, they might not always be relevant. It’s usually advised to turn them on, see if any are close to the current price point, and if they aren’t to turn them off. The main reason being is they stretch out the chart too much if they’re too far away and they also may not be relevant at that point.
When they are close to the price however, they may act as strong Support and Resistance locations as circled in the example above.
Pivots:
Pivots are used to help identify key Support and Resistance locations. They adjust on their own in an attempt to keep their locations as relevant as possible and likewise will adjust when the price pushes their current bounds. They may be useful for seeing when the Price is currently testing their level as this may represent Overbought or Oversold. Keep in mind, just because the price is testing their levels doesn’t mean it will correct; sometimes with high volatility or geopolitical news, movement may continue even if it is exhibiting Overbought or Oversold traits. Pivots may also be useful for seeing how far the price may correct to, giving you a benchmark for potential Take Profit and Stop Loss locations.
Trend Lines:
Trend Lines may be useful for identifying Support and Resistance locations on the Vertical. Trend Lines may form many different patterns, such as Pennants, Channels, Flags and Wedges. These formations may help predict and drive the price in specific directions. Many traders draw or use Indicators to help create Trend Lines to visualize where these formations will be and they may be very useful alone even for identifying possible Support and Resistance locations.
If you refer to the previous example, and now to this example, you’ll notice that the Trend Line that supported it in 2023 was actually created in June 2020 (yellow circle). Trend Lines may be crucial for identifying Support and Resistance locations on the Vertical that may withhold over time.
Custom Bollinger Bands:
Bollinger Bands are used to help see Movement vs Consolidation Zones (When it's wide vs narrow). It's also very useful for seeing where the correction areas may be. Price may bounce between top and bottom of the Bollinger Bands, unless in a pump or dump. The Boom Meter will show you whether it is currently: Dumping, Consolidation or Pumping. If combined with Boom Meter Bar Colors it may be a good indication if it will break the Bollinger Band (go outside of it). The Middle Line of the Bollinger Band (White Line) may be a very strong support / resistance location. If the price closes above or below it, it may be a good indication of the trend changing (it may indicate one of the first stages to a pump or dump). The color of the Bollinger Bands change based on if it is within a Bull or Bear Zone.
What makes this Bollinger Band special is not only that it uses a custom multiplier, but it also incorporates volume to help add weight to the calculation.
Boom Meter Bar Colors:
Boom Meter Bar Colors are a way to see potential Overbought and Oversold locations on a per bar basis. There are 6 different colors within the Boom Meter bar colors. You have:
Overbought and Very Bullish = Dark Green
Overbought and Slightly Bullish = Light Green
Overbought and Slight Bearish = Light Red
Oversold and Very Bearish = Dark Red
Oversold and Slightly Bearish = Orange
Oversold and Slightly Bullish = Light Purple
When there is no Boom Meter Bar Color prevalent there won’t be a color change within the bar at all.
Just because there is a Boom Meter Bar Color change doesn’t mean you should act on it purchase or sell wise, but it may be an indication as to how that bar is fairing in an Overbought / Oversold perspective. Boom Meter Bar Colors are mainly based on RSI but do take in other factors like price movement to determine if it is Overbought or Oversold. When it comes to Boom Meter Bar Color, you should take it as it is, in the sense that it may be useful for seeing how Individual bars are fairing, but also note that there may be things such as:
When there is Very Overbought (Dark Green) or Very Oversold (Dark Red), during massive pump or dumps, it will maintain this color. However, once it has lost ‘some’ momentum it will likely lose this color.
When there has been a massive Pump or Dump, and there is likewise a light purple or light red, this may mean there is a correction or consolidation incoming.
True Value Zones:
True Value zones are our custom way of displaying something that is similar to a Bollinger Band that can likewise twist like an MA cross. The main purpose of it is to display where the price may reside within. Much like a Bollinger Band it has its High and Low within its zone to specify this location. Since it has the ability to cross over and under, it has the ability to specify what it thinks may be a Bullish or Bearish zone. This zone uses its upper level to display what may be a Resistance location and its lower level to display what may be a Support location. These Support and Resistance locations are based on Momentum and will move with the price in an attempt to stay relevant.
You may use these True Values zones as a gauge of if the price is Overbought or Oversold. When the price faces high volatility and moves outside of the True Value Zones, it may face consolidation or likewise a correction to bring it back within these zones. These zones may act as a guideline towards where the price is currently valued at and may belong within.
Bar Strength Indexes:
Bar Strength Indexes are our way of ranking each bar in correlation to the last few. It is based on a few things but is highly influenced on Open/Close/High/Low, Volume and how the price has moved recently. They may attempt to ‘rate’ each bar and how Bullish/Bearish each of these bars are. The Green number under the bar is its Bullish % and the Red number above the bar is its Bearish %. These %’s will always equal 100% when combined together. Bar Strength Indexes may be useful for seeing when either Bullish or Bearish momentum is picking up or when there may be a reversal / consolidation.
These Bar Strength Indexes may allow you to decipher different states. If you refer to the example above, you may notice how based on how the numbers are changing, you may see when it has entered / exited Bullish, Bearish and Consolidation. Likewise, if you refer to the current bar (yellow circle), you can see that the Bullish % has dropped from 93 to 49; this may be signifying that the Bullish movement is losing momentum. You may use these changes in Bar Indexes as a guide to when to enter / end trades.
Volume Profile:
Volume Profile has been something that has been within TradingView for quite some time. It is a very useful way of seeing at what Horizontal Price there has been the most volume. This may be very useful for seeing not only Support and Resistance locations based on Volume, but also seeing where the majority of Limit Orders are placed. Limit Orders are where traders decide they want to either Buy / Sell but have the order placed so the trade won’t happen until the price reaches a certain amount. Either through many orders from many traders, or a single order from a ‘Whale’ (trader with a lot of capital); you may see Support and Resistance at specific Price Points that have large Volume.
Many Volume Profile Indicators feature a breakdown of all the different locations of volume, along with a Point Of Control (POC) line to designate where the most Volume has been. To try and reduce clutter within our already very saturated Toolkit Indicator, we’ve decided to strip our Volume Profile to only display this POC line. This may allow you to see where the crucial Volume Support and Resistance is without all of the clutter.
You may be wondering, well how important is this Volume Profile POC line and how do I go about using it? Aside from it being a gauge towards where Support and Resistance may be within Volume, it may also be useful for identifying good Long/Short locations. If you think of the line as a ‘Battle’ between the Bulls and Bears, they’re both fighting over that line. The Bears are wanting to break through it downwards, and the Bulls are wanting to break through it upwards. When one side has temporarily won this battle, this means they may have more Capital to push the price in their direction. For instance, if both the Bulls and the Bears are fighting over this POC price, that means the Bears think that price is a good spot to sell; however, the Bulls also deem that price to be a good point to buy. If the Bulls were to win this battle, that means the Bears either canceled their orders to reevaluate, or all of their orders have been completed from the Bulls buying them all. What may happen after that is, if the Bulls were able to purchase all of these Limit Sell Orders, then they may still have more Capital left to continue to pressure the price upwards. The same may be true for if the Bears were to win this ‘Battle’.
How to use YinYang Trend as a cohesive whole:
Hopefully you’ve read and understand how each aspect of this Indicator works on its own, as knowing how/what they each do is important to understanding how it is used as a cohesive whole. Due to the fact that this Toolkit of an Indicator displays so much data, you may find it easier to use and understand when you’re zoomed in a little, somewhat like we are in this example above.
If we refer to the example above, you may like us, deduce a few things:
1. The current price may be VERY Overbought. This may be seen by a few different things:
The Boom Meter Bar Colors have been exhibiting a Dark Green color for 6 bars in a row.
The price has continuously been moving the High (red) Pivot Upwards.
Our Boom Meter displays ‘Pumping’ at 100%.
The price broke through a Downward Trend Line that was created in February of 2022 at 45,000 like it was nothing.
The Bar Strength Index hit a Bullish value of 93%.
The Price broke out of the Bollinger Bands and continues to test its upper levels.
The Low is much greater than our fastest moving MA that creates the Purchase Zones.
The Price is vastly outside of the True Value Zone.
The Bar Strength Index of our current bar is 50% bullish, which is a massive decrease from the previous bar of 93%. This may indicate that a correction is coming soon.
2. Since we’ve identified the current price may be VERY Overbought, next we need to identify if/when/to where it may correct to:
We’ve created a new example here to display potential correction areas. There are a few places it has the ability to correct to / within:
The downward Trend Line (red) below the current bar sitting currently at 32,750. This downward Trend Line is at the same price point as the Fastest MA of our Purchase Zone which may provide some decent Support there.
Between two crucial Pivot heights, within a zone of 30,000 to 31,815. This zone has the second fastest MA from the Purchase Zone right near the middle of it at 31,200 which may act as a Support within the Zone. Likewise there is the Bollinger Band Basis which is also resting at 30,000 which may provide a strong Support location here.
If 30,000 fails there may be a correction all the way to the bottom of our True Value Zone and the top of one of our Extremes at 27,850.
If 27,850 fails it may correct all the way to the bottom of our Purchase Zone / lowest of our Extremes at 27,350.
If all of the above fails, it may test our Volume Profile POC of 26,430. If this POC fails, the trend may switch to Bearish and continue further down to lower levels of Support.
The price can always correct more than the prices mentioned above, but considering overall this Indicator is favoring the Bulls, we will tailor this analysis in Favor of the Bullish Momentum maintaining even during this correction. For these reasons, we think the price may correct between the 30,000 and 31,815 zone before continuing upwards and maintaining this Bullish Momentum.
Please note, these correction estimates are just that, they’re estimates. Aside from the fact that the price is very overbought right now and our Bar Strength Index may be declining (bar hasn’t closed yet); the Boom Meter Strength remains at 100%, meaning there may not be much Bearish momentum changes happening yet. We just want to show you how an Preemptive analysis may be done before there are even Bearish Cipher Signals appearing.
Using this Indicator, you may be able to decipher Entry and Exits. In the previous example, we went over how you may use it to see where a correction (Exit / Take Profit) may be and how far this correction may go. In this example above we will be discussing how to identify Entry locations. We will be discussing a Bullish Buy entry but the same rules apply for a Bearish Sell Entry just the opposite with the Cipher Signals.
If you refer to where we circled in white, this is where the Purchase Zones faced Consolidation. When the Purchase Zones all get tight and close together like that, this may represent Volatility and Momentum in either direction may occur soon.
This was then followed by all 6 of the Standard Cipher Signals closely in succession to each other. This means the Momentum may be favoring the Bulls. If this was likewise all 6 of the Bearish Cipher Signals closely in succession, than the momentum change would favor the Bears.
If you were looking for an entry, and you saw Consolidation with the Purchase Zones and then shortly after you saw the Green Circle and Blue Flag (they can swap order); this may now be a good Entry location.
We will conclude this Tutorial here. Hopefully this has taught you how this Trend Analysis Toolkit may help you locate multiple different types of important Support and Resistance locations; as well as possible Entry and Exit locations.
Settings:
1. Bull/Bear Zones:
1.1. Purchase Speed (Bull/Bear Signals and Take Profit Signals):
Speed determines how much price movement is needed for a signal to occur.
'Sonic' uses the extremities to try and get you the best entry and exit points, but is so quick, its speed may reduce accuracy.
'Fast' may attempt to capitalize on price movements to help you get SOME or attempt to lose LITTLE quickly.
'Medium' may attempt to get you the most optimal entry and exit locations, but may miss extremities.
'Slow' may stay in trades until it is clear that momentum has changed.
'Snail' may stay in trades even if momentum has changed. Snail may only change when the price has moved significantly (This may result in BIG gains, but potentially also BIG losses).
1.2. Purchase Strength (Bull/Bear Signals and Take Profit Signals):
Strength ensures a certain amount of verifications required for signals to happen. The more verifications the more accurate that signal is, but it may also change entry and exit points, and you may miss out on some of the extremities. It is highly advised to find the best combination between Speed and Strength for the TimeFrame and Pair you are trading in, as all pairs and TimeFrames move differently.
'High' uses 15 verifications to ensure signal strength.
'Medium' uses 10 verifications to ensure signal strength.
'Low' uses 5 verifications to ensure signal strength.
'Very Low' uses 3 verifications to ensure signal strength.
2. Cipher Signals:
Cipher Signals are very strong EMA and SMA crosses, which may drastically help visualize movement and help you to predict where the price will go. All Symbols have counter opposites that cancel each other out (YinYang). Here is a list, in order of general appearance and strength:
White Cross / Diamond (Predictive): The initial indicator showing trend movement.
Green Cross / Diamond (Regular): Confirms the Predictive and may add a fair bit of strength to trend movement.
Blue Cross / Diamond (Confirming): Confirms the Regular, showing the trend might have some decent momentum now.
Green / Red X: Gives momentum to the current trend direction, possibly confirming the Confirming Cross/Diamond.
Blue / Orange Triangle: may confirm the X, Possible pump / dump of decent size may be coming soon.
Green / Red Circle: EITHER confirms the Triangle and may mean big pump / dump is potentially coming, OR it just hit its peak and signifies a potential reversal correction. PAY ATTENTION!
Green / Red Flag: Oddball that helps confirm trend movements on the short term.
Blue / Yellow Flag: Oddball that helps confirm trend movements on the medium term (Yin / Yang is the long term Oddball).
3. Bull/Bear Signals:
Bear and Bull signals are where the momentum has changed enough based on your Purchase Speed and Strength. They generally represent strong price movement in the direction of the signal, and may be more reliable on higher TimeFrames. Please don’t use JUST these signals for analysis, they are only meant to be a fraction of the important data you are using to make your technical analysis.
4. Take Profit Signals:
Take Profit signals are guidelines that momentum has started to change back and now may be a good time to take profit. Your Take Profit signals are based on your Take Profit Speed and Strength and may be adjusted to fit your trading style.
5. Information Tables:
Information tables display very important data and help to declutter the screen as they are much less intrusive compared to labels. Our Information tables display: Boom Meter, Purchase Strength of Bull/Bear Zones and Yin/Yang State.
Boom Meter: Uses over 50 different calculations to determine if the pair is currently 'Dumping' (0-29%), 'Consolidating' (30-70%), or 'Pumping' (71-100%).
Bull / Bear Strength: Shows the strength of the current Bull / Bear signal from 0-100% (Signals start at 100% and change when they hit 0%). The % it moves up or down is based on your 'Purchase Strength'.
Yin / Yang state: Is one of the strongest EMA/SMA crosses (long term Oddball) within this Indicator and may be a great indication of which way the price is moving. Do keep in mind if the price is consolidating when changing state, it may have the highest chance of switching back also. Once momentum kicks in and there is price movement the state may be confirmed. Refer to other Cipher Symbols, Extremes, Trend, BOLL, Boom %, Bull / Bear % and Bar colors when Bull / Bear Zones are consolidating and Yin / Yang State changes as this is a very strong indecision zone.
6. Bull / Bear Zones:
Our Bull / Bear zones are composed of 8 very important EMA lengths that may act as not only Support and Resistance, but they help to potentially display consolidation and momentum change. You can tell when they are getting tight and close together it may represent consolidation and when they start to flip over on each other it may represent a change in momentum.
7. MA Extremes:
Our MA Extremes may be 3 of the most important long term moving averages. They don’t always play a role in trades as sometimes they’re way off from the price (cause they’re extreme lengths), but when they are around price or they cross under or over each other, it may represent large changes in price are about to occur. They may be very useful for seeing strong resistance / support locations based on price averages. Extremes may transition from a Support to a Resistance based on its position above or below them and how many times the price has either bounced up off them (Supporting) or Bounced back down after hitting them (Resistance).
8. Pivots:
Pivots may be a very important indicator of support and resistance for horizontal price movement. Pivots may represent the current strongest Support and Resistance. When the Pivot changes, it means a new strong Support or Resistance has been created. Sometimes you'll notice the price constantly pushes the pivot during a massive Pump or Dump. This is normal, and may indicate high levels of volatility. This generally also happens when the price is outside of the Bollinger Bands and is also Over or Undervalued. The price usually consolidates for a while after something like this happens before more drastic movement may occur.
9. Trend Lines:
Trend lines may be one of the best indicators of support and resistance for diagonal price movement. When a Trend Line fails to hold it may be a strong indication of a dump. Keep a close eye to where Upward and Downward Trend Lines meet. Trend lines can create different trading formations known as Pennants, Flags and Wedges. Please familiarize yourself with these formations So you know what to look for.
10. Bollinger Bands (BOLL):
Bollinger Bands may be very useful, and ours have been customized so they may be even more accurate by using a modified calculation that also incorporates volume.
Bollinger Bands may be used to see Movement vs Consolidation Zones (When it’s wide vs narrow). It also may be very useful for seeing where the correction areas are likely to be. Price may bounce between top and bottom of the BOLL, unless perhaps in a pump or dump. The Boom Meter may show you whether it is currently: Dumping, Consolidation or Pumping, along with Boom Meter Bar Colors, may be a good indication if it will break the BOLL. The Middle Line of the BOLL (White Line) may be a very strong support / resistance line. If the price closes above or below it, it may be a good indication of the trend changing (it may be one of the first stages to a pump or dump).
11. Boom Meter Bar Colors:
Boom Meter bar colors may be very useful for seeing when the bar is Overbought or Underbought. There are 6 different types of boom meter bar colors, they are:
Dark Green: RSI may be very Overbought and price going UP (May be in a big pump. NOTICE, chance of small dump correction if Cherry Red bar appears).
Light Green: RSI may be slightly Overbought and price going UP (chance of small pump).
Light Purple: RSI may be very Underbought and price going UP (May have chance of small correction).
Dark Red: RSI may be very Underbought and price going DOWN (May be in a big dump. NOTICE, chance of small pump correction if Light Purple bar appears).
Light Orange: RSI may be slightly Underbought and price going DOWN (chance of small dump).
Cherry Red: RSI may be very Overbought and price going DOWN (Chance of small correction).
12. True Value Zone:
True Value Zones display zones that represent ranges to show what the price may truly belong within. They may be very useful for knowing if the Price is currently not valued correctly, which generally means a correction may happen soon. True Value Zones can swap from Bullish to Bearish and are represented by Red for Bearish and Green for Bullish. For example, if the price is ABOVE and OUTSIDE of the True Value Zone, this means it may be very overvalued and might correct to go back inside the True Value Zone. This correction may be done by either dumping in price back into the zone, or consolidating horizontally back into it over a longer period of time. Vice Versa is also true if it is BELOW and OUTSIDE of the True Value Zone.
13. Bar Strength Index:
Bar Strength Index may display how Bullish/Bearish the current bar is. The strength is important to help see if a pump may be losing momentum or vice versa if a dump may correct. Keep in mind, the Bar Strength Index does a small 'refresh' to account for new bars. It may help to keep the Index more accurate.
14. Volume Profile:
Volume Profiles may be important to know where the Horizontal Support/Resistance is in Price base on Volume. Our Volume Profile may identify the point where the most volume has occurred within the most relevant timeframe. Volume Profiles are helpful at identifying where Whales have their orders placed. The reason why they are so helpful at identifying whales is when the volume is profiled to a specific area, there may likely be lots of Limit Buy and/or Sells around there. Limit Buys may act as Support and Limit Sells may act as Resistance. It may be very useful to know where these lie within the price, similar to looking at Order Book Data for Whale locations.
If you have any questions, comments, ideas or concerns please don't hesitate to contact us.
HAPPY TRADING!

Breakout/Breakdown Indicator (30 Min Range) by InvestYourAsset👉The indicator provided here is a technical analysis indicator for TradingView users that identifies potential breakout and breakdown opportunities on the initial 30-minute range in every trading session.
👉The indicator high and low of the initial 30-minute period and plotting them as horizontal lines on the chart. The high is marked in green line and the low is marked in red line.
📈The indicator then generates buy and sell signals based on whether the current close price crosses above or below the previous 30-minute high and low, respectively.
📢The indicator also has two inputs:
👉 sessionStartHour : The hour at which the trading session begins. The default value is 9, However users can change the time according to their own trading style.
👉 sessionStartMinute : The minute at which the trading session begins. The default value is 0.
These inputs can be used to adjust the indicator to the specific trading session that you are interested in.
✅How to use the Indicator:
👉To use the 30 Minute Breakout/Breakdown Indicator, simply add it to your chart and configure the inputs to your liking. Once the indicator is added to the chart, it will plot the 30-minute high and low as horizontal lines, as well as generate buy and sell signals based on the current close price.
✅Here is a step-by-step guide:
📈Open TradingView and select the chart that you want to add the indicator to.
📈Click on the "Indicators" tab and search for "30 Minute Breakout/Breakdown Indicator by InvestYourAsset".
📈Click on the indicator to add it to your chart.
📈Configure the inputs to your liking. The default values are typically fine, but you can experiment with different values to see what works best for you.
📈Once you are satisfied with the settings, click on the "Apply" button.
📈The indicator will now be displayed on your chart. You will see two horizontal lines representing the previous 30-minute high and low, as well as triangles representing buy and sell signals.
✅How to interpret the signals:
📈Buy signal : A buy signal is generated when the current close price crosses above the previous 30-minute high. This suggests that the price is likely to continue moving higher in the short term.
📈Sell signal : A sell signal is generated when the current close price crosses below the previous 30-minute low. This suggests that the price is likely to continue moving lower in the short term.
👉Traders should remember that the present indicator is just one tool that can be used to identify potential trading opportunities. It is important to use other technical analysis tools and risk management techniques to confirm your trading signals before entering any trades.
✅Things to consider while using the indicator:
📈Look for buy signals in an uptrend and sell signals in a downtrend. This will increase the likelihood of your trades being successful.
📈Place your stop losses below the previous 30-minute low for buy signals and above the previous 30-minute high for sell signals. This will help to limit your losses if the trade goes against you.
📈Consider taking profits at key resistance and support levels. This will help you to lock in your profits and avoid giving them back to the market.
Follow us for timely updates regarding indicators that we may publish in future and give it a like if you appreciate the indicator.

VWAP with CharacterizationThis indicator is a visual representation of the VWAP (Volume Weighted Average Price), it calculates the weighted average price based on trading volume. Essentially, it provides a measure of the average price at which an asset has traded during a given period, but with a particular focus on trading volume. In our case, the indicator calculates the VWAP for the current trading symbol, using a predefined simple moving average (SMA) with a period of 14. This volume-weighted moving average offers a clearer view of the behavior of the VWAP and, of consequence of market dynamics.
One of the distinctive features of this indicator is its ability to provide a more "linear" representation of the data. This means that the data is "smoothed" to remove noise, allowing you to more easily identify the direction of the market trend. This smoother representation is especially useful because the financial market can be subject to significant fluctuations and volatility, and this indicator can help get a more stable view of the trend.
The indicator also offers a visualization of the market trend in a very intuitive way. Using an evaluation of the highs and lows of the last 10 days, determine whether the market is in an uptrend, downtrend, or no trend at all. To make this evaluation even clearer and more immediate, the indicator line is colored dynamically. When the trend is bullish, the line is blue, while in case of a bearish trend, it takes on a distinctive color, such as pink. If the trend is not defined, the line will be colored differently, for example light yellow. This coloration gives traders an immediate visual indication of the prevailing trend, allowing them to make more informed decisions regarding trading operations.
One potential strategy involves watching candles when they cross the VWAP line strongly. If, for example, a candlestick breaks above the VWAP line, we may look for retest areas near key support levels to gauge a potential long entry. In other words, we would consider that the price may have the potential to rise further after breaking above the VWAP line, and we would look to enter a long position to take advantage of this opportunity.
On the other hand, if a candlestick crosses below the VWAP line, we might consider looking for retest areas near the VWAP line itself, which now serves as potential resistance. This could indicate a possible short entry opportunity, as the price may struggle to break above the resistance represented by the VWAP line after breaking it down. In this case, we would look to take advantage of the expected continuation of the downtrend.
In both cases, the idea is to exploit significant movements across the VWAP line as signals of potential reversal or continuation of the trend. This strategy can help identify key entry points based on price behavior relative to the VWAP line.

DIY Custom Strategy Builder [ZP] - v1DISCLAIMER:
This indicator as my first ever Tradingview indicator, has been developed for my personal trading analysis, consolidating various powerful indicators that I frequently use. A number of the embedded indicators within this tool are the creations of esteemed Pine Script developers from the TradingView community. In recognition of their contributions, the names of these developers will be prominently displayed alongside the respective indicator names. My selection of these indicators is rooted in my own experience and reflects those that have proven most effective for me. Please note that the past performance of any trading system or methodology is not necessarily indicative of future results. Always conduct your own research and due diligence before using any indicator or tool.
===========================================================================
Introducing the ultimate all-in-one DIY strategy builder indicator, With over 30+ famous indicators (some with custom configuration/settings) indicators included, you now have the power to mix and match to create your own custom strategy for shorter time or longer time frames depending on your trading style. Say goodbye to cluttered charts and manual/visual confirmation of multiple indicators and hello to endless possibilities with this indicator.
What it does
==================
This indicator basically help users to do 2 things:
1) Strategy Builder
With more than 30 indicators available, you can select any combination you prefer and the indicator will generate buy and sell signals accordingly. Alternative to the time-consuming process of manually confirming signals from multiple indicators! This indicator streamlines the process by automatically printing buy and sell signals based on your chosen combination of indicators. No more staring at the screen for hours on end, simply set up alerts and let the indicator do the work for you.
Available indicators that you can choose to build your strategy, are coded to seamlessly print the BUY and SELL signal upon confirmation of all selected indicators:
EMA Filter
2 EMA Cross
3 EMA Cross
Range Filter (Guikroth)
SuperTrend
Ichimoku Cloud
SuperIchi (LuxAlgo)
B-Xtrender (QuantTherapy)
Bull Bear Power Trend (Dreadblitz)
VWAP
BB Oscillator (Veryfid)
Trend Meter (Lij_MC)
Chandelier Exit (Everget)
CCI
Awesome Oscillator
DMI ( Adx )
Parabolic SAR
Waddah Attar Explosion (Shayankm)
Volatility Oscillator (Veryfid)
Damiani Volatility ( DV ) (RichardoSantos)
Stochastic
RSI
MACD
SSL Channel (ErwinBeckers)
Schaff Trend Cycle ( STC ) (LazyBear)
Chaikin Money Flow
Volume
Wolfpack Id (Darrellfischer1)
QQE Mod (Mihkhel00)
Hull Suite (Insilico)
Vortex Indicator
2) Overlay Indicators
Access the full potential of this indicator using the SWITCH BOARD section! Here, you have the ability to turn on and plot up to 14 of the included indicators on your chart. Simply select from the following options:
EMA
Support/Resistance (HeWhoMustNotBeNamed)
Supply/ Demand Zone ( SMC ) (Pmgjiv)
Parabolic SAR
Ichimoku Cloud
Superichi (LuxAlgo)
SuperTrend
Range Filter (Guikroth)
Average True Range (ATR)
VWAP
Schaff Trend Cycle ( STC ) (LazyBear)
PVSRA (TradersReality)
Liquidity Zone/Vector Candle Zone (TradersReality)
Market Sessions (Aurocks_AIF)
How it does it
==================
To explain how this indictor generate signal or does what it does, its best to put in points.
I have coded the strategy for each of the indicator, for some of the indicator you will see the option to choose strategy variation, these variants are either famous among the traders or its the ones I found more accurate based on my usage. By coding the strategy I will have the BUY and SELL signal generated by each indicator in the backend.
Next, the indicator will identify your selected LEADING INDICATOR and the CONFIRMATION INDICATOR(s).
On each candle close, the indicator will check if the selected LEADING INDICATOR generates signal (long or short).
Once the leading indicator generates the signal, then the indicator will scan each of the selected CONFIRMATION INDICATORS on candle close to check if any of the CONFIRMATION INDICATOR generated signal (long or short).
Until this point, all the process is happening in the backend, the indicator will print LONG or SHORT signal on the chart ONLY if LEADING INDICATOR and all the selected CONFIRMATION INDICATORS generates signal on candle close. example for long signal, the LEADING INDICATOR and all selected CONFIRMATION INDICATORS must print long signal.
The dashboard table will show your selected LEADING and CONFIRMATION INDICATORS and if LEADING or the CONFIRMATION INDICATORS have generated signal. Signal generated by LEADING and CONFIRMATION indicator whether long or short, is indicated by tick icon ✔. and if any of the selected CONFIRMATION or LEADING indicator does not generate signal on candle close, it will be indicated with cross symbol ✖.
how to use this indicator
==============================
Using the indicator is pretty simple, but it depends on your goal, whether you want to use it for overlaying the available indicators or using it to build your strategy or for both.
To use for Building your strategy: Select your LEADING INDICATOR, and then select your CONFIRMATION INDICATOR(s). if on candle close all the indicators generate signal, then this indicator will print SHORT or LONG signal on the chart for your entry. There are plenty of indicators you can use to build your strategy, some indicators are best for longer time frame setups while others are responsive indicators that are best for short time frame.
To use for overlaying the indicators: Open the setting of this indicator and scroll to the SWITCHBOARD section, from there you can select which indicator you want to plot on the chart.
For each of the listed indicators, you have the flexibility to customize the settings and configurations to suit your preferences. simply open indicator setting and scroll down, you will find configuration for each of the indicators used.
I will also release the Strategy Backtester for this indicator soon.

Buy/Sell BoxThis indicator tries to identify the points where the price exceeds or falls below a rectangle based on the opening and closing prices of the previous period, the creation of the boxes occurs when a doji is detected therefore it will calculate the coordinates of the rectangle that will be drawn around it, therefore the indicator offers buy or sell signals based on this logic. Specifically, the buy signal is generated if the closing price is above the top of the rectangle and satisfies some previous price conditions while the sell signal is generated if the closing price is below the bottom of the rectangle and satisfies some conditions of previous prices within a further threshold based on the Ema 150.
Lines are then drawn on the graph to visually display the extreme price levels, which can be useful for any confirmation of buy and sell signals, Stop Loss and Take Profit, Trend Filter (to visually understand if the trend is bullish or bearish)
A potentially effective trading strategy could involve identifying buy and sell signals near the extreme price level lines drawn by the indicator. This approach can be used to try to improve the accuracy of your trading signals and make more informed decisions. For example:
When you receive a buy or sell signal based on the dojis and rectangles generated by the indicator, check whether the price is also near one of the extreme price level lines. If you are receiving a buy signal and notice that the current price is near a low of the lower level line, this may further confirm the buying opportunity, as the price is near a significant resistance level. On the contrary, if the sell signal was close to a maximum price level it could confirm an excellent short entry.
It is also possible to use the boxes as reference points to set the stop loss and take profit levels. If you are entering a buy position, you might consider setting your stop loss just below an upper line of the last box. Additionally, you may want to set your take profit near a higher price level if you are looking to maximize profits. This will help manage risks and protect your capital.

Auto Range [lovealgotrading]
OVERVIEW:
An indicator that automatically draws a range and generates signals according to changing market conditions. ( This indicator does not REPAINT )
ALGORITHM OF THE INDICATOR:
> When we examine the price, it generally moves in trend only 30 percent of the time and in consolidation 70 percent of the time.
> While the price is consolidating, it creates a range and continues to move within the range until this range is broken, BUT the market conditions are constantly changing and our range levels are expected to change with each new bar. I developed an indicator considering this situation.
> When Range Trading, we determine the high and low levels and we can open trades according to the price's reactions at these levels.
> However, after we draw a range, market conditions constantly change, and opening a transaction without taking into account the changing market conditions is an obstacle to our success.
IMPLEMENTATION DETAILS WITH EXAMPLE:
What kind of algorithm do I use to draw a range automatically?
For example, let's set the Number of line value to 4 and set our Period to 14.
1- Let our highest 4 values be = 100, 110, 120, 130, the average of these values is
2- (100+110+120+130)/4 = 115, in this case our Range High Value becomes 115.
3- Within the period we have determined (we have currently set 14, but you can change it), the price sees the highest level of 140.
4- In this case, our 4 largest levels = 110 120 130 140 and our average becomes (110 + 120 + 130 + 140) / 4 = 125 and the range high Our level changes automatically and becomes 125.
5- Let's take the example below, where we determine our 4 highs within the 14 bars we set and average them, if our high changes, our range high goes up.
>> I tried to draw the change with the red arrow
How does this situation appear on the indicator?
>>> Classic Range Trade and Auto Range Trade <<<
Classical Range Trade:
Auto Range Trade:
SETTINGS PANEL:
Which Signals Are More Important (Example Study)
If you have any ideas what to add to my work to add more sources or make calculations cooler, suggest in DM .

RSRS (Resistance Support Relative Strength)The Resistance Support Relative Strength (RSRS) indicator, published by Everbright Securities, is a technical analysis tool that enjoys immense popularity among Chinese quantitative traders, owing to its stellar performance in China's stock markets.
🟠 Principle
The indicator treats daily highs and lows as resistance and support levels respectively. It measures market strength by comparing the magnitude of price changes in daily highs versus lows. Specifically, it fits a linear regression model to the (low, high) data points over the past N days (typically 18) and uses the slope (beta) as the RSRS value. A steeper slope indicates stronger market strength.
🟠 Algorithm
1. Collect the daily low and high prices over the past N days.
2. Apply Ordinary Least Squares to estimate the linear regression model: high = alpha + beta * low. The beta is the RSRS value.
3. Compute the z-score of the RSRS over the past M days (typically 600).
4. Compare the z-score to preset buy and sell thresholds (typically 0.7 and -0.7) to generate trading signals. If z-score > buy threshold, a buy signal is triggered. If z-score < sell threshold, a sell signal is triggered.

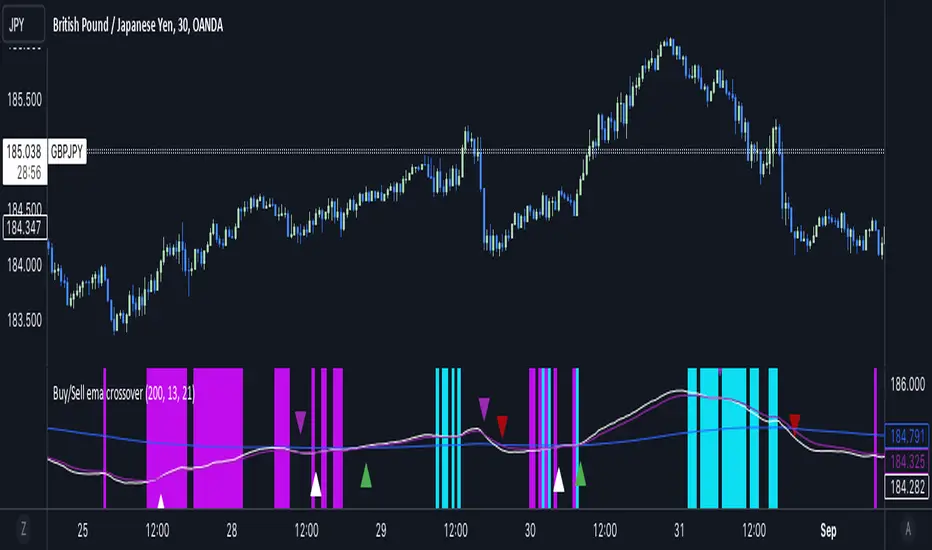
Buy/Sell EMA CrossoverThe indicator identifies potential trading opportunities within the market. It is entirely based on the combination of exponential moving averages by drawing triangles on the chart that identify buy or sell signals combined with vertical bars that create areas of interest.
Specifically, when a buy signal occurs, the indicator draws a vertical bar with an azure background, indicating a possible buy area. Similarly, a sell signal is represented by a vertical bar with a fuchsia background, indicating a possible sell area.
These areas represent the main point of the indicator which uses exponential moving averages which, based on the direction of prices, identify the trend and color the background of the graph in order to visually highlight the predominant trend.
The green triangles above the bars of the chart suggest possible upside opportunities (good bullish entry points) when the 21 ema crosses the 200 ema.
While on the contrary the red triangles, 21 ema lower than the 200 ema, can indicate possible bearish trends (good bearish entry points).
While the white and purple triangles reveal moments of potential indecision or market change.
We can think of them as situations of uncertain trend in which it is possible to place a long or short order near some conditions that we are going to see.
The white triangles below, which are created when the 13 ema is higher than the 21 ema, indicate a possible bullish zone while the purple triangles above (13 ema lower than the 21) could suggest a bearish reflex
Colored lines represent moving averages blue = 200, 21= fuchsia and 13 = white. If the price is above the 200 period line then it could be a bullish opportunity, otherwise it could be a bearish one.
An interesting strategy to adopt is to evaluate, for example, the inputs near the vertical bars (azure - long) (fuchsia - short) when a white or purple triangle appears.
The more prominent green triangle indicates that the trend is going in a long direction.
On the contrary, the red (short) triangles are the opposite of the green ones and have the same importance as input logic.
The white triangle instead present more often inside the indicator identifies interesting buying areas of short duration, it is important to consider that the closer the triangles are to the vertical blue bars the stronger the entry signal.
Finally, the purple triangles are the short-term bearish trends whose entry near the fuchsia vertical bars defines a short.
Smoothing ATR bandThere are two bands calculated with the ATR and I added "Smoothing" into the script.
Smoothing ATR with multiplier can display two bands above and below the price.
We can ONLY find some ATR bands in Community Scripts with "Basic" setting which is used to set Stop Loss.
And yet , Smoothing ATR with multiplier is capable of making traders manifestly recognize OverBought & OverSold.
FurtherMore, I added a condition with "plotshape", which is "Stop Hunt"
Stop Hunt is an absolutely usual strategy to clean the leverage and it always makes high volatility moves.
When high> above band and close< above band , long signal, it means it had been abundantly bought but the larger traders weren't satisfied; therefore, they quickly sold out to lower the price. The sell condition is on the contrary.
The signals mainly make traders manifestly recognize OverBought & OverSold.

Buy/Sell EMA CandleThis indicator is designed to display various technical indicators, candle patterns, and trend directions on a price chart. Let's break down the code and explain its different sections:
Exponential Moving Averages (EMA):
The code calculates and plots five EMAs of different lengths (13, 21, 55, 90, and 200) on the price chart. These EMAs are used to identify trends and potential crossovers.
Engulfing Candle Patterns:
The code identifies and highlights potential bullish and bearish engulfing candle patterns. It checks if the current candle's body size is larger than the combined body sizes of the previous and subsequent four candles. If this condition is met, it marks the pattern on the chart.
s3.tradingview.com
EMA Crossovers:
The code identifies and highlights points where the shorter EMA (ema1) crosses above or below the longer EMA (ema2). It plots circles to indicate these crossover points.
Candle Direction and RSI Trend:
The code determines the trend direction of the last candle based on whether it closed higher or lower than its open price. It also calculates the RSI (Relative Strength Index) and determines its trend direction (overbought, oversold, or neutral) based on predefined thresholds.
s3.tradingview.com
Table Display:
The code creates a table displaying trend directions for different timeframes (monthly, weekly, daily, 4-hour, and 1-hour) for candle direction and RSI trends. The trends are labeled with "L" for long, "S" for short, and "N/A" for not applicable.
High Volume Bars (HVB):
The code identifies and colors bars with above-average volume as either bullish or bearish based on whether the price closed higher or lower than it opened. The color and conditions for high volume bars can be customized.
s3.tradingview.com
Doji Candle Pattern:
The code identifies and marks doji candle patterns, where the open and close prices are very close to each other within a certain percentage of the candle's high-low range.
RSI-Based Candle Coloring:
The code adjusts the color of the candles based on the RSI value. If the RSI value is above the overbought threshold or below the oversold threshold, the candles are colored yellow.
Usage and Interpretation:
Traders can use this indicator to identify potential trend changes based on EMA crossovers and candle patterns like engulfing and doji.
The RSI trend direction can provide additional insight into potential overbought or oversold conditions.
High volume bars can indicate potential price reversals or continuation patterns.
The table provides an overview of trend directions on different timeframes for both candle direction and RSI trends.
Keep in mind that this is a complex indicator with multiple features. Users should carefully evaluate its performance and consider combining it with other indicators and analysis methods for more accurate trading decisions.
The table is designed to provide a consolidated view of trend directions and other indicators across multiple timeframes. It is displayed on the chart and organized into rows and columns. Each row corresponds to a specific aspect of analysis, and each column corresponds to a different timeframe.
Here's a breakdown of the components of the table:
Row 1: Separation.
Row 2 (Header Row): This row contains the headers for the columns. The headers represent the different timeframes being analyzed, such as Monthly (M), Weekly (W), Daily (D), 4-hour (4h), and 1-hour (1h).
Row 3 (Content Row): This row contains labels indicating the types of information being displayed in the columns. The labels include "T" for Trend, "C" for Current Candle, and "R" for RSI Trend.
Row 4 and Onwards: These rows display the actual data for each aspect of analysis across different timeframes.
For each aspect of analysis (Trend, Current Candle, RSI Trend), the corresponding rows display the following information:
Monthly (M): The trend direction for the given aspect on the monthly timeframe.
Weekly (W): The trend direction for the given aspect on the weekly timeframe.
Daily (D): The trend direction for the given aspect on the daily timeframe.
4-hour (4h): The trend direction for the given aspect on the 4-hour timeframe.
1-hour (1h): The trend direction for the given aspect on the 1-hour timeframe.
The trend directions are represented by labels such as "L" for Long, "S" for Short, or "N/A" for Not Applicable.
The table's purpose is to provide a quick overview of trend directions and related information across multiple timeframes, aiding traders in making informed decisions based on the analysis of trend changes and other indicators.

Extreme Entry with Mean Reversion and Trend FilterThis non-repainting indicator is an improved version of my previous work, a more versatile tool designed to provide traders with dynamic and adaptive entry signals while incorporating a mean reversion and trend filtering mechanism. By combining RSI overbought/oversold, regular divergence and confirmatory momentum oscillator such as CCI or MOM, this indicator generates more precise and timely signals for entering trades.
The indicator offers a comprehensive set of entry conditions for both Buy and Sell entries:
• For Buy entries, it checks for oversold conditions based on RSI levels, and detects bullish divergence patterns while oversold and it identifies upward crossovers in the selected entry signal source (CCI or Momentum).
• Similarly, for Sell entries, it identifies downward crossovers of the CCI or Mom, after the recent overbought conditions, and bearish divergence patterns inside the overbought RSI.
To refine the entry signals even further, the indicator utilizes a mean reversion filter. Traders can choose to display signals that occur inside or outside the upper and lower mean reversion bands:
• Range Entries are indicating potential buying opportunities near the lower band and selling opportunities near the upper band. This is based on the concept of mean reversion, which suggests that prices tend to return to the average when they reach the upper or lower bands. By focusing on these signals, traders can take advantage of price movements that have a higher probability of reversing towards the mean.
• Extreme Entries, on the other hand, represent signals that occur outside of the bands, signaling potential pullbacks during strong trends. By entering positions only at extreme highs or lows, traders can avoid getting caught in the middle of the trend. This approach helps traders capitalize more favorable trading opportunities which have a high reward-risk ratio.
Trend Filter acts as a directional bias for the entry signals. When enabled, long and short entry conditions are filtered based on the relationship between the closing price and the EMA.
Traders have the flexibility to customize, tweak the indicator filter and values in the settings according to their preferences strategies and traded assets, tailoring the signals to their specific needs. The script sets alert conditions to trigger alerts for buy, sell, or both entry signals. This indicator can be used in conjunction with price action or other technical analysis tools for confirmation and better trading decisions.
I created this indicator for my own use, and I share this for informational purposes only. It does not constitute financial advice so use at your own risk and consider your financial situation before making any trading decisions. The indicator's accuracy is not guaranteed, and past performance is not indicative of future results.
I appreciate your feedback on this indicator. As I am new to script development, I am open to comments and suggestions to improve it. If you encounter any issues while using this indicator, please let me know in the comments section. If you find it helpful, I kindly ask for your support in boosting it. Thank you for your cooperation.

ProfitAlgoOverview
ProfitAlgo is a powerful and intuitive trading tool specifically developed to cater to the requirements of both beginners and experienced traders. It is designed to function in every timeframe and on all cryptocurrencies, stocks, indices, forex, futures, currencies, ETF's, energy and commodities. This innovative tool provides real-time signals, comprehensive trend analysis, and advanced risk management features, making it an indispensable asset for traders of all levels. This cutting-edge tool generates 'BUY' and 'SELL' signals, complemented by an array of robust analytical tools. Empower your trading analysis with this all-in-one solution and add to your arsenal of indicators to make well-informed decisions.
This algorithm incorporates a sophisticated Fourier smoothing technique to effectively filter price data, reduce noise and reveal underlying patterns and trends. By utilizing multiple price series data and incorporating Price Volume Trend, it leverages volume analysis and price movement patterns. Furthermore, the algorithm employs relative and simple moving average calculations to enhance signal clarity and filter out outliers, resulting in a more refined and robust indicator.
Features
Buy/Sell signals: Visually illustrated by 'BUY' and 'SELL' labels, these signals provide indications to traders about optimal times to enter or exit positions in the market based on the particular asset they are trading. Traders may want to enter long positions when buy signals appear, and enter short positions when 'SELL' signals appear.
Stop Loss/Take Profit Levels: Stop loss and take profit levels are predefined price thresholds that allow traders to automatically exit trades to limit losses or secure profits, respectively. Stop loss and take profit levels are visually depicted through three dotted lines on the trading chart, including the entry price, take profit (TP), and stop loss (SL). Additionally, a table displays the corresponding price entries for all three levels, providing a comprehensive overview of the trade. Traders can effectively manage their risk and optimize their trading by implementing predefined threshold settings and establishing take profit levels, thus safeguarding their profits using a strategic approach.
Support and Resistance Levels: Support and resistance levels are key price levels in the market that act as barriers or turning points for the price movement of an asset. Traders utilize these levels to identify potential areas of buying and selling opportunities. These can be depicted as red (resistance) and green (support) horizontal lines. These levels can serve as valuable complements to stop/loss and take profit levels, providing confirmation for profit-taking opportunities and facilitating effective risk management. Moreover, they can synergistically work alongside the price lines to identify potential reversal zones by visualizing market highs/lows in conjunction with areas of supply & demand.
Moving Average Bands: Moving average bands, plotted alongside the price data, dynamically change color based on the prevailing trend, with red indicating a downtrend and green representing an uptrend. This visual tool provides valuable insights to users, allowing them to quickly identify and interpret market trends. Integrating Moving Average bands with our buy/sell signals offers added confidence in identifying market trends, enabling traders to seek validation and enhance their decision-making process.
Trend Table: The trend table provides real-time information on the current trend of an asset, displaying three distinct outputs: "Uptrend," "Downtrend," and "Ranging Trend." This valuable tool enables users to assess the live trend of an asset, which may differ from the buy/sell signals. The primary objective of this feature is to analyze real-time trends in both ranging and trending market conditions. While the current signal may indicate a 'BUY' signal, the table can present an alternative output, providing valuable insights for traders and investors.
Price Lines: Price lines are depicted as two parallel grey lines running alongside the price data, representing the highs and lows of the market. This visual tool is utilized to identify patterns of higher highs and lower lows, enabling traders to gain insights into the overall trend and potential reversals in the market. When used in conjunction with our signals, MA bands and trend table, it may reinforce your interpretation of the underlying trend as well as provide insights into the trend strength.
*Note: These features are customizable via the settings menu in TradingView.
Calculations
How are buy/sell signals calculated?
The buy and sell signals are generated through a comprehensive calculation process that encompasses various types of analysis techniques. With permission from the author, wbburgin's Fourier transform is utilized to filter and extract relevant information from the price data, removing noise from the signals (filter is only applied in this feature). The buy and sell conditions are calculated based on a combination of volume-based analysis, and price movement patterns, employed to assess the direction and strength of market trends. The combination aims to produce a comprehensive view of both volume-based and price-based market dynamics. By integrating these analysis techniques, traders can gain insights into the relationship between volume, price, and market trends. This combined approach, as well as Fourier smoothing, can help identify potential market reversals, confirm trend strength, produce less noisy data and provide additional confirmation signals for trading decisions. By considering the insights provided by this analysis, the algorithm determines the appropriate actions, signaling the opportunities to enter or exit positions in the market. In summary, these calculations aim to identify favorable trading opportunities by considering factors such as trend strength, volume dynamics, and price patterns, ultimately assisting traders in making well-informed decisions in the market.
How are stop/loss and take/profit levels calculated?
The stop loss and take profit levels are calculated using a combination of technical factors, including the Average True Range (ATR) and Exponential Moving Average (EMA). The rationale for this combination is to enable dynamic risk management and align profit targets with the prevailing market conditions; ATR provides a measure of volatility and risk, while EMA helps identify the underlying trend, allowing for effective stop-loss and take-profit placement. These indicators are utilized to gauge market volatility and determine suitable levels for managing risk and securing potential profits. By incorporating ATR and EMA calculations, the algorithm generates dynamic stop loss and take profit levels that adapt to market conditions.
Calculating support and resistance levels
These levels help identify areas where the price tends to find support (support levels) or encounter resistance (resistance levels). This script utilizes pivot point calculations to determine these significant price levels, which can assist traders in trading decisions regarding potential price reversals, trend continuations, and entry/exit points in their strategies.
What are the moving average bands based on?
The moving average bands, based on VWMA (Volume Weighted Moving Average) calculations using OHLC4 price data, are visualized as unique bands on the chart. VWMA bands are chosen to find trends because they effectively combine volume-weighted calculations with moving averages, providing valuable insights into the strength and direction of price movements. These bands dynamically change color to reflect the prevailing trend. In an uptrend, the bands are represented by a green color, while in a downtrend, they appear in red. The VWMA bands utilize a unique counting method to capture trend movements and potential reversals.
How is the Trend Table calculated?
The underlying trends in the trend table are calculated based on counting methods applied to the VWMA bands. It utilizes specific thresholds to determine different trends, such as "Up Trend," "Down Trend," and "Ranging Trend." These thresholds are used to assess the current trend of the asset and provide valuable insights for traders.
Price Lines Calculation
The price lines are calculated based on the price data. They represent the range of prices, with one line plotted above the closing price and another line plotted below it. The space between these lines is filled to visualize the price volatility. Traders can utilize these lines to identify significant price levels and observe the overall price movement.
Disclaimer:
The information provided in my indicators/strategies/systems is not intended as financial advice. I assume no responsibility for any losses or damages, including loss of profits, resulting from the use of or reliance on such information.
All investments carry risks, and past performance of a security, industry, sector, market, financial product, trading strategy, backtest, or individual's trading does not guarantee future results or returns. Investors bear full responsibility for their investment decisions, which should be based on their own evaluation of financial circumstances, investment objectives, risk tolerance, and liquidity requirements.
Please note that my indicators/strategies/systems are solely for educational purposes! DO NOT request access in the comment's section.

[UPRIGHT Trading] Academy of Forex - Scalp Strategy█ OVERVIEW
This is a collaboration of efforts of The Academy of Forex and UPRIGHT Trading .
The Academy of Forex - Scalp Strategy Indicator is a clean & reimagined lower indicator. To enable optimization & potential automation, we re-coded & optimized it at UPRIGHT Trading.
It is based on the one presented on its YT channel.
The idea is for it to be an easy to use - simple indicator - that works not just for confirmation, but also entering and exiting quickly (scalping).
█ CONCEPTS
The idea is that %B (derived from BBs) is able to pick up some pretty significant moves. With that as one of the bases the Inverse Fisher Transform (Ribbon) acts to show some of the movement of the asset highlighting when it at extremes. The RSI highlights are there as another confirmation to help normalize the sometimes too frequent movement of %B.
As expected the indicator often acts as a reversal indicator, but with the optimizations of logic it's able to pick up more than just the reversals and works as a pretty decent Buy/Sell Algorithm.
█ CALCULATIONS
Calculations used included, but not limited to:
- %B - Quantifies the price as a percentage to the Upper and Lower Band of the Popular Bollinger Bands, which were named after their inventor John Bollinger in 1980.
- Inverse Fisher Transform RSI - is a variation of the IFT, created by John Ehlers, the idea is for the IFT to convert Gaussian normal distribution and to take it a step further the RSI version is to just use overbought and oversold placements. This indicator is meant to highlight when price has moved to an extreme and in this process helps to spot turning points.
- Relative Strength Index (RSI) - As most of you know already the RSI is a technical analysis tool invented by J. Welles Wilder, that oscillates and is used to measure the momentum of price changes. It normalizes to index 0-100 with overbought and oversold defined by the user, but often around 70 as overbought and 30 as oversold.
- Pivot/Swing Points - Implemented to show recent Higher-Highs or Lower-Lows, Pivot points are included in the indicator for structure tracking.
- Moving Averages - Moving averages help to get an idea of when price is moving near the norm or outside to extremes.
█ FEATURES
Indicator Features:
-2 Buy/Sell Signals.
-U Signals (UPRIGHT optimized).
-Exit Reminders.
-Alerts allowing Automation of Scalp Strategy.
-H/L Swings.
-Color Customization.
-Clean Mode.
-Inverse Fisher Transform Ribbon.
-RSI Bullish/Bearish Highlights.
-Options for More Signals (including: Oversold/Overbought Circles, %B Bull/Bear Squares and Triangles, and IFT Highlights).
Showing some of the signals close up.
Should look like this:
Enjoy!
Sincerely,
Mike
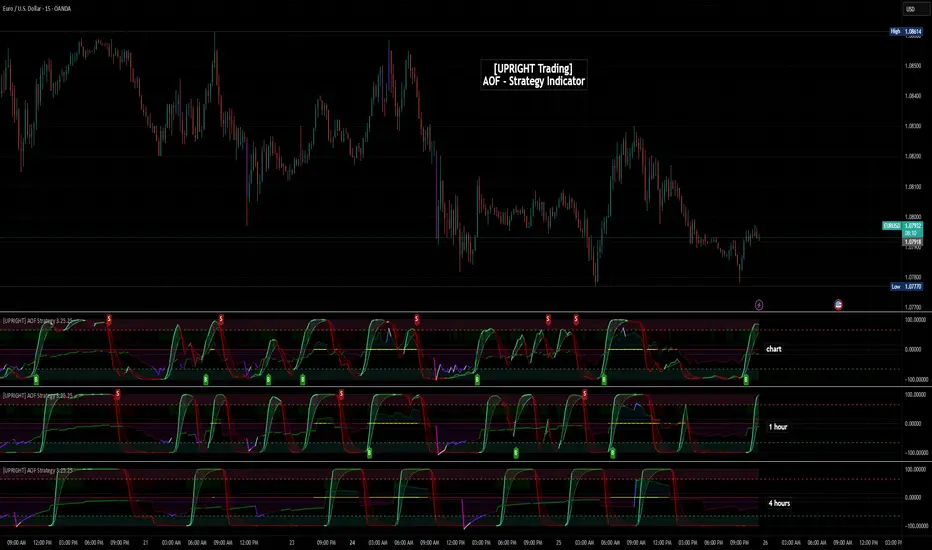
Edri Extreme Points Buy & SellEDRI EXTREME POINTS BUY & SELL INDICATOR
This Buy and Sell (non-repainting) indicator uses signals based on the combined CCI/Momentum and RSI indicators and optional regular divergence.
The idea of the indicator is to look for a potential reversal after the price reached extreme points (overbought or oversold) and signals an entry when the price shows signs of momentum for reversal.
Optionally, it considers finding a divergence while RSI is at the extreme levels to improve the predictability of a possible reversal.
Additionally, the indicator includes a simple Mean Reversion visual on the chart to assist users in identifying extreme price levels and potential reversal opportunities. It features upper and lower bands that can be optionally plotted, showing calculated values where price bounces at those extreme levels.
The purpose of these bands is to help traders avoid getting trapped in the middle of a trend and to guide them to buy low and sell high. (It's important to note that this is purely a visual aid and does not impact the generation of trade signals.)
By utilizing the Mean Reversion bands alongside the entry conditions, traders can gain insights into potential price reversals and make more informed decisions about when to enter or exit trades.
Buy and Sell Entry conditions:
• The indicator looks at the CCI/Momentum indicator to turn positive (if buy) or negative (if sell) after the RSI was overbought or oversold in the recent past.
• It also checks if there is a 3-period regular bullish divergence in the RSI (if buy), or regular bearish divergence (if sell) and consider these in the entry condition.
• If these conditions are met, this indicator suggests that it may be a good time to enter a trade.
In summary this is how this indicator works:
• The indicator takes input settings such as the choice between using CCI or Momentum as the entry signal source, length parameters for CCI/Momentum, RSI levels for overbought and oversold conditions, RSI length, and options to plot mean reversion bands on the chart.
• It calculates the CCI and Momentum and RSI values based on user-defined length..
• It checks for regular bullish and bearish divergences (3 periods) in the RSI if the option is enabled.
• The script plots shapes on the chart to indicate the buy and sell signals based on the entry conditions.
• If the mean reversion bands option is enabled, it calculates the mean reversion, standard deviation, upper band, and lower band values.
• It also plots the upper band, mean reversion line, and lower band on the chart if the mean reversion bands option is enabled.
• This indicator includes alert conditions to generate alerts for the buy and sell signals.
• On top of that, users can opt to use only one alert for both buy and sell signals. (This can save Trading view subscribers with limited alerts.)
Important! Please do not consider everything you read here as financial advice. Additionally, do not rely solely on indicators for making your trading decisions. It is important to note that no indicator or strategy is perfect. Therefore, it is always recommended to backtest everything and practice proper risk management.
I appreciate your feedback on this indicator. As I am new to script development, I am open to comments and suggestions to improve it. If you encounter any issues while using this indicator, please let me know in the comments section. If you find it helpful, I kindly ask for your support in boosting it. Thank you for your cooperation.

Advanced Exponential Smoothing Indicator (AESI) [AstrideUnicorn]The Advanced Exponential Smoothing Indicator (AESI) provides a smoothed representation of price data using the exponential smoothing technique. It helps traders identify the overall trend and potential reversal points in the market.
SETTINGS
Length: The number of periods used for the calculation of the exponential moving average (EMA). Higher values provide a smoother result but may lag behind price movements.
Alpha: The smoothing factor that determines the weight of the recent price data in the smoothing calculation. Higher values give more weight to recent data, resulting in a more responsive indicator.
Cloud Mode: Determines whether to display a cloud between the AESI line and the EMA line. When enabled, the cloud represents bullish (green) and bearish (red) market conditions.
HOW TO USE
The AESI indicator consists of a single line that represents the advanced exponential smoothing of the price data. It aims to provide a smoother version of the price series, reducing noise and revealing the underlying trend.
Bullish Condition: When the AESI line is above the EMA line, it indicates a bullish market condition. Traders may consider looking for buying opportunities or holding onto existing long positions.
Bearish Condition: When the AESI line is below the EMA line, it suggests a bearish market condition. Traders may consider looking for selling opportunities or holding onto existing short positions.
Optional Cloud Mode:
Enabling the cloud mode allows you to visualize bullish and bearish market conditions more clearly. The cloud appears between the AESI line and the EMA line, providing a visual representation of the prevailing market sentiment.
Bullish Cloud: When the AESI line is above the EMA line, the cloud is green, indicating a potential bullish market condition.
Bearish Cloud: When the AESI line is below the EMA line, the cloud is red, indicating a potential bearish market condition.
Note: The AESI indicator is most effective when used in conjunction with other technical analysis tools and indicators to confirm trading signals and make informed trading decisions.
Adjusting the Parameters:
You can adjust the Length and Alpha parameters to find the best ones for different timeframes and market conditions. Experimenting with different parameter values can help you find the optimal settings for your trading strategy.
It is recommended to backtest the AESI indicator on historical price data and evaluate its performance before using it in live trading. Remember that no indicator can guarantee profitable trades, and it is important to use risk management techniques and exercise caution when making trading decisions.
BBO-ALPHA-PHANTOMHello friends, this is the second time I am publishing this script, hopefully the description will be sufficient and you can use it reliably.
Script Description:
The script consists of several indicators and generates buy and sell signals based on their calculations. Here's a breakdown of the functions and indicators used in the script:
Moving Average Convergence Divergence (MACD):
Fast Length: The number of periods used for calculating the fast moving average.
Slow Length: The number of periods used for calculating the slow moving average.
Source: The price source used for calculations (default is the closing price).
Signal Smoothing: The number of periods used for smoothing the signal line.
Oscillator MA Type: The type of moving average used for the oscillator line (default is Exponential Moving Average).
Signal Line MA Type: The type of moving average used for the signal line (default is Exponential Moving Average).
Benefit: MACD is a trend-following momentum indicator that helps identify potential trend reversals, bullish or bearish market conditions, and generate buy and sell signals based on the crossovers of the oscillator and signal lines.
Relative Strength Index (RSI):
RSI Length: The number of periods used for calculating RSI.
RSI Source: The price source used for RSI calculations (default is (high + low + close) / 3).
MA Type: The type of moving average used for smoothing RSI values (default is Simple Moving Average).
MA Length: The number of periods used for smoothing RSI values.
Benefit: RSI is a momentum oscillator that measures the speed and change of price movements. It helps identify overbought and oversold conditions, potential trend reversals, and generate buy and sell signals based on the crossovers of RSI and its moving average.
Money Flow Index (MFI):
MFI Length: The number of periods used for calculating MFI.
Source: The price source used for MFI calculations (default is (high + low + close) / 3).
Benefit: MFI is a momentum indicator that uses both price and volume data to measure buying and selling pressure. It helps identify overbought and oversold conditions and potential trend reversals.
Directional Movement Index (DMI):
Signal Length: The number of periods used for smoothing the ADX line.
Length: The number of periods used for calculating DMI.
Benefit: DMI consists of three lines: ADX, +DI (Plus Directional Indicator), and -DI (Minus Directional Indicator). ADX measures the strength of a trend, while +DI and -DI indicate the direction of the trend. DMI helps identify trend strength, trend direction, and potential trend reversals.
Stochastic Oscillator:
SmoothK: The number of periods used for smoothing %K line.
SmoothD: The number of periods used for smoothing %D line.
Length RSI: The number of periods used for calculating RSI within Stochastic.
Length Stoch: The number of periods used for calculating Stochastic.
Benefit: Stochastic Oscillator is a momentum indicator that compares the closing price of an asset to its price range over a specific period. It helps identify overbought and oversold conditions and potential trend reversals.
Moving Averages (MA):
MA50: Simple Moving Average with a length of 50 periods.
MA200: Simple Moving Average with a length of 200 periods.
Benefit: Moving averages are commonly used to
Advantages of the script compared to common indicators:
Comprehensive analysis: The script combines several indicators such as MACD, RSI, MFI, DMI, Stochastic Oscillator and Moving Averages. It thus provides a broader and more comprehensive view of the market and its development.
Synergy of indicators: Using multiple indicators increases the reliability and confirmation of signals. Combining different indicators can provide potentially stronger and more accurate signals of a trend change.
Identifying Oversold and Overbought Levels: RSI, MFI and Stochastic Oscillator are used to identify oversold and overbought levels in the market. This can help uncover opportunities to buy or sell in line with these levels.
Identifying trends and their strength: DMI and Moving Averages help identify trends in the market and provide information about their strength. This can help traders in deciding the appropriate time to enter and exit the market.
Early signal generation: The script generates signals based on a combination of various indicators, which can help traders identify potential trading opportunities at an early stage.
The main thing for me is that it helps me from overtrading, I only trade when I get an alert or see it on the chart. I recommend
I find it best to trade in the 1h and 2h time frame. The shorter ones like 15min and 30min are perfect for me to get out of the position.
It is important to note that no indicator guarantees 100% accuracy in generating signals and trading on financial

Buy/Sell Toolkit (Expo)█ Overview
The Buy/Sell Toolkit is a comprehensive trading tool designed to provide a holistic approach to trading. It brings together essential trading indicators and features in one place, simplifying the trading process and offering valuable insights into the market.
The indicator serves as an all-inclusive solution for traders seeking in-depth technical insights. While the Buy/Sell Toolkit can be utilized alongside other technical analysis methods, it can also be used as a standalone toolkit, adaptable to any trading style. In addition, each feature is thoughtfully integrated because not all technical indicators are suitable for every market condition or trading style.
The Buy/Sell toolkit works in any market and timeframe for discretionary analysis and includes many features:
█ Features
Buy/Sell signals: This feature provides real-time Buy/Sell trading signals for any market and timeframe. These signals are based on the trend.
Contrarian Signals: This feature provides real-time contrarian signals to take a position against the prevailing market trend.
Ultimate Trend: This feature assists in identifying the overall trend of the market, recognizing whether the market is in an uptrend, downtrend, or sideways.
Trend Advisor: The Trend Advisor helps traders understand the trend's strength, duration, and direction.
Trend Reversal: This feature identifies potential points where the current market may reverse within a trend. It's basically a trend-following line based on reversal calculation; it helps traders catch trend continuation setups.
Momentum Average: This indicator measures the rate of change in prices to identify the strength of the current trend. It can be beneficial for spotting potential price breakouts or warning of a market slowdown and pullbacks.
Take Profit Points: This feature suggests optimal points to exit a trade and lock in profits. It determines these points by using various factors such as volatility, support and resistance levels, and historical price movements.
Candle Coloring, Arithmetic Candlesticks, including Arithmetic Heikin Ashi: This feature provides an excellent visual aid to assist traders in recognizing patterns, identifying trends, and optimizing their trading strategies. The Arithmetic Candlesticks help smooth out price volatility and identify market trends more clearly.
Reversal Cloud: This innovative feature provides a graphical representation of potential price reversal zones. The cloud helps traders visualize where the price might reverse its trend.
Trend Cloud: Similar to the Reversal Cloud, this feature visualizes the prevailing market trend, making it easy for traders to understand the direction of the market at a glance.
Signal Optimizer: The Signal Optimizer is a powerful tool that optimizes the Buy/Sell and contrarian signals based on win-rate or performance. It automatically applies the best settings to the signals, freeing traders from the task of constantly adjusting them. This helps traders to get the most reliable signals automatically, enhancing their trading efficiency.
█ How to use the Buy/Sell Toolkit?
Here are a few illustrative examples to provide traders with a better understanding of the Toolkit's practical usage. These examples showcase the combination of features, but it's important to note that they serve as demonstrations, and we encourage traders to explore and adapt the features to align with their unique trading styles.
Buy/Sell Signals & Take Profit
Optimized Buy/Sell signals & Candle Color + Trend Advisor + Reversal Cloud
Contrarian Signals & Take Profit
,with Reversal Cloud
Optimized Contrarian Signals & Ultimate Trend & Reversal Cloud
Trend Cloud
Filter signals with Trend Cloud
█ Why is this Buy/Sell Toolkit Needed?
The Buy/Sell Toolkit is an exceptional tool for traders because it consolidates several critical trading indicators into a single, user-friendly platform. The Toolkit's holistic approach to market analysis can enhance decision-making, reduce guesswork, and improve overall trading performance. Additionally, it allows traders to customize their approach according to the market conditions and their trading style.
The Toolkit's automated features, such as the Signal Optimizer, save time and effort, making it easier for both new and experienced traders. In addition, its comprehensive suite of features ensures traders have all the information they need to make informed trading decisions. All these features make the Buy/Sell Toolkit a powerful ally in any trader's arsenal.
Here's why this Toolkit is essential:
Comprehensive Market Analysis: The Toolkit offers a wide range of indicators and tools for comprehensive market analysis, from trend detection to momentum analysis. This reduces the need for multiple tools and allows for a more efficient trading process. By providing a host of indicators like Buy/Sell signals, Contrarian Signals, Trend Analysis, and Momentum Average, the Toolkit helps traders make well-informed decisions based on comprehensive data and trend analysis.
Automation and Time-Saving: The Signal Optimizer automatically applies the best settings to the signals based on win rate or performance. This saves time and ensures the signals' reliability, reducing, it makes the trading process efficient and hassle-free.
Versatility: The Toolkit is versatile and can be used for various financial markets, including stocks, forex, commodities, or cryptocurrencies. Regardless of the market you trade in, the Buy/Sell Toolkit has something to offer.
Visual Tools: The Toolkit provides visual tools like Reversal Cloud, Trend Cloud, Trend lines, Candle coloring, and much more, which are excellent for visualizing market trends and potential reversal zones. This can make the process of understanding market movements more intuitive and less intimidating, especially for novice traders.
Confirmation: By using multiple indicators in conjunction with each other, traders can confirm signals and improve the accuracy of their trades.
Learning and Development: The Toolkit serves as an excellent resource for both novice and experienced traders to learn about different trading indicators, how they interact, and how to use them effectively.
█ Any Alert Function Call
This function allows traders to combine any feature and create customized alerts. These alerts can be set for various conditions and customized according to the trader's strategy or preferences.
█ How are the features calculated? - Overview
The Toolkit combines many of our existing premium indicators and new technical analysis algorithms to analyze the market. This overview covers how the main features are calculated.
Buy/Sell
The core function calculates the Exponential Weighting for a given time series X over a period T. The time series is based on absolute price changes. It focuses on the magnitude of price changes from one period to the next, irrespective of the direction (up or down). This type of time series can be used to measure the volatility of a price series, as it quantifies the size of price movements. It's useful in scenarios where the direction of the change is not as important as the magnitude of the change.
Contrarian Signals
Our contrarian signals are based on deviation from the expected range value. The algorithm quantifies the amount of variation or dispersion in a set of trading ranges. Non-expected values are the fundamental core of the signal generation process.
Ultimate Trend
The Ultimate trend calculates an adaptive smoothing momentum function by first determining the directional price movement and then applying smoothing to the positive and negative price changes. It then uses these values to calculate a form of Variable Moving Average (VMA), where the smoothing factor is adjusted based on a normalized measure of the relative difference between the Positive and Negative Directional values.
Trend Advisor
It's a form of Moving Averages that are applied to the price chart using three different weighting functions, simple weighting, price volatility smoothing constant weighting, and the traditional EMA weighting function.
Trend Reversal and Cloud
The function uses the information on how much the current price compared to the relative historical price fluctuates over a specific period and automatically updates its equilibrium value at new price changes.
Momentum Average
Essentially, it uses a modified version of the relative rate of change over a certain period.
Take Profit
The take profit uses similar range price functions as the contrarian signals, where a take profit signal is triggered at extremely abnormal values.
Candles
Note, Using and Backtesting on non-standard charts produces unrealistic results since it does not represent the closing price. The candles are based on a smoothing process that finds the best smoothing coefficient for the current data, using close as time series.
█ In conclusion , The Buy/Sell Toolkit serves as a comprehensive, user-friendly, and efficient trading assistant. It brings automation and intelligent data play-by-play to your fingertips, making it an essential tool for anyone serious about trading.
-----------------
Disclaimer
The information contained in my Scripts/Indicators/Ideas/Algos/Systems does not constitute financial advice or a solicitation to buy or sell any securities of any type. I will not accept liability for any loss or damage, including without limitation any loss of profit, which may arise directly or indirectly from the use of or reliance on such information.
All investments involve risk, and the past performance of a security, industry, sector, market, financial product, trading strategy, backtest, or individual's trading does not guarantee future results or returns. Investors are fully responsible for any investment decisions they make. Such decisions should be based solely on an evaluation of their financial circumstances, investment objectives, risk tolerance, and liquidity needs.
My Scripts/Indicators/Ideas/Algos/Systems are only for educational purposes!
Skrip berbayar

Trend hunter strategy - buy & sellThe indicator combines multiple technical indicators and conditions to generate buy and sell signals.
Here's how the indicator works and how to use it:
Strategy Selection:
The indicator provides a dropdown menu to choose the type of strategy. The available options are "Pullback" and "Simple."
Supertrend Settings:
The Supertrend indicator is used to identify the trend direction.
The indicator takes two input parameters:
ATR Length: Specifies the length of the Average True Range (ATR) used in the Supertrend calculation. The default value is 10.
Factor: Specifies the factor used in the Supertrend calculation. The default value is 3.0.
EMA Settings:
The indicator also includes an Exponential Moving Average (EMA) condition.
You can enable or disable the EMA condition using the "Ema Condition On/Off" checkbox.
If enabled, the indicator calculates an EMA based on the close price.
You can specify the length of the EMA using the "Ema Length" input parameter. The default value is 200.
RSI Settings:
The Relative Strength Index (RSI) indicator is used to generate additional conditions.
You can enable or disable the RSI condition using the "Rsi Condition On/Off" checkbox.
If enabled, the indicator calculates the RSI based on the close price.
You can specify the length of the RSI using the "Rsi Length" input parameter. The default value is 14.
Additionally, you can set the overbought and oversold levels for the RSI using the "RSI BUY Level" and "RSI SELL Level" input parameters, respectively. The default value for both is 50.
Final Conditions:
The indicator combines the Supertrend, EMA, and RSI conditions to generate buy and sell signals.
The specific conditions depend on the chosen strategy:
For the "Simple" strategy, the buy condition is when the Supertrend is in an up trend, not in a previous long position, the RSI is above the overbought level, and the close price is above the EMA.
For the "Pullback" strategy, the buy condition is when there is a cross under of the previous low with the Supertrend, the Supertrend is in an up trend, the RSI is above the overbought level, and the close price is above the EMA.
The sell conditions are the opposite of the respective buy conditions.
Backtest Period:
You can specify the start and end dates for the backtesting using the "Start calculations from" and "End calculations" inputs, respectively. The default start date is "2005-01-01" and the default end date is "2045-03-01." (this is work in progress) Still working on the table part, it is a bit tricky.
Trade Direction:
You can choose the trade direction using the "Trade Direction" input parameter. The available options are "Long," "Short," and "Both."
Depending on the selected trade direction, the indicator will generate signals accordingly.
Visual Display:
The indicator plots the Supertrend line on the price chart.
Buy signals are shown as green labels below the price bars.
Sell signals are shown as red labels above the price bars.
Adjust the input parameters according to your preferences, and then apply the indicator to a chart to see the generated signals. Please note that this indicator should be used for educational purposes only and should be thoroughly tested before using it for real trading.

RAM StrategyThe name RAM originated because of three popular technical indicators Relative Strength Index (RSI), Average True Range (ATR), and Moving average convergence/divergence were used all together to create three conditions individually first and once all three conditions meet at once then we considered a potential opportunity either for buy or sell and produce signals. Before we dive into how the strategy work let's clarify all the 3 indicators which has been used.
RSI (Relative Strength Index):
The RSI is a popular indicator used to assess the overbought and oversold conditions of a financial instrument. It measures the speed and change of price movements.
Overbought Level: The RSI Overbought Level is set to 65, indicating that when the RSI goes above this level, it suggests that the instrument may be overbought or overvalued.
Oversold Level: The RSI Oversold Level is set to 35, indicating that when the RSI goes below this level, it suggests that the instrument may be oversold or undervalued.
ATR (Average True Range):
The ATR is a volatility indicator that measures the average range between the high and low prices of a financial instrument. It provides insight into market volatility. There is an ATR calculation and ATR Simple Moving Average calculation done in the script which provides insights into market volatility. By comparing the current ATR value to its SMA, this indicator takes into consideration the volatility conditions while generating trading signals, aiming to capture potential price movements during periods of increased volatility.
MACD (Moving Average Convergence Divergence):
The MACD is a trend-following momentum indicator that helps identify potential trend reversals. It consists of two lines: the MACD Line and the Signal Line.
MACD Line: The MACD Line represents the difference between the short-term and long-term moving averages. Crossovers of the MACD Line above the Signal Line indicate potential buying opportunities.
Signal Line: The Signal Line is a moving average of the MACD Line. Crossovers of the MACD Line below the Signal Line indicate potential selling opportunities and crossovers of the MACD line above the signal line indicate potential buying opportunities.
Trading Strategy:
Buy Signal: A buy signal is generated when the RSI is below the oversold level, the ATR is higher than its Simple Moving Average (indicating higher volatility), and there is a bullish crossover of the MACD Line above the Signal Line.
Sell Signal: A sell signal is generated when the RSI is above the overbought level, the ATR is higher than its Simple Moving Average (indicating higher volatility), and there is a bearish crossover of the MACD Line below the Signal Line.
The plot shapes function is used to visually represent the buy and sell signals on the price chart. Green "BUY" labels are displayed below the price bars for buy signals, while red "SELL" labels are displayed above the price bars for sell signals.
This strategy aims to identify potential buying and selling opportunities based on the combination of RSI, ATR, and MACD indicators. However, please note that the effectiveness and profitability of the strategy may vary depending on market conditions and individual trading preferences.
*Disclaimer*
Trading involves risk. Also, clarify that past performance is not indicative of future results and that individuals should only trade with the capital they can afford to lose.
