Buy / Sell Signals With Take Profits (Non-Repaint)This indicator generates automatic BUY/SELL flip signals based on trend direction, volatility status, and ATR dynamics.
Labels are placed based on actual High/Low and do not shift.
Features
✔ Dynamic ATR Multipliers
✔ Volatility Stretch (calm market → narrow, aggressive → wide)
✔ Trend Memory (25-bar direction memory)
✔ Automatic TP1–TP5 (%1 – %5) calculation
✔ Desktop & Mobile compatible TP Panel
✔ Bull/Bear Flip labels
✔ TradingView alert support
Suitable Markets
Forex, Crypto, Stocks, Indices, Gold, Oil
Works on all timeframes (5min – 1min – 4min – Daily).
⚠ Important Note
This tool is not investment advice.
It does not provide any buy–sell recommendations.
All trading decisions are yours; risk management is entirely the user's responsibility.
Buysetup

TriexDev - SuperBuySellTrend (PLUS+)Minimal but powerful.
Have been using this for myself, so thought it would be nice to share publicly. Of course no script is correct 100% of the time, but this is one of if not the best in my basic tools. (This is the expanded/PLUS version)
Github Link for latest/most detailed + tidier documentation
Base Indicator - Script Link
TriexDev - SuperBuySellTrend (SBST+) TradingView Trend Indicator
---
SBST Plus+
Using the "plus" version is optional, if you only want the buy/sell signals - use the "base" version.
## What are vector candles?
Vector Candles (inspired to add from TradersReality/MT4) are candles that are colour coded to indicate higher volumes, and likely flip points / direction changes, or confirmations.
These are based off of PVSRA (Price, Volume, Support, Resistance Analysis).
You can also override the currency that this runs off of, including multiple ones - however adding more may slow things down.
PVSRA - From MT4 source:
Situation "Climax"
Bars with volume >= 200% of the average volume of the 10 previous chart TFs, and bars
where the product of candle spread x candle volume is >= the highest for the 10 previous
chart time TFs.
Default Colours: Bull bars are green and bear bars are red.
Situation "Volume Rising Above Average"
Bars with volume >= 150% of the average volume of the 10 previous chart TFs.
Default Colours: Bull bars are blue and bear are blue-violet.
A blue or purple bar can mean the chart has reached a top or bottom.
High volume bars during a movement can indicate a big movement is coming - or a top/bottom if bulls/bears are unable to break that point - or the volume direction has flipped.
This can also just be a healthy short term movement in the opposite direction - but at times sets obvious trend shifts.
## Volume Tracking
You can shift-click any candle to get the volume of that candle (in the pair token/stock), if you click and drag - you will see the volume for that range.
## Bollinger Bands
Bollinger Bands can be enabled in the settings via the toggle.
Bollinger Bands are designed to discover opportunities that give investors a higher probability of properly identifying when an asset is oversold (bottom lines) or overbought (top lines).
>There are three lines that compose Bollinger Bands: A simple moving average (middle band) and an upper and lower band.
>The upper and lower bands are typically 2 standard deviations +/- from a 20-day simple moving average, but they can be modified.
---
Base Indicator
## What is ATR?
The average true range (ATR) is a technical analysis indicator, which measures market volatility by decomposing the entire range of an asset price for that period.
The true range indicator is taken as the greatest of the following:
- current high - the current low;
- the absolute value of the current high - the previous close;
- and the absolute value of the current low - the previous close.
The ATR is then a moving average, generally using 10/14 days, of the true ranges.
## What does this indicator do?
Uses the ATR and multipliers to help you predict price volatility, ranges and trend direction.
> The buy and sell signals are generated when the indicator starts
plotting either on top of the closing price or below the closing price. A buy signal is generated when the ‘Supertrend’ closes above the price and a sell signal is generated when it closes below the closing price.
> It also suggests that the trend is shifting from descending mode to ascending mode. Contrary to this, when a ‘Supertrend’ closes above the price, it generates a sell signal as the colour of the indicator changes into red.
> A ‘Supertrend’ indicator can be used on equities, futures or forex, or even crypto markets and also on daily, weekly and hourly charts as well, but generally, it will be less effective in a sideways-moving market.
Thanks to KivancOzbilgic who made the original SuperTrend Indicator this was based off
---
## Usage Notes
Two indicators will appear, the default ATR multipliers are already set for what I believe to be perfect for this particular (double indicator) strategy.
If you want to break it yourself (I couldn't find anything that tested more accurately myself), you can do so in the settings once you have added the indicator.
Basic rundown:
- A single Buy/Sell indicator in the dim colour; may be setting a direction change, or just healthy movement.
- When the brighter Buy/Sell indicator appears; it often means that a change in direction (uptrend or downtrend) is confirmed.
---
You can see here, there was a (brighter) green indicator which flipped down then up into a (brighter) red sell indicator which set the downtrend. At the end it looks like it may be starting to break the downtrend - as the price is hitting the trend line. (Would watch for whether it holds above or drops below at that point)
Another example, showing how sometimes it can still be correct but take some time to play out - with some arrow indicators.
Typically I would also look at oscillators, RSI and other things to confirm - but here it held above the trend lines nicely, so it appeared to be rather obvious.
It's worth paying attention to the trend lines and where the candles are sitting.
Once you understand/get a feel for the basics of how it works - it can become a very useful tool in your trading arsenal.
Also works for traditional markets & commodities etc in the same way / using the same ATR multipliers, however of course crypto generally has bigger moves.
---
You can use this and other indicators to confirm likeliness of a direction change prior to the brighter/confirmation one appearing - but just going by the 2nd(brighter) indicators, I have found it to be surprisingly accurate.
Tends to work well on virtually all timeframes, but personally prefer to use it on 5min,15min,1hr, 4hr, daily, weekly. Will still work for shorter/other timeframes, but may be more accurate on mid ones.
---
This will likely be updated as I go / find useful additions that don't convolute things. The base indicator may be updated with some limited / toggle-able features in future also.

Deep FinderThis indicator shows you the most convenient buying times. It helps you lower your average and earn high profits by purchasing incrementally.

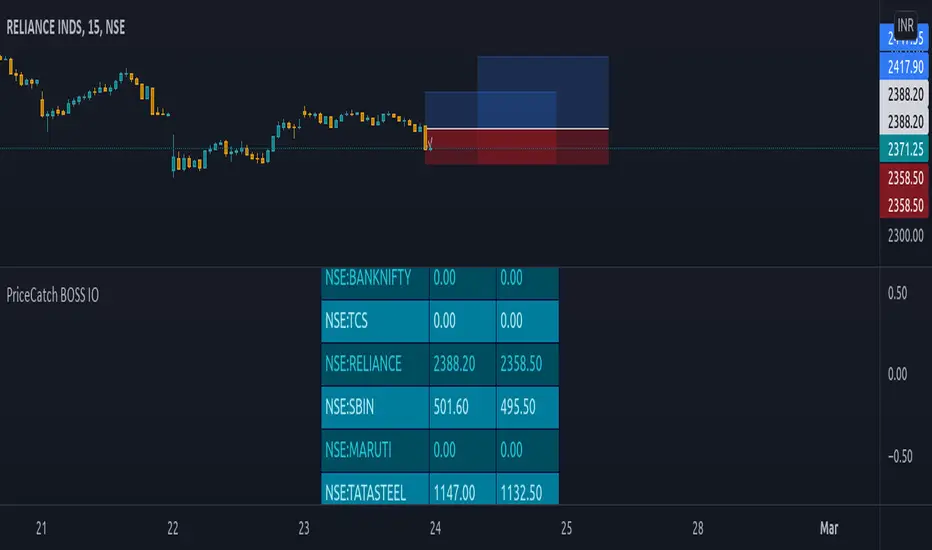
PriceCatch BOSS IOHi TradingView Community.
I am publishing a script that uses a proprietary logic based on Fibonacci retracement for identifying breakouts. This is a script that focuses on long side trades only.
PriceCatch BOSS IO: - PriceCatch Breakout Screener Script (Invite Only).
This script is not an indicator that plots anything on the chart but is a Screener.
SLIPPED OPPORTUNITIES
One of the problems faced by traders is that while they are watching or studying the chart of one stock or Forex pair, a super opportunity slips by them in another stock or another instrument and it is frustrating when that happens. With the PriceCatch BOSS IO script, you can now capture such moves made by other symbols whilst you are watching some other instrument.
USP:
The uniqueness of this script is that you can screen Nine of your favorite symbols for breakout opportunities simultaneously.
Users can pick Nine symbols of their choice and specify a resolution in the Settings dialog screen that the script will use to find out any probable breakouts in those selected nine symbols continuously.
The symbols could be from any exchange across the world and of any type - stocks, futures, commodities, Forex and Crypto. Simply put, if you can plot the symbol in TradingView, PriceCatch BOSS can monitor that instrument for breakouts on the time interval chosen by you.
ACTIONABLE INFORMATION:
What traders look for and expect from their charts is actionable information. This script does that. It clearly tells you the Entry Price and Stop Loss price for each symbol when a breakout opportunity presents itself in that symbol. You can then open up the chart of that specific symbol to validate the given information with any other indicators that you use and then take the call with regards to a trade. You may also use this script alone without adding any other indicator to your chart. The choice is yours.
CLARITY BEFORE TRADE:
As both Entry Price and Stop Loss Price are identified by the script, you receive advance information about the risk and can set your own Reward based on your personal preferences. So, with the necessary information provided to you in advance, you can plan your trades with clarity.
HOW IT WORKS:
Once the list of symbols are selected and resolution chosen, the script then continuously monitors those given symbols for breakout opportunities. At the close of every interval, it presents the results as shown below:
Results Set
This script shows the results of the screening in a Table as under:
SYMBOL Entry Price Stop Price
TSLA 830.84 802.88
EURUSD 1.13425 1.13160
Similarly for seven more instruments chosen by you.
NOTE: 0.00 under Entry and Stop price columns mean that there is no opportunity in that symbol.
ADVANTAGE:
The advantage of this script is that it helps you spot trades in your favorite symbols without manually loading their charts. With the ability to screen the symbols from Intraday time frames to higher time frames such as Weekly, you will be able to spot opportunities to go long in intraday, swing and even positional trades of longer duration.
Another significant advantage of this script is that while you may be watching a symbol in, say 15 minutes time frame, you can set the script to monitor breakouts in any other higher time frame starting from 15 minutes. This, in effect, gives you unsurpassed advantage.
DISCIPLINE:
As you choose your nine instruments/assets, the script indirectly inculcates discipline as your attention will be only on the selected instruments and you will not be distracted or search for opportunities in a whole bunch of other symbols / assets / instruments. As you can at any time change the set of nine assets as per your personal preference, you get the flexibility that you seek to work with a different set of symbols. For Forex traders who like to monitor only Major Pairs the ability to scan Nine pairs is quite sufficient. Similarly, to traders who trade S&P500, ES1! and other instruments, the nine symbols flexibility is adequate.
LONG POSITION TOOL
For visual cues, you may use the Long Position tool to set the Entry, Stop and Targets as per your preference on the main chart.
TRICK:
Can I only screen nine instruments? What if I am interested to screen more? Actually, you can screen more instruments. You see, you can add this script on to your chart multiple times and can select a set of nine unique stocks per script instance. That way you can actually screen more than nine stocks!
EXAMPLES:
Nifty 50
TSLA
Maruti
USDJPY
MSFT
UI
The script allows you to fine tune display options as per your personal preferences.
NOTE: This script runs in a separate pane without obstructing the view of your main chart.
NOTE: The formatting of price is based on mintick. As a result, since Forex and Crypto have more number of digits after the Decimal, if your screener list consists of a mix of stocks, Forex and Crypto - please change to a Forex chart to get the correct Forex price and to Crypto for correct Crypto price and so on.
NOTE: You will not get accurate results if you are in a higher time frame chart and the Screener resolution is set to lower time frame. For example, if chart is in 15 MTF and Screener resolution is set to 3 MTF, the results may not be accurate.
TIP: If you have added this script multiple times to your chart, then you may have to maximize the pane to view the results table.
NOTE - PRIOR TO USING THIS SCRIPT:
Please remember that the script is shared with absolutely no assurances about usability and any warranties whatsoever and as a responsible trader, please satisfy yourselves thoroughly and use it only if you are convinced it works for you. Remember, you are 100% responsible for your actions and must, therefore, do your due diligence before using this script and also before every trade. Profits and losses are part and parcel of trading activity and you are solely responsible for both. If you understand and accept that, you may use the script.
QUERIES/FEEDBACK
Please PM me.
Hope you find this script useful. Wish everyone all the best with trading.
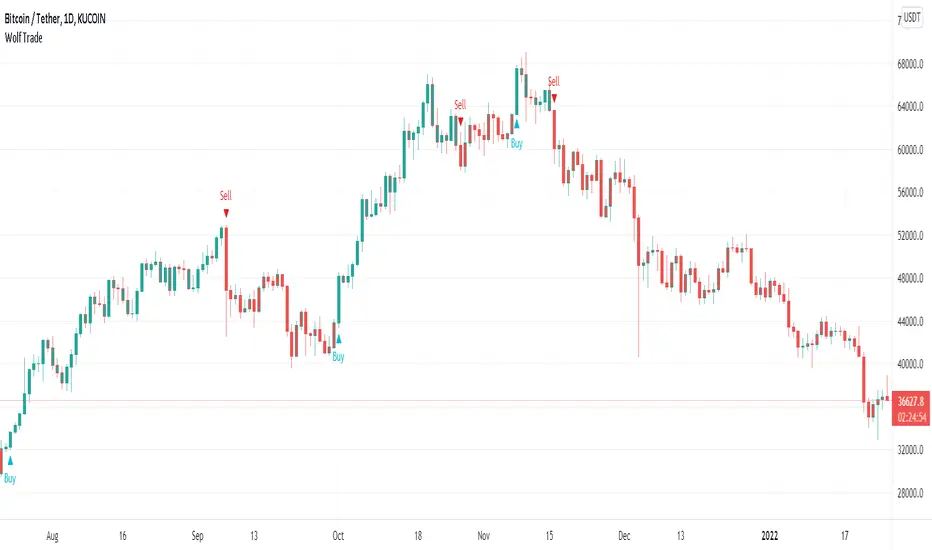
Wolf TradeWolf Trade indicator designed to help you develop your own trading strategy and give you that extra confirmation on your trade ideas. This indicator helps you to identify the right buying or selling opportunity. Examines several items to issue a buying or selling position. For example, it checks the status of the RSI , as well as the status of the MACD , as well as the status of the stochastic . Checks the order of placement of the EMA and the condition of their cross with ATR. And uses the ATR for stop loss.
Wolf Trade indicator commodities on all timeframes including 1m, 3m , 5m, 15m, 30m, 1H, 2H, 4H, 1D, 1W, etc. Definitely, the performance of this indicator is much better in 1, 2, 4 hours and daily timeframes, but that does not mean you can not use it in shorter time frames.
This indicator is does not repaint and works on any market internationally including crypto, stocks, forex, futures and currencies. You can utilize our indicator for scalping, swing trading, holding or even for trading options as well.
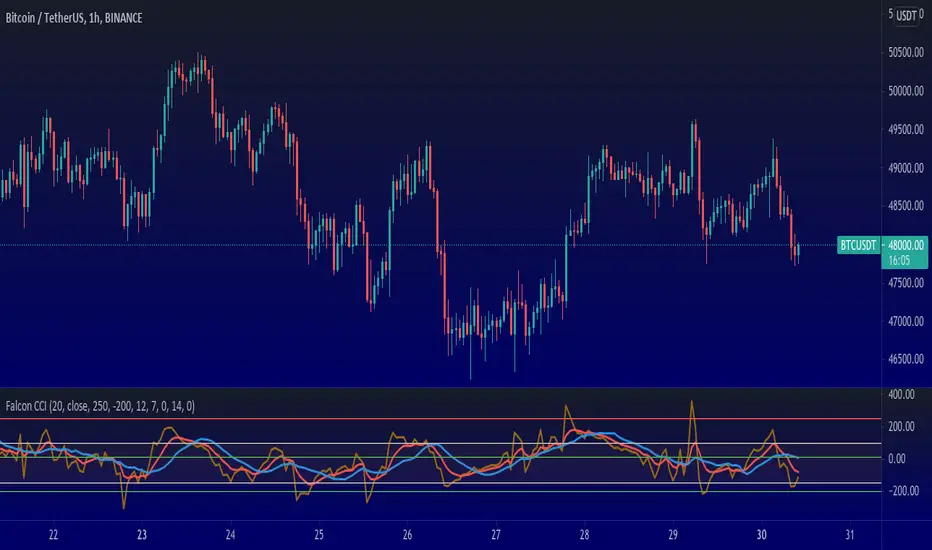
Falcon Commodity Channel IndexFalcon CCI indicator is a superb indicator for anyone who wants to dig deep and still float. The trading lifestyle requires you to be one step ahead of everyone else, while doing so, you want to manage risk, enter at correct positions and perhaps exit at correct positions too.
Exiting at correct positions is so over rated, people tend to forget that exit is as important as entry and therefore we need to make sure that we use a good indicator setup that helps us to do that.
Falcon CCI Indicator is a receipe developed by me during recent Bitcoin slump, where we really needed something more to help us get pass through ups and downs, sudden movements and volatility in the market.
This indicator is perfect even for the swing and trend traders, intra day and day traders who want a quick win, rather than invest for long term.
Here are entry and exit plans based on this indicator:-
Setup: I keep CCI at 20, MA at 14 and EMA at 7 but I change it depending on the stock or crypto. Truth is, you can play with it and find what is best for your trading setups, but once you are done, it really works.
Buy: Buy when CCI crosses above MA or EMA , but CCI should be below 50
Sell: Sell when CCI crosses below MA or EMA (You need to choose), CCI should be above 150
There can be other entry and exit based on just CCI values, and therefore I have added some max and min inputs too in the indicator, e.g. Buy when CCI is -180 and sell when CCI is 300.
Trading is a long process.
To all my friends who have lost in futures , or anywhere else in the market, don't worry, just follow the process and follow your own rules. Don't break them.
You can connect with me on Trading View, message me to discuss this further. Happy to take your questions.
P.S you can also add linear regression to this to give you certain price points, for market tops or bottoms within the time frame.
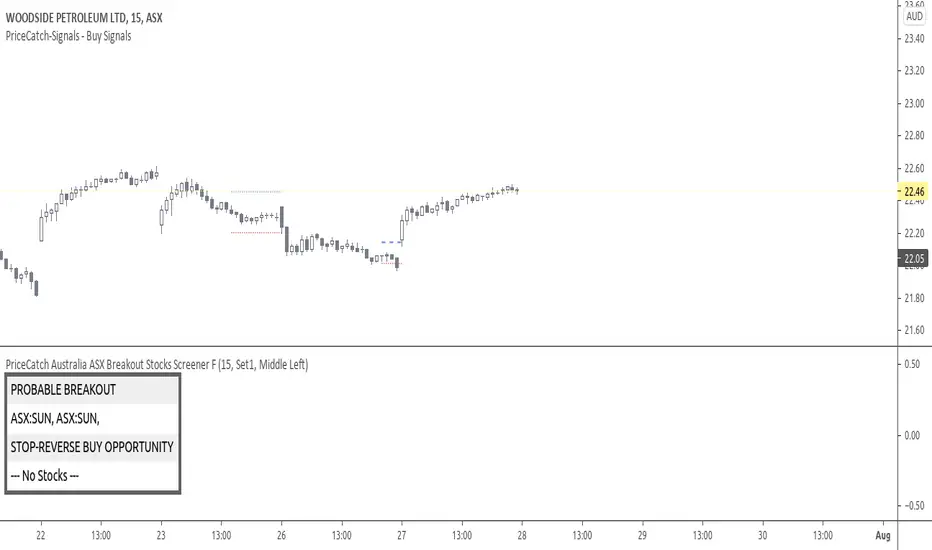
PriceCatch Australia ASX Breakout Stocks Screener FHi,
TradingView community and Australia (ASX) traders. Warm Greetings.
PriceCatch Australia (ASX) Breakout Stocks Screener
I am sharing a script that screens Australia (ASX) stocks for Probable Breakout Buy signal and Stop-Reverse Buy Signal. This script may prove to be useful to traders who trade Australia (ASX) listed stocks.
I have already shared the script "PriceCatch Signals Buy Signals" that marks the following levels on the chart.
Probable Breakout Buy Level
Stop-Reverse Buy Level
While the script "PriceCatch Signals Buy Signals" can be used independently, this script is intended to be used with the script "PriceCatch Signals Buy Signals".
Used together, these two scripts may help you identify probable breakout opportunities. This Screener will help you screen stocks that have broken out of any of the Breakout levels marked by the "PriceCatch Signals Buy Signals" script. This way you can quickly and automatically identify breakout stocks without manually going through every stock in your watchlist searching for breakout signals.
Please read the Notes of the script "PriceCatch Signals Buy Signals" for explanation of its functionality.
STOCKS SET
This Free screener scans a list of 20 stocks. The full version scans a list of 80 stocks. Care has been taken to include liquid stocks and stocks of AUD $10 and above only, to avoid penny stocks.
Chart resolution vs. Script resolution
It is suggested to set the chart resolution to a lower time-frame than the Screener resolution. For example, if the screener resolution is set to 1 Hour time-frame, set the chart resolution to less than 1 Hour time-frame and run the Screener.
CHART
The Screener runs independently and you may have any other ASX chart on your screen.
NOTE - PRIOR TO USING THIS SCRIPT:
Please remember that the script is shared with absolutely no assurances about usability and any warranties whatsoever and as a responsible trader, please satisfy yourselves thoroughly and use it only if you are satisfied it works for you. Remember, you are 100% responsible for your actions. If you understand and accept that, you may use the script.
QUERIES/FEEDBACK
Please PM me or comment.
Regards to all and wish everyone all the best with trading.
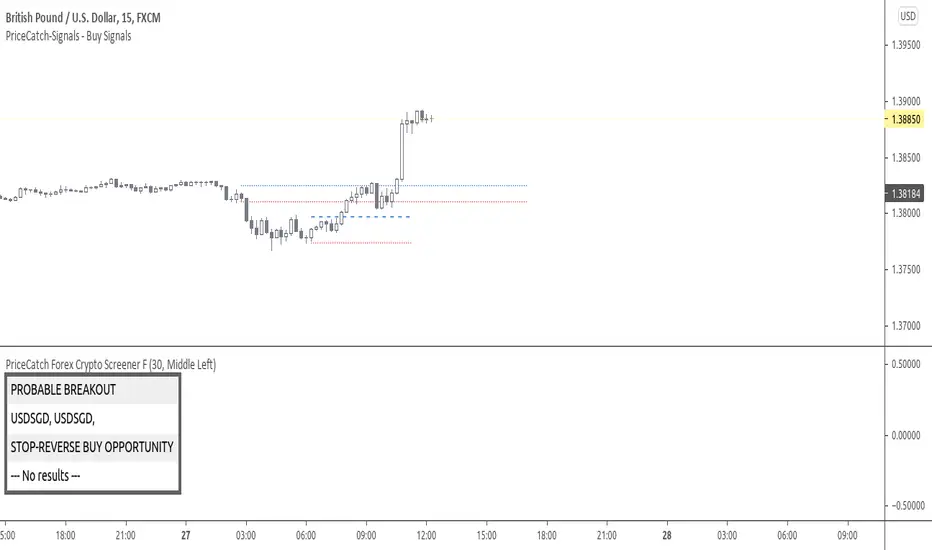
PriceCatch Forex Crypto Screener FHi,
TradingView community and Forex & Crypto traders. Warm Greetings.
PriceCatch Forex Crypto Screener Free Version.
I am sharing a script that screens Forex pairs, XAGUSD, XAUUSD, BTCUSD and ETHUSD for Probable Breakout signals. This script may prove to be useful to traders who trade in the above instruments.
Once this script is added to your chart and the resolution is set, it will automatically keep watching for any breakout on the above instruments and display the results on chart for your attention.
I have already shared the script "PriceCatch-Signals Buy Signals" that marks the following levels on the chart.
Probable Breakout Buy Level
Stop-Reverse Buy Level
While the script "PriceCatch-Signals Buy Signals" can be used independently on all instruments like stocks, Forex, Crypto, commodities etc., this script is intended to be used with the script "PriceCatch-Signals Buy Signals".
Used together, these two scripts may help you identify probable breakout opportunities. This Screener will help you screen the above instruments that have broken out of any of the Breakout levels marked by the "PriceCatch-Signals Buy Signals" script. This way you can quickly and automatically identify breakouts or anticipate them on your favorite Forex pair without manually going through your watchlist searching for breakout opportunities.
Please read the Notes of the script "PriceCatch-Signals Buy Signals" for explanation of its functionality.
FREE VERSION FOREX SET
This Free Forex screener scans a list of 11 Pairs and 2 Crypto (BTCUSD and ETHUSD). This should be enough for most traders. The full version scans all major Forex pairs and more Cryptocurrencies.
Chart resolution vs. Script resolution
It is suggested to set the chart resolution to a lower time-frame than the Screener resolution. For example, if the screener resolution is set to 1 Hour time-frame, set the chart resolution to less than 1 Hour time-frame and run the Screener.
CHART
The Screener runs independently of any symbol displayed on your chart.
NOTE - PRIOR TO USING THIS SCRIPT:
Please remember that the script is shared with absolutely no assurances about usability and any warranties whatsoever and as a responsible trader, please satisfy yourselves thoroughly and use it only if you are convinced it works for you. Remember, you are 100% responsible for your actions. If you understand and accept that, you may use the script.
QUERIES/FEEDBACK
Please PM me or leave comments.
Regards to all and wish everyone all the best with trading.
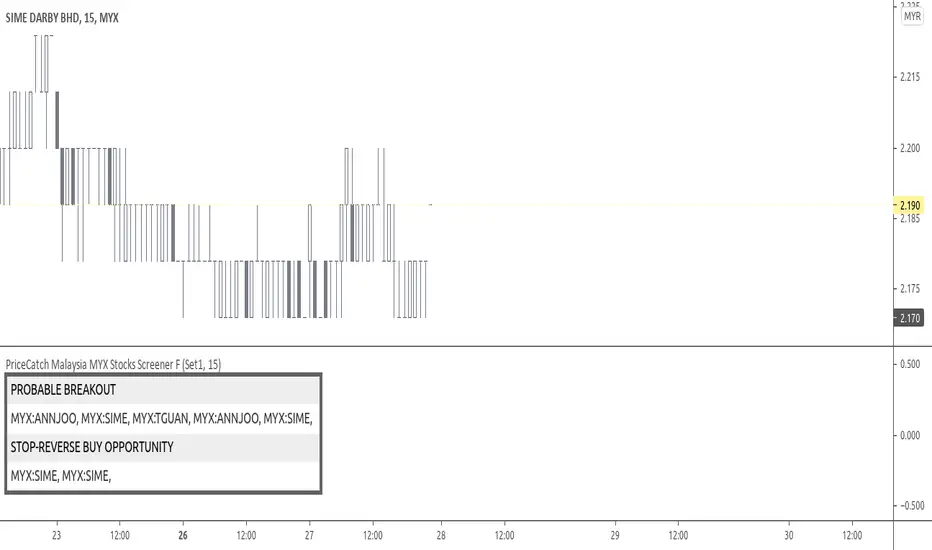
PriceCatch Malaysia MYX Stocks Screener FHi,
Tradingview community and Malaysian MYX Traders. Warm Greetings.
Malaysia MYX Stocks Screener
I am sharing a script that screens Malaysia MYX stocks for Probable Breakout Buy signal and Stop-Reverse Buy Signal. This script may prove to be useful to traders who trade Malaysia MYX listed stocks.
I have already shared the script "PriceCatch Signals Buy Signals" that marks the following levels on the chart.
Probable Breakout Buy Level
Stop-Reverse Buy Level
While the script "PriceCatch Signals Buy Signals" can be used independently, this script is intended to be used with the script "PriceCatch Signals Buy Signals".
Used together, these two scripts may help you identify probable buy opportunities. The purpose of this script is to help screen stocks quickly without manually going through every stock in your watch list.
Please read the Notes of the script "PriceCatch Signals Buy Signals" for explanation of its functionality.
Stock Set
This Free screener scans a list of 20 stocks. The full version scans a list of 60 stocks. The stocks list will be regularly updated. Care has been taken to include liquid stocks. MYX traders may suggest liquid stocks for inclusion in full version.
Chart resolution vs. Script resolution
I have noticed that if the chart resolution is set to 15 minutes time-frame and the screener resolution is selected as 2 Hours, then the results are correct. However, if the screener resolution is set to 5 minutes, then the results are not accurate. This is not an issue with script. So scanning higher time-frames from a lower time-frame chart works better. My advice however, is better to set the chart resolution to the same interval as screener resolution for sure results.
As usual with price action, longer time-frames produce more reliable signals.
CHART
You can have any stock on your chart, while the screener is scanning the stocks independently. In the above image, chart is set to 45 minutes time frame and stock is ABMB, however screener is screening stocks in 120 minutes time frame and has found GTRONIC.
NOTE - PRIOR TO USING THIS SCRIPT:
Please remember that the script is shared with absolutely no assurances about usability and any warranties whatsoever and as a responsible trader, please satisfy yourselves thoroughly and use it only if you are satisfied it works for you. Remember, you are 100% responsible for your actions. If you understand and accept that, you may use the script.
QUERIES/FEEDBACK
Please PM me.
Regards to all and wish everyone all the best with trading.
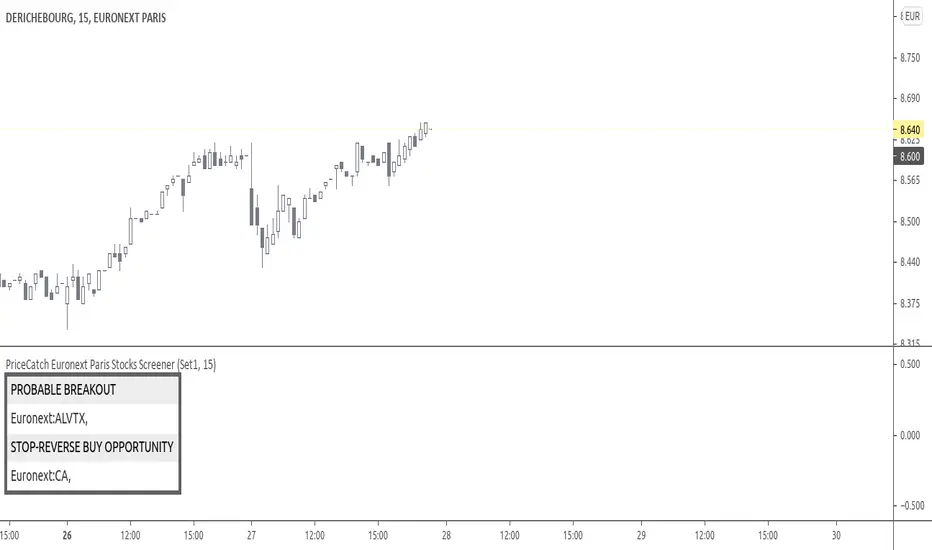
PriceCatch Euronext Paris Stocks Screener v1Hi,
Tradingview community. Warm Greetings.
Euronext Paris Stocks Screener
I am sharing a script that screens Euronext Paris stocks for Probable Breakout Buy signal and Stop-Reverse Buy Signal. This script may prove to be useful to traders who trade Euronext Paris listed stocks.
I have already shared the script "PriceCatch Signals Buy Signals" that marks the following levels on the chart.
Probable Breakout Buy Level
Stop-Reverse Buy Level
While the script "PriceCatch Signals Buy Signals" can be used independently, this script is intended to be used with the script "PriceCatch Signals Buy Signals".
Used together, these two scripts may help you identify probable buy opportunities. The purpose of this script is to help screen stocks quickly without manually going through every stock in your watchlist.
Please read the Notes of the script "PriceCatch Signals Buy Signals" for explanation of its functionality.
Stocks Set
As Tradingview limits the number of security function calls, to get around, you have to select Set1 to screen first set of 25 stocks and then select Set2 to screen next set of 25 stocks.
List of Euronext Paris stocks
ACA AI AIR ALCRB ALGAU ALO ALONC ALVTX ATO BN BNP CA CLA COFA CS DBG DG EDF
EL ELIOR EN ENGI ETL FDJ FR FTI GET GLE MCPHY OR ORA POXEL PUB RI
RNO RXL SAF SAN SGO SMCP STLA STM SU TE TTE VIE VIV VK VLA WLN
Chart resolution vs. Script resolution
I have noticed that if the chart resolution is set to 15 minutes time-frame and the screener resolution is selected as 2 Hours, then the results are correct. However, if the screener resolution is set to 5 minutes, then the results are not accurate. This is not an issue with script. So scanning higher time-frames from a lower time-frame chart works better. My advice however, is better to set the chart resolution to the same interval as screener resolution for sure results.
As usual with price action, longer time-frames produce more reliable signals.
SOME CHARTS
Chart set to Daily time-frame and shows Derichebourg stock. Screener shows a Stop-Reverse Buy Opportunity on GET.
s3.tradingview.com
Example 2
Chart set to 30 min. timeframe and shows Derichebourg stock. Screener shows a Stop-Reverse Buy Opportunity on VIV .
s3.tradingview.com
NOTE - PRIOR TO USING THIS SCRIPT
Please remember that the script is shared with absolutely no assurances about usability and any warranties whatsoever and as a responsible trader, please satisfy yourselves thoroughly and use it only if you are satisfied it works for you. Remember, you are 100% responsible for your actions. If you understand and accept that, you may use the script.
QUERIES/FEEDBACK
Please PM me.
Regards to all and wish everyone all the best with trading.
PriceCatch - EuronextParis-Stocks screenerHi,
Tradingview community. Warm Greetings.
EuronextParis Stocks Screener
I am sharing a script that screens Euronext Paris stocks for Probable Breakout Buy signal and Stop-Reverse Buy Signal. This script may prove to be useful to traders who trade Euronext Paris listed stocks.
I have already shared the script "PriceCatch-Signals - Buy Signals" that marks the following levels on the chart.
Probable Breakout Buy Level
Stop-Reverse Buy Level
While the script "PriceCatch-Signals - Buy Signals" can be used independently, this script is intended to be used with the script "PriceCatch-Signals - Buy Signals".
Used together, these two scripts may help you identify probable buy opportunities. The purpose of this script is to help screen stocks quickly without manually going through every stock in your watchlist.
Please read the Notes of the script "PriceCatch-Signals - Buy Signals" for explanation of its functionality.
Stock Set
As Tradingview limits the number of security function calls, to get around, you have to select Set1 to screen first set of 25 stocks and then select Set2 to screen next set of 25 stocks.
Chart resolution vs. Script resolution
I have noticed that if the chart resolution is set to 15 minutes timeframe and the screener resolution is selected as 2 Hours, then the results are correct. However, if the screener resolution is set to 5 minutes, then the results are not accurate. This is not an issue with script. So scanning higher timeframes from a lower timeframe chart works better. My advice however, is better to set the chart resolution to the same interval as screener resolution for sure results.
As usual with price action, longer time-frames produce more reliable signals.
SOME CHARTS
Chart set to Daily timeframe and shows Derichebourg stock. Screener shows a Stop-Reverse Buy Opportunity on GET.
Example 2
Chart set to 30 min. timeframe and shows Derichebourg stock. Screener shows a Stop-Reverse Buy Opportunity on VIV.
NOTE - PRIOR TO USING THIS SCRIPT:
Please remember that the script is shared with absolutely no assurances about usability and any warranties whatsoever and as a responsible trader, please satisfy yourselves thoroughly and use it only if you are satisfied it works for you. Remember, you are 100% responsible for your actions. If you understand and accept that, you may use the script.
QUERIES/FEEDBACK
Please PM me.
Regards to all and wish everyone all the best with trading.

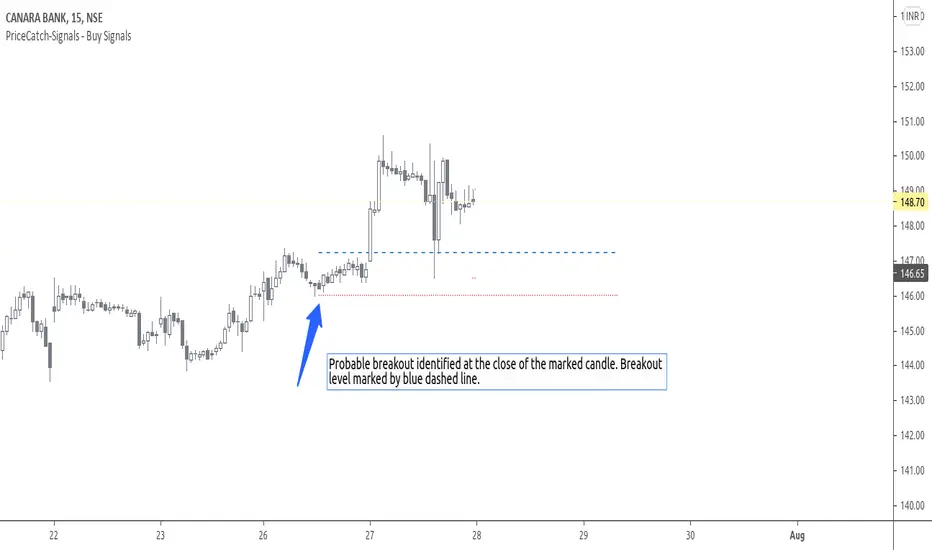
PriceCatch-Signals - Buy SignalsHi,
TradingView Community.
Here is a script that identifies and marks two different buy levels on the chart. It works on all asset classes - equities, forex, crypto.
Probable Breakout Buy Level
Stop-Reverse Buy Level
The bottom images are self-explanatory.
PROBABLE BREAKOUT BUY LEVEL EXAMPLE:
STOP-REVERSE BUY LEVEL EXAMPLE:
IDENTIFICATION OF LEVELS:
The Blue Dotted line represents Probable Breakout Buy Level and the Blue Dashed Line Stop-Reverse Buy Level. The corresponding Red Dotted line below each level should be your initial stop loss price point.
PLAYING SAFE
After taking the trade, to play safe, I follow this method that once the Low of the price goes above the Buy Level, I usually shift the stop loss to buy price to protect against any sudden reversal. For me protecting capital is important. As usual with price action, longer time-frames produce more reliable signals.
NOTE - PRIOR TO USING THIS SCRIPT:
The script uses Heikin-Ashi Candles data to identify the levels. You may use this script in addition to your other indicators or in isolation. Please remember that the script is shared with absolutely no assurances and warranties whatsoever and as a responsible trader, please satisfy yourselves thoroughly and use it only if you are satisfied it works for you. Remember, you are 100% responsible for your actions. If you understand and accept that, you may use the script. The script does not identify any short signals.
ADDITIONAL NOTE:
I shall also be releasing Screener scripts that scan the following markets for the above two conditions or signals thereby helping traders spot opportunities at the right time by making the task of finding right stocks a breeze.
NASDAQ Stocks Screener (Can screen a total number of 160 stocks. 40 stocks at a time)
UK LSE Stocks Screener (Can screen a total number of 90 stocks. 30 stocks at a time)
Euronext Paris Stocks Screener (Can screen a total number of 50 stocks. 25 stocks at a time) - in development.
Singapore Stocks Screener is in development
Other International exchanges will be added based on response from users.
SOME MORE CHARTS:
QUERIES/FEEDBACK
Please PM me.
Regards to all and wish everyone all the best with trading.
PriceCatch-Signals - Buy SignalHi,
TradingView Community.
Here is a script that identifies and marks two different buy levels on the chart. It works on all asset classes - equities, forex, crypto.
Probable Breakout Buy Level
Stop-Reverse Buy Level
The bottom images are self-explanatory.
PROBABLE BREAKOUT BUY LEVEL EXAMPLE:
STOP-REVERSE BUY LEVEL EXAMPLE:
IDENTIFICATION OF LEVELS:
The Blue Dotted line represents Probable Breakout Buy Level and the Blue Dashed Line Stop-Reverse Buy Level. The corresponding Red Dotted line below each level should be your initial stop loss price point.
PLAYING SAFE
After taking the trade, to play safe, I follow this method that once the Low of the price goes above the Buy Level, I usually shift the stop loss to buy price to protect against any sudden reversal. For me protecting capital is important. As usual with price action, longer time-frames produce more reliable signals.
NOTE - PRIOR TO USING THIS SCRIPT:
The script uses Heikin-Ashi Candles data to identify the levels. You may use this script in addition to your other indicators or in isolation. Please remember that the script is shared with absolutely no assurances and warranties whatsoever and as a responsible trader, please satisfy yourselves thoroughly and use it only if you are satisfied it works for you. Remember, you are 100% responsible for your actions. If you understand and accept that, you may use the script. The script does not identify any short signals.
ADDITIONAL NOTE:
I shall also be releasing Screener scripts that scan the following markets for the above two conditions or signals thereby helping traders spot opportunities at the right time by making the task of finding right stocks a breeze.
NASDAQ Stocks Screener (Can screen a total number of 160 stocks. 40 stocks at a time)
UK LSE Stocks Screener (Can screen a total number of 90 stocks. 30 stocks at a time)
Euronext Paris Stocks Screener (Can screen a total number of 50 stocks. 25 stocks at a time) - in development.
Singapore Stocks Screener is in development
Other International exchanges will be added based on response from users.
SOME MORE CHARTS:
QUERIES/FEEDBACK
Please PM me.
Regards to all and wish everyone all the best with trading.

PriceCatch-SignalsHi,
TradingView Community.
Here is a script that identifies and marks two different buy levels on the chart. It works on all asset classes - equities, forex, crypto.
Probable Breakout Buy Level
Stop-Reverse Buy Level
The bottom images are self-explanatory.
PROBABLE BREAKOUT BUY LEVEL EXAMPLE:
STOP-REVERSE BUY LEVEL EXAMPLE:
IDENTIFICATION OF LEVELS:
The Blue Dotted line represents Probable Breakout Buy Level and the Blue Dashed Line Stop-Reverse Buy Level. The corresponding Red Dotted line below each level should be your initial stop loss price point.
PLAYING SAFE
After taking the trade, to play safe, I follow this method that once the Low of the price goes above the Buy Level, I usually shift the stop loss to buy price to protect against any sudden reversal. For me protecting capital is important. As usual with price action, longer time-frames produce more reliable signals.
NOTE - PRIOR TO USING THIS SCRIPT:
The script uses Heikin-Ashi Candles data to identify the levels. You may use this script in addition to your other indicators or in isolation. Please remember that the script is shared with absolutely no assurances and warranties whatsoever and as a responsible trader, please satisfy yourselves thoroughly and use it only if you are satisfied it works for you. Remember, you are 100% responsible for your actions. If you understand and accept that, you may use the script. The script does not identify any short signals.
ADDITIONAL NOTE:
I shall also be releasing Screener scripts that scan the following markets for the above two conditions or signals thereby helping traders spot opportunities at the right time by making the task of finding right stocks a breeze.
NASDAQ Stocks Screener (Can screen a total number of 160 stocks. 40 stocks at a time)
UK LSE Stocks Screener (Can screen a total number of 90 stocks. 30 stocks at a time)
Euronext Paris Stocks Screener (Can screen a total number of 50 stocks. 25 stocks at a time) - in development.
Singapore Stocks Screener is in development
Other International exchanges will be added based on response from users.
SOME MORE CHARTS:
QUERIES/FEEDBACK
Please PM me.
Regards to all and wish everyone all the best with trading.

Coinmaster Holding ScriptRECOMMENDATION: I PREFFER USE THIS ON 4H OR 1D TIMEFRAME
In the following article, I have completed the creation of this semi-automatic script dedicated to institutional capital management in the different markets, its development was carried out under operations that exceed a balance greater than 1 million usd, which will allow you to summarize your technical analysis or you can request my support to automate your account after your previous studies.
Alerts have been created that you can program or automate through webhook, under which you can program for advice or consultancy to your account, either to integrate indexed, forex or cryptocurrency trading api keys or to perform leveraged operations either long or short with leverage especially cryptocurrencies, with a focus on BTC / USD, BTC / USDT, ETH / USD, ETH / USDT, LTC / USD, LTC / USDT, TRX / USD, TRX / USDT but adaptable to any asset
where I deliver 6 years of research, training, use, development and implementation of different analysis and trading mechanisms in financial markets.
It allows you to carry out simple technical analysis studies in a calculated way
Using wide and different methods, which are automatically arranged algorithmically, indicating a buy or sell signal based on the "Price Action + Average True Range or Atr", which also takes into consideration the increase or decrease in volume and different combined conditions are used to arrive at a "combined signal" between them:
Macd
- RSI
- ATR "Average True Range
- Retracement and Fibonacci Levels
- Pivot Points
- Sar Parabolic
- Volume
- Crossing Moving Averages
- Price per volume trend indicator (VPT)
- Calculated Analysis of Divergence, Bullish Divergence, Bearish Divergence
- Analysis of Divergence and Fibonacci Crosses
- Combination of Pivot Points and Fibonacci Levels with automatic price adjustment for all time frames
- Automatic support and resistance adjustment
- Automatic adjustment, entry of new levels, eliminate and readjust fibonacci retracement levels and pivot points as the price advances automatically
- Calculation and Analysis and Strategy for Buying and Selling Bollinger Bands
- Automatic Creation, Analysis, Calculation and Adjustment of Trend Lines
- Ichimoku periods
- Automatic Calculation and Analysis of Divergence, Trend, Price and Volume taking into account multiple factors such as: Trend Lines, MACD, Balanced Volume or "OBV", Relative Strength Index "RSI", Commodity Channel Index (CCI )
You could use my indicator to either:
1. Create summary Buy and Sell Alerts
2. Create Alerts with Customizable Conditions
3. Create Alerts and Automate these by means of webhook shipments
4. Open and Close Positions automatically through Alerts sent through webhook and conditioned on your platform by custom% profit, either take profit or stop loss
You can configure the following alerts in an unlimited way:
-Buy Signal Indicated by Atr
-Sale Signal Indicated by Atr
-Buy signal by volume price trend indicator (VPT)
-Sale signal by volume price trend indicator (VPT)
-Sar Parabolic -High
-Sar Parabolic - Baja
- Bullish divergence
-Bearly divergence
-Crossing moving averages
-Cross above the Downtrend of the Fibonacci Level 0.382
-Cross above the Bearish Trend of the Fibonacci Level 0.5
-Cross above the Bearish Trend of the Fibonacci Level 0.618
-Crossover above the Bullish Trend of the Fibonacci Level 0.382
-Crosses above the Bullish Trend of the Fibonacc Level 0.5
-Cross above the Bullish Trend of the Fibonacci Level 0.618
-Cross below the downtrend of the Fibonacci Level 0.382
- "Crossover below the downward trend of the Fibonacci Level 0.5
-Cross below the downtrend of the Fibonacci Level 0.618
-Cross below the uptrend of the Fibonacci Level 0.382
-Cross below the uptrend of the Fibonacci Level 0.5
- Cross below the uptrend of the Fibonacci Level 0.618
1. If you don't want to rely on a single truth from my indicator, combine this with either RSI, MACD, or ADX levels.
2. If you are going to use it for a leveraged trade, A) My indicator does not have the absolute truth, B) Try to assign a% of take profit or stop loss range to allow the price to move without closing your recommended trade in loss. 3 to 4% or greater than 1%
Postscript: Use it at your own risk, I have made this script based on my personal opinion and experience, which is not considered at any time a financial or investment advice or of any kind, which after reading this I free myself from Any financial responsibility for your personal decisions, what you read in any market or legal action will only be considered before any court, person, page, agency, broker, trader, tools, investors, developers or people of any field and of any situation such as If fidubit has given computer advice for educational purposes on the use of pine script, all investment in any type of economy, asset or financial markets is at risk of ups and downs, therefore you are fully responsible for your investment, administration, decision, analysis and use and you should use only your risk capital in the broker you choose

TradersHunt Buy & Sell Levels IndicatorThis indicator will plot dot lines that represent the support and resistance points or a key price where favourable action may take place.
This indicator is based on the concept of Fibonacci ratios. The dotted line represents different Fibonacci ratios of the script. The calculation for the ratios is arrived by considering a range based on the volatility of the script.
You may think it's another Pivot Point or Camarilla type level indicator, no, it is not, it is different.
It follows the Fibonacci ratio which makes it unique amongst all the available indicators.
How to Trade:
It can be used by traders to identify possible areas of support and resistance, which can then be used to determine optimal positions for stop-loss or profit target orders.
Green Level indicates buy price, a trader should wait for 15min candle to close above it and Red level can be used as SL if the trader is taking a long position. The Black colored levels above Green are Targets for taken Long Position. Similarly, a red-colored level indicates Sell value, and levels below it are targets for a short position.
It's not just the breakout indicator, but also a reversal indicator. which means if you are a safe trader you can wait for the breakout above the green line or breakdown below the red line.
However, if you are familiar with little technical analysis then you can treat the red dotted line as the buy zone and the green dotted zone as the sell zone based on the trend of the script.
You can keep trailing you Stop Loss once script moves into your direction. First step to do is to make our SL Cost to Cost and when it moves above TGT2, we can trail SL to TGT1 and so on. So, Keep your money management in check.
Fibonacci are earlier market turning points. Hence, they are natural choices for projecting support and resistance levels. Every fibo ratio is a potential support or resistance level. However, for effective trading, focus on major ratios which are highlighted with bold dotted lines.
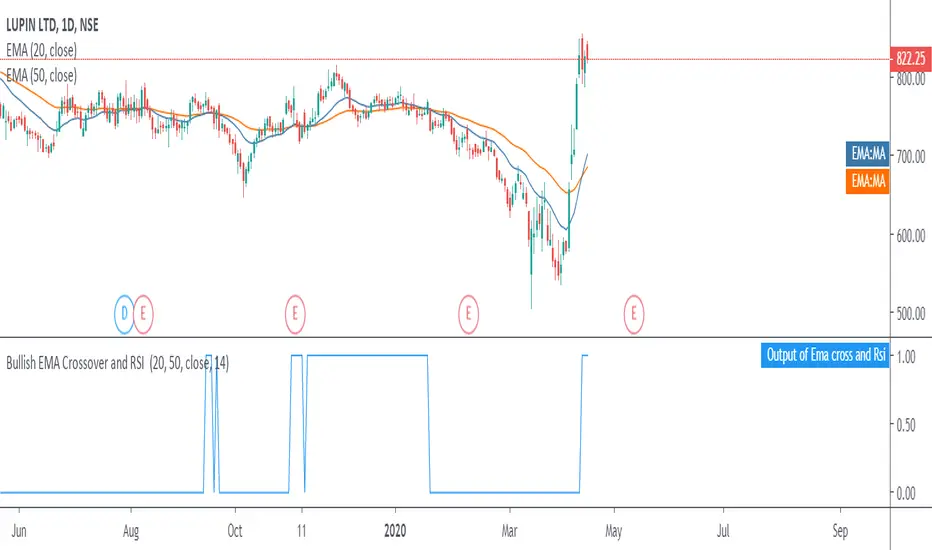
Moving Average Exponential crossover with bullish RSI signalsWhen the market is giving the signals for bullish trend, which shows the shorter period exponential(20) moving average crossing the longer period moving average(50), with a strength shown in the market i.e. RSI greater than 40.
So when all these conditions are met a buy signal is generated in output (Output of Ema cross and Rsi) having value as 1.
So a trader can enter into a long position when the value is 1 and exits a stock when value is 0.
This script is not to be used for selling the stocks in downtrend
Bollinger Band BreakoutIt is a long only strategy.
1. Buy when price breaks out of the upper band.
2. Exit has two options. Option 1 allows you to exit using lower band. Option 2 allows you to exit using moving average.
3. Option 1 preferred over option 2 if the instrument is highly volatile.
4. Slippage and commissions are not considered in the return calculation.

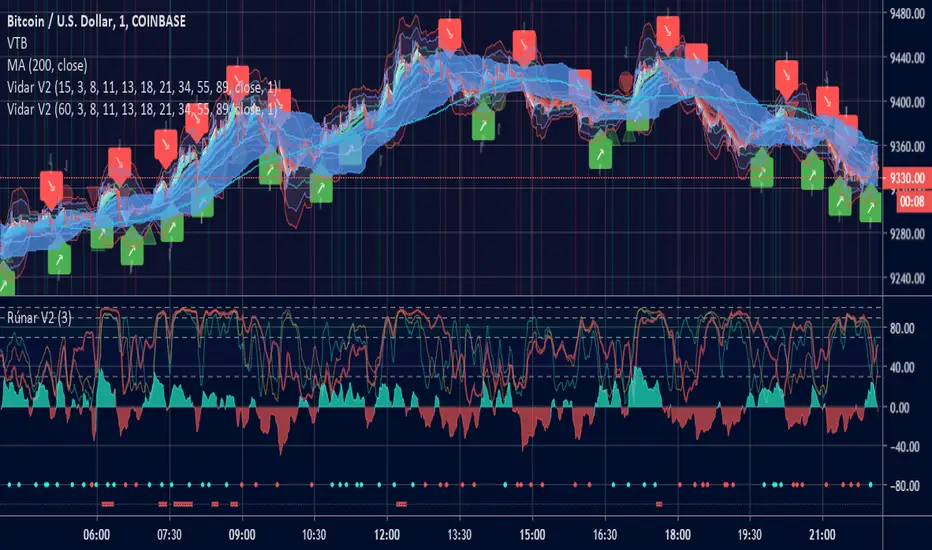
Vidar - Buy and Sell & Trend CipherHi guys, todays indicator comes from the original Odin but has seen some hefty modifications to make it far more accurate based on some recent indicators and learnings. The name comes from Vidar that avenged Odin (fitting as its predecessor).
Vidar has two gears (pawn/king) to help you understand the probability and size of the trade. Kings crowns are weighted to have a larger upside and is intended to inform the trader that a larger position can be taken if he wanted too. Pawns are more "scalp" like signals and should be treated with smaller trades or top up positions between King's crowns.
The indicator also has a simple EMA ribbon to help with trend identification as well as a manipulation trigger to help understand price action outside of signals generated. Green diamonds are bullish closes and red diamonds are very bearish closes.
As always if you want to discuss some TA or come chat about the indicators, or just hang out and chat crypto.
GR-Moving Average CrossA simple indicator that contains all the main Moving Averages you'll probably need.
This indicator can be used on any time frame you wish.
The default periods for the moving averages are 5, 10, 20, 50, 100 & 200.
However you can set these values to whatever works for you, for example 5, 8, 10, 21, etc.
Please let me know in the comments below which values you use the most, so that I can adjust the defaults accordingly.
The lines get darker and thinker the more periods the MA covers.
You can easily adjust the colours of the lines and their thickness too.
The current colours seem to work OK on both the light and dark TradingView themes, but please do make suggestions for better default value.
You can also choose between 7 different ways of calculating the moving averages:
!None = You don't want to see this line
SMA ( Simple Moving Average )
EMA ( Exponential Moving Average )
WMA ( Weighted Moving Average )
DEMA ( Double Exponential Moving Average )
TEMA (Triple Moving Average
HMA ( Hull Moving Average )
This indicator can also show basic buy & sell zones.
They work well after steep trends, but will give lots of poor signals in a sideways moving market.
I find that the sell signal is more reliable than the buy signal.
Use these indications with caution and definitely combine them with other data/indicators as they are only based on the moving averages.
Comments and suggestions are most welcome.
I'm available for hire to create custom indicators or to work on more complex projects.

Patrones de entrada/salida V.1.0 -BETA-Este algoritmo intenta identificar patrones o fractales dentro de los movimientos de precios para dar señales de compra o venta de activos.
