AutoPivot Levels with Alerts [ChartWhizzperer] – Dynamic EditionAuto-Pivot Levels 4 methods with alerts – Dynamic Edition
Now with
- Live Mode
- 4 Pivot Methods
- 7 Session Types (5m, 15m, 30m, Hourly, Daily, Weekly, Monthly)
- PineConnector-Ready Alerts!
Free, Open Source, Pine Script v6-compliant.
NEW: Live Mode (Ultra-Dynamic, Repainting) – Switchable in UI!
Instantly switch between Classic (session-based, repaint-free) and Live (rolling window, real-time, repainting) using the simple checkbox in the settings!
Live Mode recalculates all pivots on every tick/bar, using the current high/low/close for the chosen session (5m, 15m, 30m, hourly, daily, weekly, monthly).
Perfect for:
- Scalping and high-frequency trading
- Real-time bot/automation setups (PineConnector-ready)
- Fast-moving or breakout markets
Classic Mode: For traditional, stable levels based on confirmed session data – ideal for backtesting and trading history.
Four Calculation Methods (Choose What Fits YOU)
1. Classic
Standard pivot calculation.
Based on previous session’s High, Low, Close.
Simple, proven, and suitable for any asset.
2. Fibonacci
Projects levels using Fibonacci ratios of the prior session’s range.
Great for traders who want to align pivots with fib retracements and extensions.
3. Camarilla
Uses unique multipliers for support/resistance, focusing on mean reversion and volatility.
Popular among futures and forex day traders.
4. Woodie
Puts extra weight on previous Close for more responsive pivots.
Often used in trending or choppy conditions.
Switch methods anytime in the UI – the script recalculates instantly and keeps your chart clean!
Level-Specific Alerts – PineConnector Ready!
Dedicated alert for EVERY level and direction (Up/Down):
Pivot (P), R1, R2, R3, S1, S2, S3
No configuration hassle:
All alerts are pre-defined in the TradingView Alert Panel and work across all session types (5m → monthly).
Machine-readable message format:
PIVOT=R1 DIR=UP SYMBOL={{ticker}} PRICE={{close}}
Direct plug-and-play with PineConnector, webhooks, Discord, Telegram, bots, and other automation tools.
Never miss a breakout, reversal, or key support/resistance touch!
Powerful Customization & Performance
- Session selection: 5m, 15m, 30m, Hourly, Daily, Weekly, Monthly (choose what suits your trading style).
- Show/hide any level (Pivot, R1–R3, S1–S3) for minimal chart clutter.
- Color selection for each level to match your theme or highlight key pivots.
- Auto-cleanup: Old lines and labels are cleared on every recalculation or session change for maximum performance and visual clarity.
- Zero runtime errors: Strict Pine Script v6 practices for stability.
How To Use – Quick Start
1) Add the indicator to your TradingView chart.
2) Pick your calculation method (Classic, Fibonacci, Camarilla, Woodie).
3) Set session type (5m, 15m, 30m, Hourly, Daily, Weekly, Monthly).
4) Switch between Classic and Live Mode with a single click in settings.
5) Customize your levels (on/off, colors).
6) Open the Alert Panel, select any pre-configured alert (e.g. "R2 Cross Down"), and go live!
7) Connect with PineConnector or any webhook system instantly using the pre-formatted alert messages.
Who Is It For?
- Active scalpers & bot traders: Live Mode + PineConnector-ready alerts = instant, automated reactions.
- Swing and position traders: Use Classic Mode for stable, repaint-free levels.
- Strategy developers: Seamless integration into automated and manual trading workflows.
License & Community
Open Source, Non-Commercial:
Free for personal & educational use under CC BY-NC-SA 4.0.
Feedback, bug reports & ideas:
Drop a comment, or contact me for feature requests.
Trade smart. Trade dynamic. Unlock the true power of pivots – with ChartWhizzperer!
Camarillapivot

GOLDEN Trading System by @thejamiulThe Golden Trading System is a powerful trading indicator designed to help traders easily identify market conditions and potential breakout opportunities.
Source of this indicator :
This indicator is built on TradingView original pivot indicator but focuses exclusively on Camarilla pivots, utilising H3-H4 and L3-L4 as breakout zones.
Timeframe Selection:
Before start using it we should choose Pivot Resolution time-frame accordingly.
If you use 5min candle - use D
If you use 15min candle - use W
If you use 1H candle - use M
If you use 1D candle - use 12M
How It Works:
Sideways Market: If the price remains inside the H3-H4 as Green Band and L3-L4 as Red band, the market is considered range-bound.
Trending Market: If the price moves outside Green Band, it indicates a potential up-trend formation. If the price moves outside Red Band, it indicates a potential down-trend formation.
Additional Features:
Displays Daily, Weekly, Monthly, and Yearly Highs and Lows to help traders identify key support and resistance levels also helps spot potential trend reversal points based on historical price action. Suitable for both intraday and swing trading strategies.
This indicator is a trend-following and breakout confirmation tool, making it ideal for traders looking to improve their decision-making with clear, objective levels.
🔹 Note: This script is intended for educational purposes only and should not be considered financial advice. Always conduct your own research before making trading decisions.

Waddah Attar Weekly Camarilla Pivots [Loxx]Waddah Attar Weekly Camarilla Pivots is an indicator built by Ahmad Waddah Attar that draws weekly Camarilla over lower timeframes.
What are Camarilla pivots?
Camarilla Pivot Points is a math-based price action analysis tool that generates potential intraday support and resistance levels. Similar to classic pivot points, it uses the previous day's high price, low price, and closing price.
Camarilla Pivot Points is a modified version of the classic Pivot Point. Camarilla Pivot Points were introduced in 1989 by Nick Scott, a successful bond trader. The basic idea behind Camarilla Pivot Points is that price has a tendency to revert to its mean until it doesn’t. What makes it different than the classic pivot point formula is the use of Fibonacci numbers in its calculation of pivot levels. Camarilla Pivot Points is a math-based price action analysis tool that generates potential intraday support and resistance levels.
Details
-Used for intraday trading to identify support/resistance levels
-Restricted to timeframes 4 hours and below
-Unlike most versions of Weekly Camarilla Pivots, this version allows you to customize the Fibonacci levels

Camarilla PivotsA slimmed down/cleaner version of the "Pivot Points Standard" indicator. This is for Camarilla pivots only. The S and R pivots are renamed to L/H and the colors of pivot 1 and 2 are faded out by default since those pivots are less used in the Camarilla trading system. They can also be disabled of course.

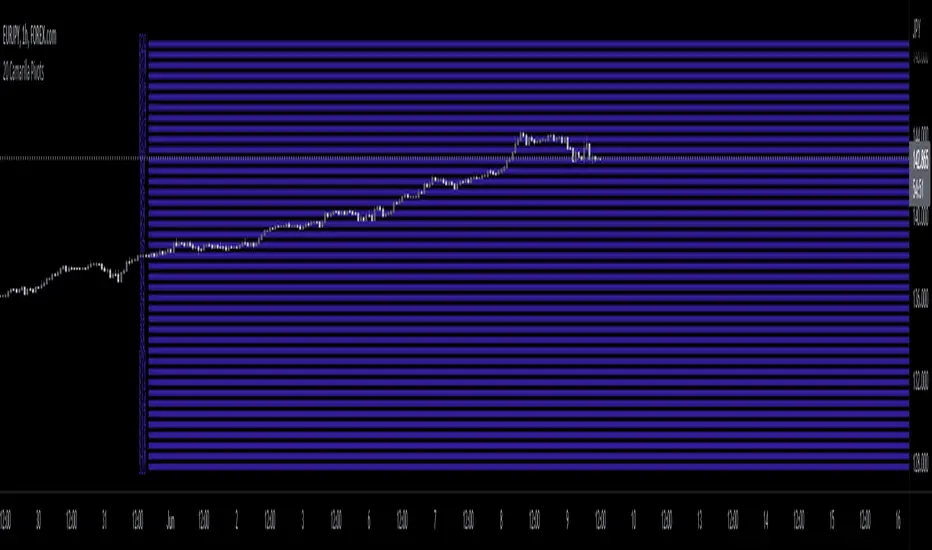
20 Camarilla Pivot PointsThis indicator plots 20 Camarilla pivot points above and below the pivot based on the selected time frame. This is useful when price goes between the standard 3 and 4 pivots and above 4. Note that the normal 4 pivot point is labeled as 6 in this indicator. You can change the color of each set of pivots so you can mark the standard Camarilla pivots if you wish. The image is using monthly Camarilla pivots on a 1 hour time frame.
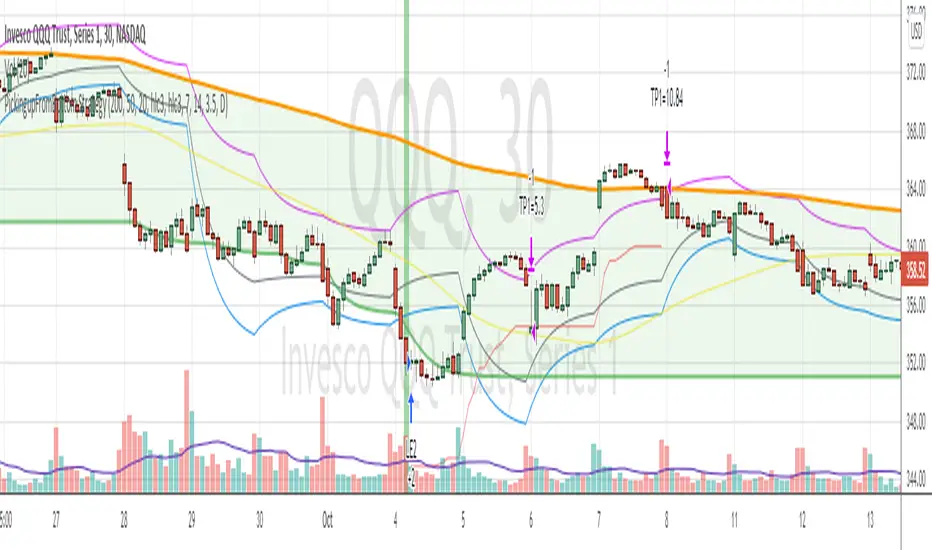
PickingupFromBottom StrategyPickingupFromBottom Strategy is variation of my earlier strategy HiLoBand
This strategy uses lowest lows of 200 and ema of that with length 7. Lets call this ema200Lows line
wait for price to close below ema200Lows line
Then using camarilla pivot points , wait for camariall centerpoint (actally ema 9 of that ) crossing up the ema200Lows line.
When this condition is met background color is changed to green (visual alert)
and BUY Long is taken
Exit
When the price crosses below the Camarilla R4 line or Camarilla S3 line
Tested with SPY and QQQ on 30 mins chart.
Warning
This strategy is published for educational purposes only.