The Strat - Multi-Timeframe Combo Analyzer## 📊 The Strat - Multi-Timeframe Combo Analyzer
This open-source indicator implements **The Strat** methodology, a universal price action framework developed by Rob Smith (@RobInTheBlack).
---
### 🎯 What is The Strat?
The Strat categorizes every candle into one of three scenarios based on its relationship to the previous bar:
| Type | Name | Definition |
|------|------|------------|
| **1** | Inside Bar | High < Previous High AND Low > Previous Low |
| **2** | Directional | Breaks only one side (2↑ = broke high, 2↓ = broke low) |
| **3** | Outside Bar | Breaks BOTH previous high AND low |
By tracking these bar types across timeframes, traders can identify actionable setups with defined entry triggers and target levels.
---
### ✨ Features
**Daily Timeframe Analysis:**
- Real-time 3-bar combo detection (2-1-2, 3-1-2, 1-2-2, etc.)
- Pattern classification: Bullish/Bearish Continuation or Reversal
- Entry and Target levels based on Strat rules
- Pattern status: ACTIONABLE, IN-FORCE, TRIGGERED, or WATCHING
**ATR Context:**
- Range % used (how much of daily ATR has been consumed)
- Entry quality assessment (Excellent → Exhausted)
- Day type classification (Quiet → Trend Day)
- Remaining range estimation
**15-Minute Analysis:**
- Separate combo tracking for intraday precision
- Pattern detection on lower timeframe
**Visuals:**
- Customizable info tables
- Entry/Target horizontal lines
- Signal labels on chart
- Alert conditions
---
### 🔧 How to Use
1. Look for **ACTIONABLE** patterns - these are setups waiting for a trigger
2. Entry triggers when price breaks the designated level
3. Target is the next logical Strat level (typically prior bar's high/low)
4. Use **Range%** to assess if there's room left in the daily range
5. Combine Daily and 15-Min combos for trade confluence
---
### ⚠️ Disclaimer
This indicator is for **educational purposes only**. It does not constitute financial advice or guarantee profitable trades. Trading involves substantial risk of loss. Past performance is not indicative of future results. Always conduct your own research and trade responsibly.
---
### 🙏 Credits
**The Strat** methodology was created by Rob Smith (@RobInTheBlack).
This implementation is open-source. Feel free to study, modify, and improve the code!
Candlestick-analysis

Next Candle PredictorAdvanced TradingView Indicator for Precise Buy and Sell Signals
Overview:
The Predicta Futures - Next Candle Predictor is a cutting-edge TradingView indicator designed to forecast the next candle's direction in futures and cryptocurrency markets. Leveraging a multi-indicator confluence strategy, this tool provides traders with actionable long and short prediction percentages, enhanced by dynamic ADX-based thresholds and visual projection candles. Ideal for scalping, day trading, or swing trading on platforms like MEXC or Binance futures, it combines Supertrend, MACD, RSI, Stochastic, ADX, and volume analysis to deliver high-probability buy and sell signals while minimizing false positives.
Key Features:
• Multi-Indicator Confluence Scoring:
Integrates Supertrend for trend direction, EMAs (8, 21, 50) for alignment, MACD for momentum crossovers, RSI for overbought/oversold conditions, Stochastic for divergence detection, ADX for trend strength, and volume ratios for confirmation. A customizable confluence score (0-6) ensures signals meet user-defined criteria, reducing whipsaws in volatile markets.
• Dynamic Prediction Thresholds:
ADX-driven adjustments lower the required prediction percentage (e.g., 60% in strong trends) for "PERFECT TIME" entries, adapting to market conditions like ranging or trending phases.
• Visual Analysis Table:
A sleek, color-coded dashboard displays progress bars for each indicator, prediction percentages, and status (e.g., "PERFECT TIME" or "WAIT"). Supports long and short analyses with intuitive ASCII bars for quick scans.
• Projection Candles:
Simulates potential next-candle outcomes with volatility-scaled (via Bollinger Bands width) green long and red short candles, aiding in visualizing price targets.
• Buy/Sell Signals and Alerts:
Generates labeled "BUY" and "SELL" arrows on EMA crossovers within confirmed trends, with separate alerts for basic signals and high-confluence "PERFECT TIME" opportunities.
• Customizable Inputs:
Adjust ATR periods, Supertrend factors, minimum confluence scores, and volume ratios to tailor the indicator for stocks, forex, or crypto perpetual futures.
How It Works:
This TradingView script calculates long and short scores using weighted contributions from key indicators, normalizing them into prediction percentages. A confluence check—factoring trend, EMA alignment, MACD, Stochastic, volume, and ADX—triggers "PERFECT TIME" only when conditions align robustly. For example:
• In a downtrend (Supertrend red), with bearish MACD and Stochastic, and sufficient volume, the indicator highlights short opportunities.
• Dynamic thresholds ensure aggressive entries in strong trends (ADX >25) and conservative ones in weak trends.
• Backtested for reliability, it excels in identifying reversals and continuations, making it a must-have for traders seeking an edge in futures trading strategies.
Usage Instructions:
1. Add the indicator to your TradingView chart. (Search: Next Candle Predictor)
2. Customize settings via the inputs panel (e.g., set minConfluence to 5 for stricter signals).
3. Monitor the analysis table for predictions and confluence scores.
4. Act on "BUY/SELL" labels or "PERFECT TIME" alerts, combining with your risk management.
5. Enable projection candles for visual forecasting of the next bar.
Compatible with all timeframes, from 1-minute scalping to daily swings. Note: This is not financial advice; always verify signals with additional analysis.
Join thousands of traders enhancing their strategies—add it to your charts today and elevate your trading performance!
Please rate and review if it boosts your trades!
Thank you!

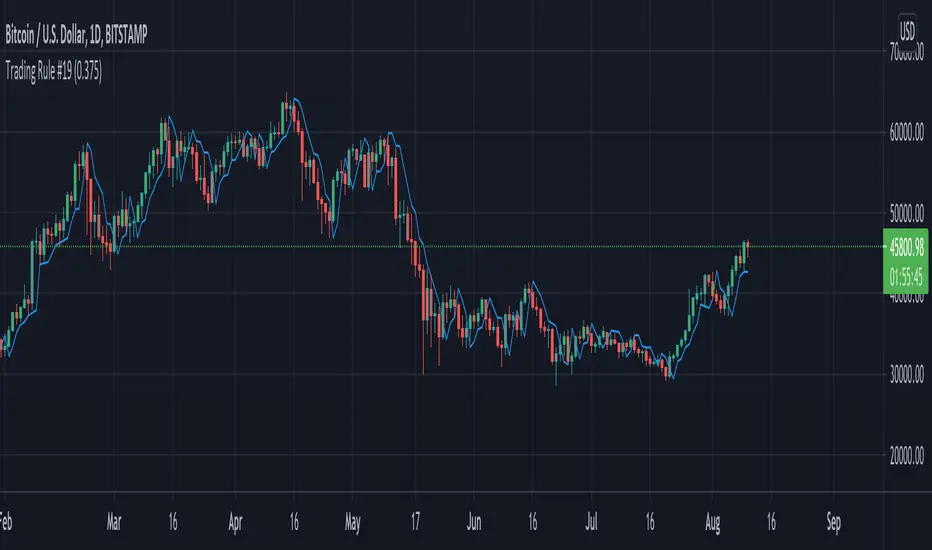
Trading Rule #19This script is based on Trading Rule #19 from Chester Keltner's book How To Make Money On Commodities. It is best applied to candlestick charts with longer time frames and plans with minimal losses (i.e. swing trades). The rule is based on "Key" trend days (this is applied to daily charts in the book).
An initial Key-Up day is established on the third day of 3 consecutive new highs. Subsequent key-up days are determined as follows:
1. The first day following an initial key-up day trades 0.375% above the previous key-up day
2. The second day or any following day trades 0.125% above the previous key-up day
An initial Key-Down day is established on the third day of 3 consecutive new lows. Subsequent key-down days are determined as follows:
1. The first day following an initial key-up day trades 0.375% below the previous key-down day
2. The second day or any following day trades 0.125% below the previous key-down day
Green candles are considered up-trend, red candles are down-trend. Gray candles are undecided - when there is a new high and low in the same time frame, when there is no new high or low in that time frame, or the order price was cleared.
Order prices are represented as a blue line, with some days being "na" when order prices remain unchanged. On key-up days, orders are placed 0.375% below the low of the previous key-up day or the day previous (whichever is lower). Order prices on key-down days are placed 0.375% above the high of the previous key-down day or the day previous (whichever is higher).
The tolerance setting mainly effects the plot point of order price, at a certain point key-trend rules will take priority over order price (meaning if tolerance is high enough, order price will have no effect on determining key-trends).