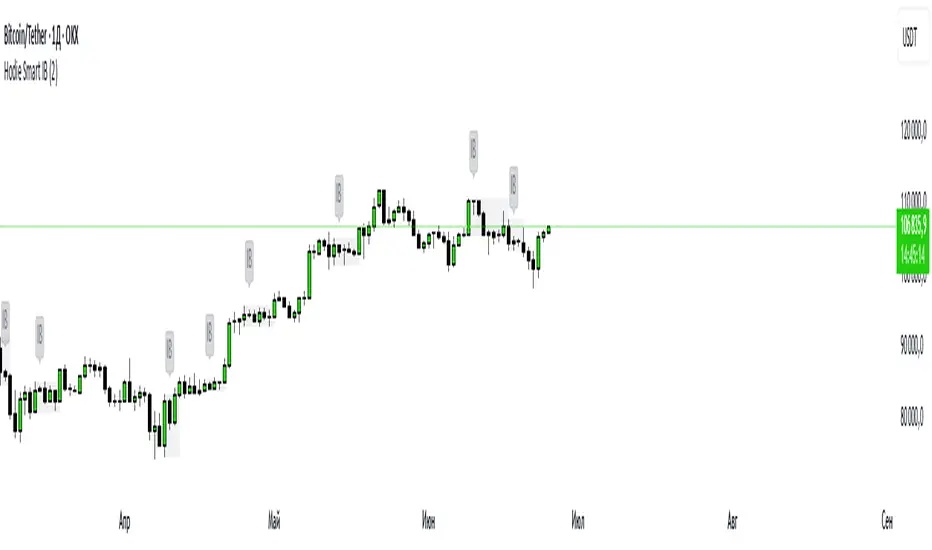
Buying and Selling Pressure Raw Multi (TG Fork)Visualize raw buying and selling pressure via 3 different calculation methods, all superimposed with dynamic rescaling.
Buying and selling pressure is the concept of quantifying the disproportion between buying and selling. In practice, there is no single definitive way to calculate it.
This indicator is a merge to display three different methods to calculate buying and selling pressure, with automatic visual rescaling to superimpose the three simultaneously, updated to PineScript v5, and with some additional improvements for speed and calculation precisions, and instead of the EMA, other types of moving averages can be used.
I primarily made it for my own needs, but as always, I like sharing with the community, as maybe others may find this useful too.
How to use:
* As often, the goal is to get as many of the 3 signals concur together to get a stronger aggregated signal.
* First signal: If the green bars on the histogram are bigger than the red ones, then there is more buying pressure, and vice versa.
* Second signal: If the background is green, there is more buying pressure, and vice versa if the background is orange. The yellow and green lines define the background color, but they are by default hidden for a less cluttered visual experience.
* Third signal: If the cloud is blue, there is more buying pressure, and the bigger the cloud, the more momentum there is for it to stay (and more difficult it is to reverse to selling pressure). If the cloud is red, there is more selling pressure.
If you like this indicator, please don't give me any credit, instead please show some love to the original authors (in no particular order):
ceyhun:
daytraderph (I could not find the link to the original script, the page is inaccessible?):
www.tradingview.com
fract:
Analisis Candlestick
DojiCandle body size RSI-SMMA filter MTF
Hi. I was inspired by a public script written by @ahmedirshad419, .
I thank him for his idea and hard work.
His script is the combination of RSI and Engulfing Pattern.
//------------------------------------------------------------
I decided to tweak it a bit with Open IA.
I have changed:
1) candle pattern to DojiCandle Pattern;
2) I added the ability for the user to change the size of the candlestick body;
3) Added SMMA 200;
4) Changed the colour of SMMA 200 depending on price direction;
5) Added a change in the colour of candlesticks, depending on the colour of the SMMA 200;
6) Added buy and sell signals with indicator name, ticker and close price;
7) Added ability to use indicator on multi time frame.
How it works
1. when RSI > 70 > SMMA 200 and form the bullish DojiCandle Pattern. It gives sell signal
2. when RSI < 30 < SMMA 200 and form the bearish DojiCandle Pattern. It gives buy signal
settings:
basic setting for RSI, SMMA 200 has been enabled in the script to set the levels accordingly to your trades
Enjoy
Pin Candle DetectionPin candles are a variation of hammer candles that are useful in technical analysis . In particular, when combined with volume profile studies, they can be a powerful set up for long entries or other decision making.
For example, when looking at volume profiles, a long entry would be a fair value area (i.e. 40%) below the close of a pin candle. When combined with a support level , the set up is stronger.
While most scripts look for hammer candles, pin candles are somewhat different in that the length of the wick is significant.
This script and its parameters was built for ES futures 15 min chart in mind.
This script is unique in that it allows for the below parameters to be adjusted to suit other instruments and timeframes:
1. Fib level: Candle must close within a certain retracement level). My preference is 0.55. Some traders like 0.5, while others prefer 0.33
2. Wick length: Pin candles differ from pure hammers in that the length of the wick must be significant. My preference is 7 points on ES (as in $ and not ticks)
Add this script to your alerts to no longer miss these set ups.
Swing Indicator (2 before, 1 after) v2 with Dong-DangFeatures
Detection Swing (swing HIGH is the highest bar among 2 bars before and 1 bar after, and swing LOW is the lowest bar among 2 bars before and 1 bar after)
Dong-Dang (The line plot switch between a swing HIGH and LOW ==> represents the price movement)
Fixes
fix swing detection from the last version when there are 2 or more bars that have the same high or low price
======== ======== ========
ฟีเจอร์
การจับสวิง (จะเป็นสวิง HIGH ก็ต่อเมื่อแท่งนั้นสูงกว่า 2 แท่งก่อนหน้า และ 1 แท่งด้านหลัง, และจะเป็นสวิง LOW ก็ต่อเมื่อแท่งนั้นต่ำกว่า 2 แท่งก่อนหน้า และ 1 แท่งด้านหลัง)
ด๊องแด๊ง (คือเส้นที่ลากสลับไปมาระหว่างสวิง High และ Low ==> ใช้เพื่อดูการเคลื่อนที่ของราคา)
สิ่งที่แก้ไข
แก้ไขการจับสวิงจากเวอร์ชันก่อนหน้า ในกรณีที่มีแท่งเทียน 2 แท่ง หรือมากกว่า มีค่า high หรือ low เท่ากัน
======== ======== ========
Credit: Bravo Trade Academy
2U2DFlipHappy to contribute to the community request for indicators that TheStrat community find useful, I have published the requested 2U/2D flip indicator with built in 'alert' feature.
Adding this indicator to your chart will allow you to use the awesome Tradingview 'alert' functionality to register an alerts when either of these two conditions are true:
- When the candle colour of TheStrat 2U green candle turns RED
- When the candle colour of TheStrat 2D red candle turns GREEN
The significance of this event is an indication that price might have reversed and is more applicable on higher timeframes .
Explanation of 'TheStrat' trading technique
‘TheStrat’ technique works off the basis of labelling whether the focus candle did or did not break any of the previous candles high or low values. There are three possible label definitions; either a 1 candle, 2 candle or a 3 candle.
1 bar (inside) - If price movement on the new candle remains within the high and low of previous candle.
3 bar (outside) – If price movement went above both the high and the low of the previous candle.
2 bar (directional) – If price movement only broke with the high (called a 2-up) or if price movement only broke the low of the previous candle (called a 2-down).
How does the indicator work?
This indicator will allow the user to be alerted when this colour change happens on any ticker and timeframe you have added the indicator to and then register an alert. The key decisions are which TICKER and which TIMEFRAME to register the alert. It will alert for both these conditions within the single alert.
When a registered alert is running it will continually monitor for these conditions and once per bar it will immediately generate the alert notification using the existing built-in TradingView alert feature. This indicator is not market or timeframe specific, in fact this alerting indicator can be used to register alerts on multiple tickers and timeframes simultaneously.
Example of how to use the indicator
Assume you are interested in being alerted for any colour changing candle on AAPL on the 30min timeframe. You would simply go to that chart (APPL on 30 min), add '2U2DFlip' indicator to the chart, then using the built-in TradingView - 'Create Alert' feature to register the alert that will listening to '2U2DFlip' indicator monitored events. In this example the alert will specifically trigger if it finds a 2U candle turning red or a 2D candle turning green and sends the alert allowing you to jump to the chart to review.
Description of the script
The script defines two conditions that incorporate the specific definition of TheStrat 2U and 2D candles, meaning, that in relation to the previous candle it only 'broke' one side of the previous candle and then adds another condition that monitors if the colour changes (close > open) of the current candle.
How is this useful to a trader?
The 2U and 2D candles are known as 'directional' candles in TheStrat community so the fact that a directional candle has 'changed' direction is a significant indication of a reversal. When this event happens a trader would be notified and is in a position to determine if a reversal play might be in order.
Note to moderators
This code is my own code, based on my other popular indicators. It encompasses the definitions of TheStrat community and trading style and was requested by the community users that trade using TheStrat technique. The reason for the source being protected is that it contains my own method of defining TheStrat and source code of my paid indicator.
Good Luck with trading and I hope this indicator helps to increase the profitability of your portfolio. Happy Trading.
Vector MACDCalculates five vector moving averages of different periods and averages them.
Origin moving average is ALMA from the mid point of the candles (hl2.)
Vector moving averages are the difference between Hull Moving Averages and the Origin MA.
It is a momentum indicator that shows when long term and short term trends agree with the move. It moves stronger, when all the vectors point to the same direction.
Look for divergence to detect trend changes.
Cuck WickAcknowledgement
This indicator is dedicated to my friend Alexandru who saved me from one of these scam cuck wicks which almost liquidated me.
Alexandru is one of the best scalpers out there and he always nails his entries at the tip of these wicks.
This inspired me to create this indicator.
What's a cuck wick?
It's that fast stop-hunting wick that cucks everyone by triggering their stop-loss and liquidation.
Liquidity is the lifeblood of stock market and liquidation is the process that moves price.
This indicator will identify when a liquidity pool is getting raided to trigger buy or sell stops, they are also know as stop-hunts.
How does it work?
When market consolidates in one direction, it builds up liquidity zones.
Market maker will break out of these consolidation phases by having dramatic price action to either pump or dump to raid these liquidity zones.
This is also called stop-hunts or liquidity raids. After that it will start reversing back to the opposite direction.
This is most noticeable by the length of the wick of a given candle in a very short amount of time and the total size of the candle.
This indicator highlights them accordingly.
Settings
Wick and Candle ratio works with default values but finetune will enhance user experience and usability.
Wick Ratio: Size of the wick compared to body of a candle.
Adjust this to higher ratio on smaller timeframe or smaller ratio on bigger timeframe to your trading style to spot a trend reversal.
Candle Ratio: The size of the candle, by default it is 0.75% of the current price.
For example, if BTC is at 20,000 then the size of the candle has to be minimum 150.
This can be fine tuned to bigger candle size on higher time frames or smaller for shorter timeframe depending on the trade type.
How to use it?
This indicator will identify when a liquidity pool is getting raided to trigger buy or sell stops, they are also know as stop-hunts. It can be used of its own for scalping but there are also a good few indicators which would most definitely help to confluence bigger timeframe trades.
Scalp
This indicator shows the most chaotic moments in price action; therefore it works best on smaller timeframes, ideally 3 or 5 minute candle.
- Wait for the market to start pumping or dumping.
- Current candle will change colour (Bullish/Bearish).
- Enter trade as soon as price starts to reverse back.
- Place the stop-loss outside of the current candle.
- Wait for the cuck wick to appear as confirmation.
Price is very chaotic during a liquidity stop-hunt raid but there is a saying:
"In the midst of chaos, there is also opportunity" - Sun-Tzu
Since this is a very high risk, high reward strategy; it is advised to practice on paper trade first.
Practice until perfection and this indicator would be the perfect bread and butter scalp confirmation.
Fair Value Gap
FVG strategy is the most accurate in conjunction with this indicator.
Normally price would reverse after consuming fair value gaps but often it's difficult to know when and where.
This indicator would identify those crucial entry points for reverse course direction of the price action.
Support and Resistance
This indicator can also be used in conjunction with support and resistance lines.
Generally the cuck will go deep below the support or spike much further up the resistance lines to liquidate positions.
Bollinger Bands
Bolling Bands strategy would be to wait until the price breaks out of the band.
Once the wick is formed, it would be an ideal entry point.
Script change
This is an open-source script and feel free to modify according to your need and to amplify your existing strategy.
Futures All List Candle Analysis - FALCAIn this command; There is an alphabetical list of USDS-M coins with the USDT PERP extension on the Binance Futures side.
There are 13 lists in total. Each list contains 39 data. Due to data limitation, 13 lists are formed. There are 13 coins in the first 11 of the lists. The 12th list contains 3 coins. The last list (FAVORITE LIST) is CRYPTOCAP:TOTAL, BINANCE:BTCUSDTPERP, BINANCE:BTCDOMUSDTPERP as standard. You must add 10 coins to the final list.
The lists show data for the time period you selected.
Explanation of the (C/H) header: Close /High takes a maximum value of 1. As long as this value is 1, a price increase is observed.
Explanation of the (C/O) header:
Close /Open can be greater than ,1. In this case, a price increase is observed.
Close /Open can be less than 1. In this case, a price decrease is observed.
The value Close /Open can be equal to 1. In this case, price stability is observed.
Explanation of the (C/L) header: Close /Low takes a minimum value of 1. As long as this value is 1, a price decrease is observed.
Coins with a price decrease are shown in red.
Coins with a price increase will turn green.
***NOTE: For this command to work, you must first add 10 favorite coins to the "FAVORITE LIST".
Engulfing Pinbar [serkany88]This is an experimental candlestick pattern that combines pinbars and engulfing patterns as my own implementation. These signals can be used as a possible reversal points based on timeframe used or set wick size. Of course these signals should never be used on their own but rather can be used as another confluence of possible entry signal.
Functional and Manual alerts provided with simple and clean code.
TLDR: Use as a possible reversal point for your entries in combination with your trend and volatility filters. Green means possible bullish move, Red means possible bearish move.
AutoBF by Tren10xBroadening Formation is a powerful technical analysis tool that is characterized by two converging trendlines that widen over time. This pattern typically signals a period of volatility and uncertainty in the market and can indicate a potential reversal in trend direction.
This script uses advanced algorithms to automatically detect and plot broadening formations on your chart, making it easy to identify these patterns and potentially profit from them, all while saving you time from drawing them yourself. With customizable settings, this indicator is a must-have tool for any trader looking to take advantage of this powerful chart pattern.
Features:
● Automatically detects and plots broadening formations on any chart within TradingView
● Customizable settings for greater flexibility and control
● Choose to draw your broadening formation from the outside bar to the "Previous Candle" or "Compound Candle" aka to the previous lowest/highest candle within the outside bar.
● Clear visual display of broadening formations and easy identification
● Compatible with all markets and timeframes, from stocks and forex to cryptocurrencies and commodities
● Designed for both novice and experienced traders, with user-friendly interface and comprehensive documentation
● By default, the year will look back 75 years, the quarter will look back 20 years, the month will look back 7 years, the week will look back 3 years, and the day will look back 90 days. However, you now have the ability to change these at your will.
● Added the ability to enable Broadening Formations on the 6 Month, 2 Month, 2 Week, and 2 Day charts.
● ALERTS! Receive timely notifications when the price breaches or activates a broadening formation.
All Timeframes available:
● Year
● 6 Month
● Quarter
● 2 Month
● Month
● 2 Week
● Week
● 2 Day
● Day
tinyurl.com
Predicting future outcomes is impossible. Nobody knows what the future will bring. With this Broadening Formation Indicator, you will have the edge you need to identify potentially profitable trading opportunities and make more informed decisions in the markets.
Regards,
Tren10x
Disclaimer: It is essential to note that returns on investments are not guaranteed, and investors should exercise prudence in conducting thorough due diligence before making any investment decisions
I would like to express my gratitude to my wife for her meticulous testing and insightful contributions throughout the course of this project. Additionally, I extend my appreciation to the esteemed Alpha Pack Group, whose exceptional acumen and investment expertise have been instrumental in the success of this endeavor.
Footprint ClassicThe Volume Footprint chart is analyzing volume data contained within candles and split it into two components - Up and Down volume. This analysis is similar to how Volume Profile evaluates volume data from a portion of the chart.
This script can be used by any user. You do not need to have PRO or PREMIUM account to use it.
As a user, you have the flexibility to select the desired level of data precision for the Volume Footprint analysis. We highly recommend using the highest precision possible, as it provides the most accurate results. However, it's important to keep in mind that Trading View has several limitations and not all levels of precision are available on all intervals. The higher the precision, the shorter the history of available data.
If, after adding the script or changing the precision, you encounter an error message stating "'The study references too many candles in history'", it may be necessary to reduce the precision level in the script settings to resolve the issue.
This script is a part of the "Volume Footprint" toolkit, which includes:
I. Footprint chart visualization scripts in two variants:
⠀⠀Volume Footprint - Presenting volume data on both sides of the candle.
⠀⠀Volume Footprint Classic - Presenting volume data on the right side of the candle.
II. Supporting tools:
⠀⠀Volume Footprint Statistics - Script presents, in tabular form, basic statistics calculated from candle volume data, such as Delta, min Delta, max Delta and more. It can support both Volume Footprint and Volume Footprint Classic.
⠀⠀Volume Footprint Candles - Tool drawing candles adapted for footprint chart scripts.
III. Tools dedicated to more detailed analysis:
⠀⠀Volume Delta - A candle chart illustrating changes in delta values.
⠀⠀Volume Cumulative Delta - A candle chart ilustrating changes in cumulative delta values.
⠀⠀Volume Delta In Candle - A line chart showing changes in delta values over a period equal to the chart interval.
⠀⠀Volume Cumulative Delta in Interval - A line chart showing changes in cumulative delta over a period equal to the chart interval.
Script with limited access, contact author to get authorization
User Interface:
The script groups Up and Down volume into slots based on price. The height of the slots is controlled by the "Slot height" parameter in the settings. Each slot has the following configurable features:
Text - A label that displays the value. You can choose from:
⠀- - Hidden
⠀V - Slot Volume (UP + Down)
⠀V% - Slot volume as percentage of Candle volume
⠀UD - Up and Down volume
⠀UDI - Up and Down volume + Imbalance symbols.
⠀Δ - Delta (Up - Down Volume)
⠀Δ% - Delta as percent of slot volume (from -100% to 100%)
Border - Highlight slots with border color. You can chose from:
⠀- - Hidden
⠀C - Constant color
⠀POC - Slot with biggest volume
⠀V - Slot volume compared to other slots in that candle
⠀VA - Value area, highlights slots forming the value area
⠀Δ - Delta is the slot.
Background - Highlight slots with background color. You can pick one of:
⠀- - Hidden
⠀C - Constant color
⠀POC - Slot with biggest volume
⠀V - Slot volume compared to other slots in that candle
⠀VA - Value area, highlights slots forming the value area
⠀Δ - Delta is the slot.
Imbalances symbols:
Before the Down Volume, the following imbalance symbols may appear:
⠀↓ - 3 times
⠀↡ - 5 times
⠀⇊ - 10 times
After the Up Volume the following imbalance symbols may appear:
⠀↑ - 3 time
⠀↟ - 5 times
⠀⇈ - 10 times
Above the candle, the following basic statistics can be shown:
"V:" - Row with volume statistics:
⠀∑ - Total volume ,
⠀Δ - Difference between Up and Down Volume .
⠀min Δ - The smallest difference between Up and Down Volume in that candle
⠀max Δ - the biggest difference between Up and Down Volume in that candle
Script settings:
Slot height = 10^ - Price slot height on the chart, recorded as a power of 10, which means:
⠀ 0 - 1$
⠀ 1 - 10$
⠀ 2 - 100$
⠀ 3 - 1000$
⠀-1 - 0.1$
⠀-2 - 0.01$
⠀-3 - 0.001$
Data precision - One of 6 standard levels of data precision: ▉▇▆▅▃▁, where ▉ means the highest precision and ▁ the lowest available precision and two special values "W" and "M" dedicated for biggest intervals. The highest precision should be available for 15-minute chart, but for a 1D chart, it may hit TradingView limitations and the script will not be launched by the platform with error: "'The study references too many candles in history'". The general recommendation is to use the highest available precision for a given instrument and interval.
Precise warnings - An option to show warnings about missing volume in candle footprint (warning connected with one of TradingView limitations).
Text - Picking what king of info is on label:
⠀- - Hidden
⠀V - Total slot Volume
⠀V% - Slot volume as % of Candle volume
⠀UD - Up and Down volume
⠀UDI - Up and Down volume + Imbalance symbols.
⠀Δ - Delta
⠀Δ% - Delta as percent of slot volume
Centered - If checked volume labels are stick to candle (centered), if not they are alligned to right.
Border, Background:
⠀- - Hidden
⠀C - Color1
⠀POC - Slot with biggest volume
⠀V - Slot volume compared to other slots in that candle
⠀VA - Value area, highlights the slots forming the value area
⠀Δ - Delta is the slot, color1 is used when volume Up is at least 10% bigger, color2 is used when Volume Down is at least 10% bigger
Filter - Filtering option than allow hinding labels with small values:
⠀0 - filter turned off.
⠀1-5 - filtering with transparency
⠀6-10 - Filtering with hiding values
Show zeros - Option to show zeros or leave empty spaces
Draw candles - Option to draw candles that fit the volume labels, and 2 fields to choose the color of up and down candles. It is recommended to hide chart candles and use candles adapted to the footprint chart. TradingView has a bug and candles are drawn under the slots. If you choose a non-transparent background or border, they may be invisible. If possible (free accounts have a limit of 3 scripts), it is recommended to use Volume Footprint Candles script to draw thin candles over the slots.
Show stats - Showing stats over the candle: ∑, Δ, min Δ, max Δ. It's recommended to use 'Volume Footprint Statistics' script instead
Font size - Used to draw stats over the chart: T(iny), S(mall), N(ormal), L(arge)
Instrument and Volume status - A dialog showing basic chart information: Instrument type, Volume type, Smallest change, slot height.
Value area - Value area is the smallest group set of neighboring slots that have at least n(param) % of candle volume.
⠀ Value Area Minimal Volume (%) - Value area size as % of candle volume
⠀ Track - Option to track value areas, potencial support-resistance zones.
⠀ Only active - Option to hide areas that were crossed by the price.
⠀ Show Values - Opiton to show volume value over tracked value areas.
Alerts:
⠀ One alert per Bar - Emits no more than one alert per bar.
⠀ Add value area to tracking - Emits an alert about a new VA beeing added to the tracking list.
⠀ Remove value area from tracking - Emits an alert when a VA is removed from the tracking list.
Troubleshooting:
In case of any problems, please send error details to the author of the script.
Known issues:
"The study references too many candles in history" - If you encounter this issue, try changing "Data precision" setting to a lower value.
Body / Range %Body / Range is a volatility indicator that shows how many percentages the body candle occupies the range.
The ratio tells us about the health and confidence of the current candlestick.
Since overall candle Range is always bigger than the body range, Body/Range indicator will always fluctuate inside a range of 0 and 100%.
I didn't use True Range because it considers gaps and the ratio won't be considering individual candles. Therefore, I used high - low and identified it as Range.
In this function, the wicks play obviously role in determining the ratio too without its variable separately in the formula. I wouldn't use wicks here because Range = body + total wicks anyway. It already covers the variable. If I made the ratio with Body / Total Wicks, we wouldn't have stable 0 - 100% range of the indicator by the way. So it's fully justified dividing Body by Range to get some summarized Candle Metrics.
Logically we assume that if wicks are relatively bigger than body then the ratio will be relatively smaller and vice versa.
Change TF of the indicator is possible. For example, 3 months per bar would look like this:
The Candle Hunter Candlestick Pattern - by Karoshi TradingThe Candle Hunter Indicator - by Karoshi Trading
The Candle Hunter Indicator is based on specific Candlesticks and Patterns.
Activating this indicator will mark all specific Bullish & Bearish Candles on the Chart.
Depending on your settings, not all candles will be displayed on the chart.
The goal of this indicator is, to highlight all the important trending candles and ignore all ranging candles.
This can be helpful for rejecting/bouncing zones or S&R Levels. Or even if you like to trade reversals, you do not want to trade it on low volume ranging candles.
This indicator should only be used as a supplementary tool while trading, not as a stand alone.
Which Candles & Pattern will be marked on the chart?
1# Pinbar / Hammer (multiple Variations)
2# Marubozu Candles (multiple Variations)
3# Engulfing Candles (Multiple Variations)
How does this indicator works?
First of all, the indicator has to calculate 3 different parameters, before marking one of the given candle. To do so, we will need the average volume, average candle size and the specific candles.
1st Parameter: Defining the needed Candles
First of all, the indicator will calculate, based on the opening & closing price and also the wick (range of each candle). If one of the calculation is a match, for the mentioned candles above, we come to step 2.
2nd Parameter: Average Candle Size
The next one is the size of each candle, compared to the average candle on the chart.
You can customize the settings, but in this example, we want the specific candle be at least 1.5 times the size of the average last 14 candles.
3rd Parameter: Average Volume
The indicator will now calculate the average volume of the last selected candles period (default settings = 14) and compare it to the current candle. In this example, the current candle should be at least 1.5 times the average volume.
The indicator provides two possibilities to calculate the average volume:
1# Volume MA = Volume Moving Average
2# Volume SA = Volume Simple Average
Result: Colorizing the given Candle
After all parameters were met, the indicator will colorize and mark with a label + name all the candles on the chart.
Special Settings:
1st The Engulfing Candles, have 3 different options:
1# Classic = Only the body of the previous candle has to be engulfed by the current candle
2# Reinforced = The full candle + wick of the previous candle has to be engulfed
3# Multiple Candles = Minimum 3 previous candles has to be engulfed to be marked on the chart
The numbers of candles are changeable and you can have all 3 options simultaneously active.
That means, that the code will check all 3 options to see if there is a match.
2nd Marubozu Candle
You can set the ratio between body compared to wick in the settings. Depends if you want full marubozu candles or also the variations of it.
3rd Hammer Wick
You can decide how much bigger the wick should be, compared to the body of the candle. The default settings are set on 1.5 times.
You can also set the position of the body. As example if the settings are set on 30%, the body of the hammer should be on the upper half of a bullish hammer or the lower 30% of the candle if bearish.
InsideBar2.0Inside Bar: Inside Bar is defined as, " when candle body range falls within previous day candle body".
Some of us take the whole prices range . Here i have taken only the price range of the body of tehecandle.
I have created an indicator to identify Inside bras and draw target levels on both the sides. Traders can easily convert it into a strategy and checkout the success rate.
This script is written to identify InsideBar and then plot target 1 and target 2 irrespective the direction of following candles.
Inside Bar is here defined clearly when the whole body( Not high/Low, but Open and Close Only of the candle falls within the whole body of previous candle
Few static Variables are declared for one time use to store the following values
MotherCandle Index
High and Low of MotherCandle
Target 1 equal to size of the body of mother candle
Target 2 equal twice the size of Mother Candle
Depending upon the direction of the trend and breakout of the MotherCandle boundaries, target lines and labels are drawn.
Line.delete function is used to delete all the previous lines to keep the chart clean and not draw line on all every inside-bar detected in the past.
Label.delete function is used to delete all the previous labels for Target levels to clearly show current target levels.
barcolor() function is used to change the inside bar candle changed to "Yellow" .
Glan Nilly candle TrendThis script is based on Nilly River Theory, and shows up, down, inner and outer bars according that concept.
it can be used for trend recognition. blue after blue candles show continuation of an upward trend.
red after red candles show continuation of a downward trend. gray candles are members of the trend they are within.
An opposite candle color to previous candles shows minor trend reversal. high of the last candle of a blue after blue candles shows a new up(grey candles within the way are part of that trend).
low of the last candle of a red after red candles shows a new down(grey candles within the way are part of that trend).
if the new up is upper and new down is upper than previous ones, then this is real upward trend. if the new up is lower than and new down is lower than previous ones, then this is real downward trend. it is not allowed to trade in opposite direction of a trend and this indicator help us to recognize the trend.
GKD-C WYFX Clear Chart [Loxx]Giga Kaleidoscope WYFX Clear Chart is a Confirmation module included in Loxx's "Giga Kaleidoscope Modularized Trading System".
█ Giga Kaleidoscope Modularized Trading System
What is Loxx's "Giga Kaleidoscope Modularized Trading System"?
The Giga Kaleidoscope Modularized Trading System is a trading system built on the philosophy of the NNFX (No Nonsense Forex) algorithmic trading.
What is an NNFX algorithmic trading strategy?
The NNFX algorithm is built on the principles of trend, momentum, and volatility. There are six core components in the NNFX trading algorithm:
1. Volatility - price volatility; e.g., Average True Range, True Range Double, Close-to-Close, etc.
2. Baseline - a moving average to identify price trend
3. Confirmation 1 - a technical indicator used to identify trends
4. Confirmation 2 - a technical indicator used to identify trends
5. Continuation - a technical indicator used to identify trends
6. Volatility/Volume - a technical indicator used to identify volatility/volume breakouts/breakdown
7. Exit - a technical indicator used to determine when a trend is exhausted
How does Loxx's GKD (Giga Kaleidoscope Modularized Trading System) implement the NNFX algorithm outlined above?
Loxx's GKD v1.0 system has five types of modules (indicators/strategies). These modules are:
1. GKD-BT - Backtesting module (Volatility, Number 1 in the NNFX algorithm)
2. GKD-B - Baseline module (Baseline and Volatility/Volume, Numbers 1 and 2 in the NNFX algorithm)
3. GKD-C - Confirmation 1/2 and Continuation module (Confirmation 1/2 and Continuation, Numbers 3, 4, and 5 in the NNFX algorithm)
4. GKD-V - Volatility/Volume module (Confirmation 1/2, Number 6 in the NNFX algorithm)
5. GKD-E - Exit module (Exit, Number 7 in the NNFX algorithm)
(additional module types will added in future releases)
Each module interacts with every module by passing data between modules. Data is passed between each module as described below:
GKD-B => GKD-V => GKD-C(1) => GKD-C(2) => GKD-C(Continuation) => GKD-E => GKD-BT
That is, the Baseline indicator passes its data to Volatility/Volume. The Volatility/Volume indicator passes its values to the Confirmation 1 indicator. The Confirmation 1 indicator passes its values to the Confirmation 2 indicator. The Confirmation 2 indicator passes its values to the Continuation indicator. The Continuation indicator passes its values to the Exit indicator, and finally, the Exit indicator passes its values to the Backtest strategy.
This chaining of indicators requires that each module conform to Loxx's GKD protocol, therefore allowing for the testing of every possible combination of technical indicators that make up the six components of the NNFX algorithm.
What does the application of the GKD trading system look like?
Example trading system:
Backtest: Strategy with 1-3 take profits, trailing stop loss, multiple types of PnL volatility, and 2 backtesting styles
Baseline: Hull Moving Average
Volatility/Volume: Volatility Ratio as shown on the chart above
Confirmation 1: WYFX Clear Chart as shown on the chart above
Confirmation 2: Williams Percent Range
Continuation: Fisher Transform
Exit: Rex Oscillator
Each GKD indicator is denoted with a module identifier of either: GKD-BT, GKD-B, GKD-C, GKD-V, or GKD-E. This allows traders to understand to which module each indicator belongs and where each indicator fits into the GKD protocol chain.
Giga Kaleidoscope Modularized Trading System Signals (based on the NNFX algorithm)
Standard Entry
1. GKD-C Confirmation 1 Signal
2. GKD-B Baseline agrees
3. Price is within a range of 0.2x Volatility and 1.0x Volatility of the Goldie Locks Mean
4. GKD-C Confirmation 2 agrees
5. GKD-V Volatility/Volume agrees
Baseline Entry
1. GKD-B Baseline signal
2. GKD-C Confirmation 1 agrees
3. Price is within a range of 0.2x Volatility and 1.0x Volatility of the Goldie Locks Mean
4. GKD-C Confirmation 2 agrees
5. GKD-V Volatility/Volume agrees
6. GKD-C Confirmation 1 signal was less than 7 candles prior
Continuation Entry
1. Standard Entry, Baseline Entry, or Pullback; entry triggered previously
2. GKD-B Baseline hasn't crossed since entry signal trigger
3. GKD-C Confirmation Continuation Indicator signals
4. GKD-C Confirmation 1 agrees
5. GKD-B Baseline agrees
6. GKD-C Confirmation 2 agrees
1-Candle Rule Standard Entry
1. GKD-C Confirmation 1 signal
2. GKD-B Baseline agrees
3. Price is within a range of 0.2x Volatility and 1.0x Volatility of the Goldie Locks Mean
Next Candle:
1. Price retraced (Long: close < close or Short: close > close )
2. GKD-B Baseline agrees
3. GKD-C Confirmation 1 agrees
4. GKD-C Confirmation 2 agrees
5. GKD-V Volatility/Volume agrees
1-Candle Rule Baseline Entry
1. GKD-B Baseline signal
2. GKD-C Confirmation 1 agrees
3. Price is within a range of 0.2x Volatility and 1.0x Volatility of the Goldie Locks Mean
4. GKD-C Confirmation 1 signal was less than 7 candles prior
Next Candle:
1. Price retraced (Long: close < close or Short: close > close )
2. GKD-B Baseline agrees
3. GKD-C Confirmation 1 agrees
4. GKD-C Confirmation 2 agrees
5. GKD-V Volatility/Volume Agrees
PullBack Entry
1. GKD-B Baseline signal
2. GKD-C Confirmation 1 agrees
3. Price is beyond 1.0x Volatility of Baseline
Next Candle:
1. Price is within a range of 0.2x Volatility and 1.0x Volatility of the Goldie Locks Mean
3. GKD-C Confirmation 1 agrees
4. GKD-C Confirmation 2 agrees
5. GKD-V Volatility/Volume Agrees
█ WYFX Clear Chart
What is WYFX Clear Chart?
WYFX Clear Chart a variation of Heiken-Ashi candles that uses 62 different types of smoothing.
Requirements
Inputs
Confirmation 1 and Solo Confirmation: GKD-V Volatility / Volume indicator
Confirmation 2: GKD-C Confirmation indicator
Outputs
Confirmation 2 and Solo Confirmation: GKD-E Exit indicator
Confirmation 1: GKD-C Confirmation indicator
Continuation: GKD-E Exit indicator
Additional features will be added in future releases.
PinBar Detector [Mr_Zed]Pinbar Detector is a technical analysis tool designed to detect Pinbar patterns in financial markets. Pinbars are reversal patterns that indicate a potential change in trend.
This indicator is based on an existing Pinbar detector in MQ4/5 format, originally developed by "earnforex".
The PineScript version is written to work in TradingView, and can be applied to any chart to identify Pinbar formations. The indicator uses specific criteria to identify Pinbars, such as the length of the wick and the relationship between the wick and the body of the candlestick. By displaying the Pinbars on the chart, traders can make informed decisions about entering or exiting trades based on their analysis of the market's potential trend reversal.
enjoy !
Weekly Opening Gap (cryptonnnite)In the context of general equities, opening price that is substantially higher or lower than the previous day's closing price, usually because of some extraordinarily positive or negative news. Opening gap using as a potential target which market usually trades to.
ATR PivotsThe "ATR Pivots" script is a technical analysis tool designed to help traders identify key levels of support and resistance on a chart. The indicator uses various metrics such as the Average True Range (ATR), Daily True Range ( DTR ), Daily True Range Percentage (DTR%), Average Daily Range (ADR), Previous Day High ( PDH ), and Previous Day Low ( PDL ) to provide a comprehensive picture of the volatility and movement of a security. The script also includes an EMA cloud and 200 EMA for trend identification and a 1-minute ATR scalping strategy for traders to make informed trading decisions.
ATR Detail:-
The ATR is a measure of the volatility of a security over a given period of time. It is calculated by taking the average of the true range (the difference between the high and low of a security) over a set number of periods. The user can input the number of periods (ATR length) to be used for the ATR calculation. The script also allows the user to choose whether to use the current close or not for the calculation. The script calculates various levels of support and resistance based on the relationship between the security's range ( high-low ) and the ATR. The levels are calculated by multiplying the ATR by different Fibonacci ratios (0.236, 0.382, 0.5, 0.618, 0.786, 1.000) and then adding or subtracting the result from the previous close. The script plots these levels on the chart, with the -100 level being the most significant level. The user also has an option to choose whether to plot all Fibonacci levels or not.
DTR and DTR% Detail:-
The Daily True Range Percentage (DTR%) is a metric that measures the daily volatility of a security as a percentage of its previous close. It is calculated by dividing the Daily True Range ( DTR ) by the previous close. DTR is the range between the current period's high and low and gives a measure of the volatility of the security on a daily basis. DTR% can be used as an indicator of the percentage of movement of the security on a daily basis. In this script, DTR% is used in combination with other metrics such as the Average True Range (ATR) and Fibonacci ratios to calculate key levels of support and resistance for the security. The idea behind using DTR% is that it can help traders to better understand the daily volatility of the security and make more informed trading decisions.
For example, if a security has a DTR% of 2%, it suggests that the security has a relatively low level of volatility and is less likely to experience significant price movements on a daily basis. On the other hand, if a security has a DTR% of 10%, it suggests that the security has a relatively high level of volatility and is more likely to experience significant price movements on a daily basis.
ADR:-
The script then calculates the ADR (Average Daily Range) which is the average of the daily range of the security, using the formula (Period High - Period Low) / ATR Length. This gives a measure of the average volatility of the security on a daily basis, which can be useful for determining potential levels of support and resistance .
PDH /PDL:-
The script also calculates PDH (Previous Day High) and PDL (Previous Day Low) which are the High and low of the previous day of the security. This gives a measure of the previous day's volatility and movement, which can be useful for determining potential levels of support and resistance .
EMA Cloud and 200 EMA Detail:-
The EMA cloud is a technical analysis tool that helps traders identify the trend of the market by comparing two different exponential moving averages (EMAs) of different lengths. The cloud is created by plotting the fast EMA and the slow EMA on the chart and filling the space between them. The user can input the length of the fast and slow EMA , and the script will calculate and plot these EMAs on the chart. The space between the two EMAs is then filled with a color that represents the trend, with green indicating a bullish trend and red indicating a bearish trend . Additionally, the script also plots a 200 EMA , which is a commonly used long-term trend indicator. When the fast EMA is above the slow EMA and the 200 EMA , it is considered a bullish signal, indicating an uptrend. When the fast EMA is below the slow EMA and the 200 EMA , it is considered a bearish signal, indicating a downtrend. The EMA cloud and 200 EMA can be used together to help traders identify the overall trend of the market and make more informed trading decisions.
1 Minute ATR Scalping Strategy:-
The script also includes a 1-minute ATR scalping strategy that can be used by traders looking for quick profits in the market. The strategy involves using the ATR levels calculated by the script as well as the EMA cloud and 200 EMA to identify potential buy and sell opportunities. For example, if the 1-minute ATR is above 11 in NIFTY and the EMA cloud is bullish , the strategy suggests buying the security. Similarly, if the 1-minute ATR is above 30 in BANKNIFTY and the EMA cloud is bullish , the strategy suggests buying the security.
Inside Candle:-
The Inside Candle is a price action pattern that occurs when the current candle's high and low are entirely within the range of the previous candle's high and low. This pattern indicates indecision or consolidation in the market and can be a potential sign of a trend reversal. When used in the 15-minute chart, traders can look for Inside Candle patterns that occur at key levels of support or resistance. If the Inside Candle pattern occurs at a key level and the price subsequently breaks out of the range of the Inside Candle, it can be a signal to enter a trade in the direction of the breakout. Traders can also use the Inside Candle pattern to trade in a tight range, or to reduce their exposure to a current trend.
Risk Management:-
As with any trading strategy, it is important to practice proper risk management when using the ATR Pivots script and the 1-minute ATR scalping strategy. This may include setting stop-loss orders, using appropriate position sizing, and diversifying your portfolio. It is also important to note that past performance is not indicative of future results and that the script and strategy provided are for educational purposes only.
In conclusion, the "ATR Pivots" script is a powerful tool that can help traders identify key levels of support and resistance , as well as trend direction. The additional metrics such as DTR , DTR%, ADR, PDH , and PDL provide a more comprehensive picture of the volatility and movement of the security, making it easier for traders to make better trading decisions. The inclusion of the EMA cloud and 200 EMA for trend identification, and the 1-minute ATR scalping strategy for quick profits can further enhance a trader's decision-making process. However, it is important to practice proper risk management and understand that past performance is not indicative of future results.
Special thanks to satymahajan for the idea of clubbing Average True Range with Fibonacci levels.
Volume FootprintThe Volume Footprint chart is analyzing volume data from inside the candle and split them into Up and Down Volume in the same way as Volume Profile analyzes the volume data from a fragment of the chart.
The visualization is little different:
Down Volume (sells) are shown on the left side of a candle.
Up Volume (Buys) are shown on the right side of a candle.
User can pick data precision used by Volume Footprint. We recomend to use the highest possible precision.
Unfortunatelly Trading View has many limitations.
If after adding script nothing is visible with error: "'The study references too many candles in history'" you need to use lower precision - It can be changed in script settings.
This script is a part of a toolkit called "Volume Footprint", containing few tools:
Volume Footprint - Scripts drawing Volume Footprint chart.
Volume Footprint Statistics - Script showing table with basic statistics about Up and Down volume inside the candles.
Volume Delta In Candle - Chart showing history of delta (difference between Up and Down volume) changes inside the current candle.
Volume Cumulative Delta - Chart showing history of cumulative delta (sum of difference between Up and Down volume in trading period equal to chart interval).
This script can be used by any user. You do not need to have PRO or PREMIUM account to use it.
Script with limited access, contact author to get authorization
User Interface:
Script is grouping Up and Down Volume into slots based on price. Slots height is controled by "Slot height" param in settings.
On left side of a candle Down Volume is shown and on right side Up Volume is shown.
Before Down Volume may appear imbalance symbols:
⠀↓ - 3 times
⠀↡ - 5 times
⠀⇊ - 10 times
After Up Volume may appear imbalance symbols:
⠀↑ - 3 time
⠀↟ - 5 times
⠀⇈ - 10 times
Above the candle we can show some basic statistics of that candle:
"V:" - Row with volume statistics:
⠀∑ - Total volume,
⠀Δ - Difference between Up and Down Volume.
⠀min Δ - Smallest difference between Up and Down Volume in that candle
⠀max Δ - Biggest difference between Up and Down Volume in that candle
Script settings:
Slot height = 10^ - Price slot height on the chart:
⠀ 0 - 1$
⠀ 1 - 10$
⠀ 2 - 100$
⠀ 3 - 1000$
⠀-1 - 0.1$
⠀-2 - 0.01$
⠀-3 - 0.001$
Data precision - One of 6 levels of data precision: ▉▇▆▅▃▁, where ▉ means the highest precision and ▁ the lowest available precision. On 15 minute chart highest precision should be available, but on 1D it will probably hit TradingView limitations and script will not be even launched by the platform with error: "'The study references too many candles in history'". The general recommendation is to use the highest available precision for a given instrument and interval.
Precise warnings - Option to show precise warnings about missing volume in candle footprint (warning connected with one of TradingView limitations).
Draw candles - Option of drawing candles fiting to volume labels and 2 fields for picking colors of up and down candles. The general recommendation is to hide chart candles and turn on this option.
Show stats - Showing stats over the candle: ∑, Δ, min Δ, max Δ. You can use 'Volume Footprint Statistics' script instead
Font size - Used to draw all the data over the chart: T(iny), S(mall), N(ormal), L(arge)
Centered - If checked volume labels are stick to candle (centered).
Color values - Option to draw labels with use of Up or Down color, depending which value (Volume Up or Volume Down) is bigger in the price slot.
Filter - Filtering option than allow hinding labels with small values:
⠀0 - filter turned off.
⠀1-5 - filtering with transparency
⠀6-10 - Filtering with hiding values.
Show zeros - It can show zeros or leave empty places
Highlight biggest slot - Option to highlight price slot with biggest volume in the candle.
Imbalances - Showing imbalance symbols before Down or after Up Volume
Only over average - Showing imbalances symbols only for volume not smaller than the average value.
Value area - Option to identify group of slots with biggest volume in each candle. A group is a smallest set of neighboring slots that have at least n(param) % of candle volume .
⠀ Value Area Minimal Volume (%) - Value area size as % of candle volume .
⠀ Color - Color of the Value area.
⠀ Show borders - Showing border lines of value areas over the candle.
⠀ Track - Option to track value areas. Potencial Support-Resistance zones.
⠀ Only active - Hide areas that were crossed by the price.
Show Values - Show volume value over tracked value areas.
Troubleshooting:
In case of any problems, send error details to the author of the script.
Known issues:
"The study references too many candles in history" - Change "Data precision" settings to some lower value.
Odd_Custom Candle Calendar DayEver wonder how candles would look on a chart if they were tracked by calendar day instead of market days?
Option(s)-
📅Custom start date for candle formation
✖️Candle multiplier
🌈Up / Down Colors
Features-
📋Displays candle data with invisible plots
Use Move to Existing Pane to Overlay on chart.
Can only display a max of 500 candles!
FOREX MASTER PATTERN Companion ToolWhat This Indicator Does
The Forex Master Pattern uses candlesticks, which provide more information than line, OHLC or area charts. For this reason, candlestick patterns are a useful tool for gauging price movements on all time frames. While there are many candlestick patterns, there is one which is particularly useful...
The Engulfing Pattern
An engulfing pattern provides an excellent trading opportunity because it can be easily spotted and the price action indicates a strong and immediate change in direction. In a downtrend, an up candle real body will completely engulf the prior down candle real body (bullish engulfing). In an uptrend a down candle real body will completely engulf the prior up candle real body (bearish engulfing).
Used in conjunction with the FOREX Master Pattern value line, the Engulfing Pattern can assist the trader with reversal timing or trend confirmation during the expansion and trend phases.
As shown in the screenshot below. Engulfing Candles usually precede a sharp move in price in the direction of the engulfing candle.
As shown in the screenshot below, when the Show Lines option is ON while using the indicator, both red and green lines are drawn on the chart automatically when engulfing candles form. These lines are projected forward 100 bars and tend to be reliable support and resistance areas. These areas are typically hidden from view.
In addition to the Show Lines option, the indicator (by default) creates boxes around trading zones that are created when an engulfing candle is formed. (There is an option to hide these from view if desired).
As seen in the screenshot below, these areas / zones are wider than a line and encompass a resistance / support zone rather than a specific price. Liquidity is usually high in these areas and a lot of selling / buying occurs here. These zones are drawn in advance out into the future giving the trader an idea of where price will revert to eventually.
A combination of LINES and AREAS can be used giving the user a better idea of where within the zone price will go.
As seen on the screenshot below, this combination provides a pretty accurate indication of the reversal point well in advance.
As seen in the screenshot below, when a ZONE / AREA has been fully breached (crossed) by price, the area is deactivated an no longer continues forward on the chart. Until price breaches an area, it remains valid and continues on the chart until and only if it is breached by price.
The Indicator is fully customizable.
The use can change the color of the engulfing candles, the color of the zones, transparency etc. You can turn OFF or ON any of the features such as lines, zones, bar coloring, and plotted arrows.
I really hope you get value from this indicator and... HAPPY TRADING!!
Simple STRAT Tool by nnamWhat this Indicator Does
This indicator is a very simple tool created specifically for experienced Straters. It was created for those Straters who fully understand the 1-2-3 Strat Scenarios, are in need of an easy to use tool, and do not want or need a lot of messy markings on their chart.
The indicator simply allows the user to color code the Strat 1, 2 ,3 (Inside /Outside /Up / Down) Bars as desired and by default extends lines to the right of the chart from the Highs and Lows of the previous 2 Bars giving the user a simple reference for Strat scenario structure breaks.
As shown above, the bars are color coded, but the original bar color is maintained via the border and wick.
If a bar is an Outside Bar or an Inside Bar, it is still easy to identify whether or not the bar was a Bullish or Bearish 1 or 3.
The same goes for 2UP and 2Down Bars - It is easy to identify Bullish or Bearish UP or DOWN Bars.
Optionally, as show in the screenshot below, the user can extend the lines in both directions to get an "at a glance" better understanding of where price is currently vs previous support and resistance areas.
For Straters that prefer to trade only INSIDE BAR BREAKOUTS there is an optional input setting labeled "Trade Inside Bars ONLY".
This setting turns OFF the lines that extend from the 2nd previous bar back and only displays and extend lines from the previous bar IF and ONLY IF the current bar is an INSIDE (one) bar. .
The User Input settings allow for the following customizations:
1. Custom Outside Bar Color
2. Custom Inside Bar Color
3. Custom 2 Up Bar Color
4. Custom 2 Down Bar Color
5. Turn ON or OFF color coded bars
6. Trade only INSIDE Bar Breakouts
7. Extend Lines Both Directions
8. Hide all Lines
The customizable settings above allow the user to hide all lines and turn OFF color coding without having to fully remove the indicator from the chart. This is convenient when the user has another indicator that uses color coded bars or the lines conflict with another indicator and they need to be temporarily disabled.
If you have any questions regarding this indicator please let me know. If you have any suggestions for minor tweaks to the indicator do not hesitate to ask for them.
I hope you enjoy this indicator and get some usefulness from it... HAPPY TRADING!!