Instabot Heikin Ashi Market CloseThis simple script adds a small marker on the last bar of a Heikin Ashi chart to indicate where the current market close price is, which can be hard to see on this style of candle.
Analisis Candlestick

FREE TRADINGVIEW FOR TIMEFRAMESWhen doing i.e the 3 minute timeframe turn on the closest timeframe available for you or the candles and wicks will be fucked up.
So if you're doing the 5 hour timeframe candles turn on the 4hr chart on your main chart.
To View the candles in full screen double click the windows with the candlesticks
If you don't have TradingView premium and want to look at custom timeframes you can use this.
For the ticker/coin/pair you want to show enter it like this:
For stocks, only the ticker i.e: MSFT, APPL
For Crypto, "Exchange:ticker" i.e: BITFINEX:BTCUSD, BINANCE:AGIBTC, BITMEX:ADAM19
When setting up the timeframe write i.e:
For minutes/hourly: 5, 240 (4 hour), 360 (6 hour)
For daily/weekly/monthly: 1D, 2W, 3M
When doing i.e the 3 minute timeframe turn on the closest timeframe available for you or the candles and wicks will be fucked up.
So if you're doing the 5 hour timeframe candles turn on the 4hr chart on your main chart.

Fake-Out IndicatorThe signal comes from the "RailRoad" candlestick pattern breaking a support/resistance level, which typically indicates price will respect that level.
How consistent is the pattern? Hard to say considering candlestick patterns vary wildly by % change between different securities.
I didn't implement any kind of "fuzzy logic" for this strategy, though it would benefit greatly from it.
There are many instances where a fixed% simply doesn't catch a winning trade from a "bounce" off a S/R level.

Highs and Lows (Previous Days Projected + Current Week & Month)Credit to Lachlan Smith created original on 31/03/15 - Edited by Elisa 30/3/19
Historical highs and lows
Includes three previous days projected onto today, plus current week and month.
Settings allow for data to be hidden after weekends for use in traditional markets. (i.e. prior 2 days not useful on a Monday)

PivotBoss TriggersI have collected the four PivotBoss indicators into one big indicator. Eventually I will delete the individual ones, since you can just turn off the ones you don't need in the style controller. Cheers.
Wick Reversal
When the market has been trending lower then suddenly forms a reversal wick candlestick , the likelihood of
a reversal increases since buyers have finally begun to overwhelm the sellers. Selling pressure rules the decline,
but responsive buyers entered the market due to perceived undervaluation. For the reversal wick to open near the
high of the candle, sell off sharply intra-bar, and then rally back toward the open of the candle is bullish , as it
signifies that the bears no longer have control since they were not able to extend the decline of the candle, or the
trend. Instead, the bulls were able to rally price from the lows of the candle and close the bar near the top of its
range, which is bullish - at least for one bar, which hadn't been the case during the bearish trend.
Essentially, when a reversal wick forms at the extreme of a trend, the market is telling you that the trend
either has stalled or is on the verge of a reversal. Remember, the market auctions higher in search of sellers, and
lower in search of buyers. When the market over-extends itself in search of market participants, it will find itself
out of value, which means responsive market participants will look to enter the market to push price back toward
an area of perceived value. This will help price find a value area for two-sided trade to take place. When the
market finds itself too far out of value, responsive market participants will sometimes enter the market with
force, which aggressively pushes price in the opposite direction, essentially forming reversal wick candlesticks .
This pattern is perhaps the most telling and common reversal setup, but requires steadfast confirmation in order
to capitalize on its power. Understanding the psychology behind these formations and learning to identify them
quickly will allow you to enter positions well ahead of the crowd, especially if you've spotted these patterns at
potentially overvalued or undervalued areas.
Fade (Extreme) Reversal
The extreme reversal setup is a clever pattern that capitalizes on the ongoing psychological patterns of
investors, traders, and institutions. Basically, the setup looks for an extreme pattern of selling pressure and then
looks to fade this behavior to capture a bullish move higher (reverse for shorts). In essence, this setup is visually
pointing out oversold and overbought scenarios that forces responsive buyers and sellers to come out of the dark
and put their money to work-price has been over-extended and must be pushed back toward a fair area of value
so two-sided trade can take place.
This setup works because many normal investors, or casual traders, head for the exits once their trade
begins to move sharply against them. When this happens, price becomes extremely overbought or oversold,
creating value for responsive buyers and sellers. Therefore, savvy professionals will see that price is above or
below value and will seize the opportunity. When the scared money is selling, the smart money begins to buy, and
Vice versa.
Look at it this way, when the market sells off sharply in one giant candlestick , traders that were short
during the drop begin to cover their profitable positions by buying. Likewise, the traders that were on the
sidelines during the sell-off now see value in lower prices and begin to buy, thus doubling up on the buying
pressure. This helps to spark a sharp v-bottom reversal that pushes price in the opposite direction back toward
fair value.
Engulfing (Outside) Reversal
The power behind this pattern lies in the psychology behind the traders involved in this setup. If you have
ever participated in a breakout at support or resistance only to have the market reverse sharply against you, then
you are familiar with the market dynamics of this setup. What exactly is going on at these levels? To understand
this concept is to understand the outside reversal pattern. Basically, market participants are testing the waters
above resistance or below support to make sure there is no new business to be done at these levels. When no
initiative buyers or sellers participate in range extension, responsive participants have all the information they
need to reverse price back toward a new area of perceived value.
As you look at a bullish outside reversal pattern, you will notice that the current bar's low is lower than the
prior bar's low. Essentially, the market is testing the waters below recently established lows to see if a downside
follow-through will occur. When no additional selling pressure enters the market, the result is a flood of buying
pressure that causes a springboard effect, thereby shooting price above the prior bar's highs and creating the
beginning of a bullish advance.
If you recall the child on the trampoline for a moment, you'll realize that the child had to force the bounce
mat down before he could spring into the air. Also, remember Jennifer the cake baker? She initially pushed price
to $20 per cake, which sent a flood of orders into her shop. The flood of buying pressure eventually sent the price
of her cakes to $35 apiece. Basically, price had to test the $20 level before it could rise to $35.
Let's analyze the outside reversal setup in a different light for a moment. One of the reasons I like this setup
is because the two-bar pattern reduces into the wick reversal setup, which we covered earlier in the chapter. If
you are not familiar with candlestick reduction, the idea is simple. You are taking the price data over two or more
candlesticks and combining them to create a single candlestick . Therefore, you will be taking the open, high, low,
and close prices of the bars in question to create a single composite candlestick .
Doji Reversal
The doji candlestick is the epitome of indecision. The pattern illustrates a virtual stalemate between buyers
and sellers, which means the existing trend may be on the verge of a reversal. If buyers have been controlling a
bullish advance over a period of time, you will typically see full-bodied candlesticks that personify the bullish
nature of the move. However, if a doji candlestick suddenly appears, the indication is that buyers are suddenly
not as confident in upside price potential as they once were. This is clearly a point of indecision, as buyers are no
longer pushing price to higher valuation, and have allowed sellers to battle them to a draw-at least for this one
candlestick . This leads to profit taking, as buyers begin to sell their profitable long positions, which is heightened
by responsive sellers entering the market due to perceived overvaluation. This "double whammy" of selling
pressure essentially pushes price lower, as responsive sellers take control of the market and push price back
toward fair value.

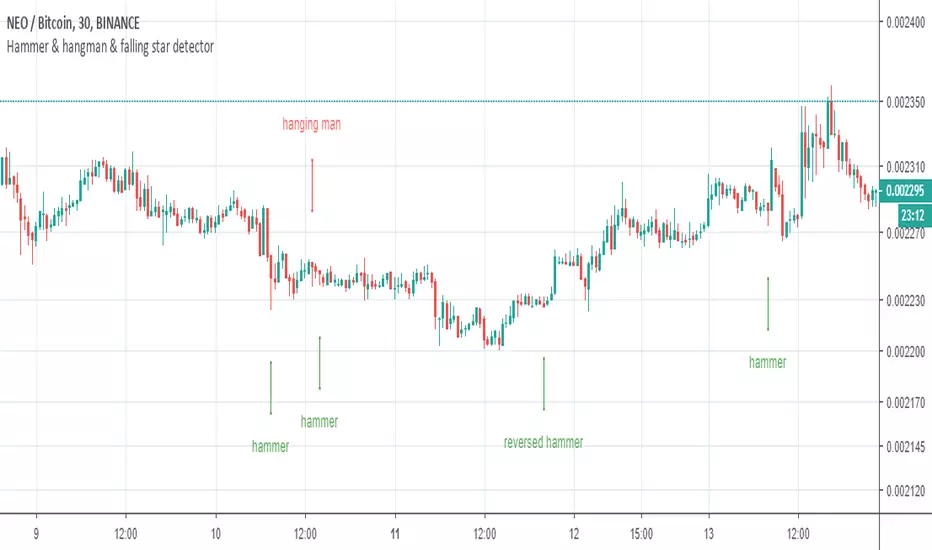
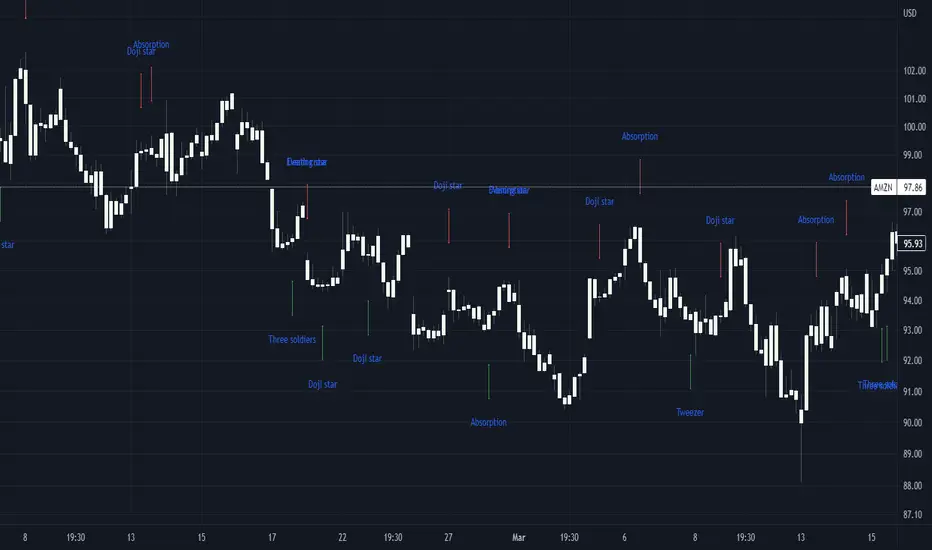
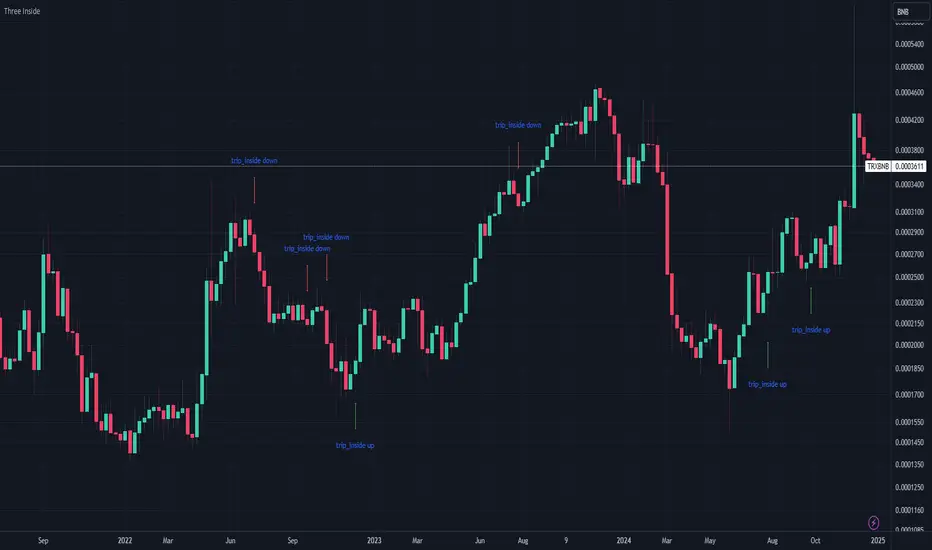
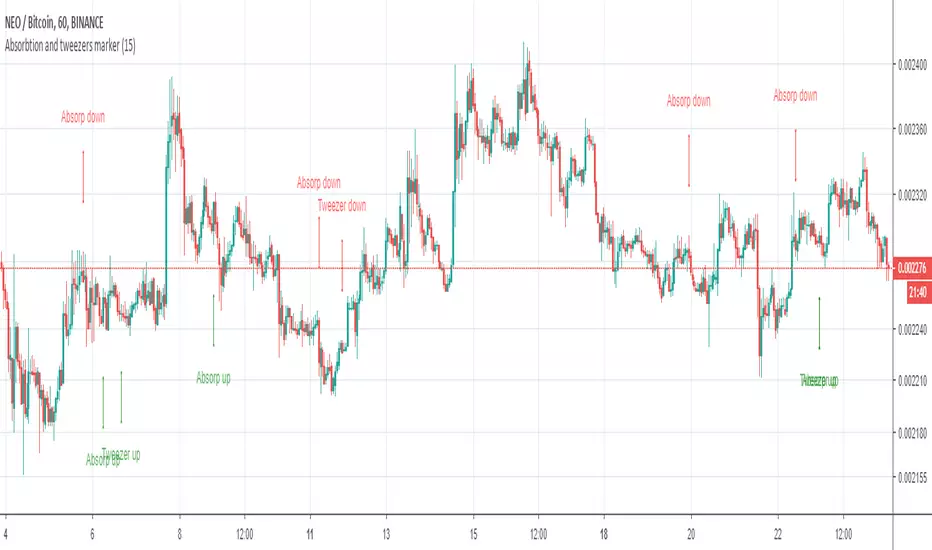
Basic candle patternsBasic candle patterns marker marks:
- Doji stars
- Doji graves
- Doji dragonflies
- Hammers
- Reversed hammers
- Hanging mans
- Falling stars
- Absorption up/down
- Tweezers up/down
- Three inside ups/downs

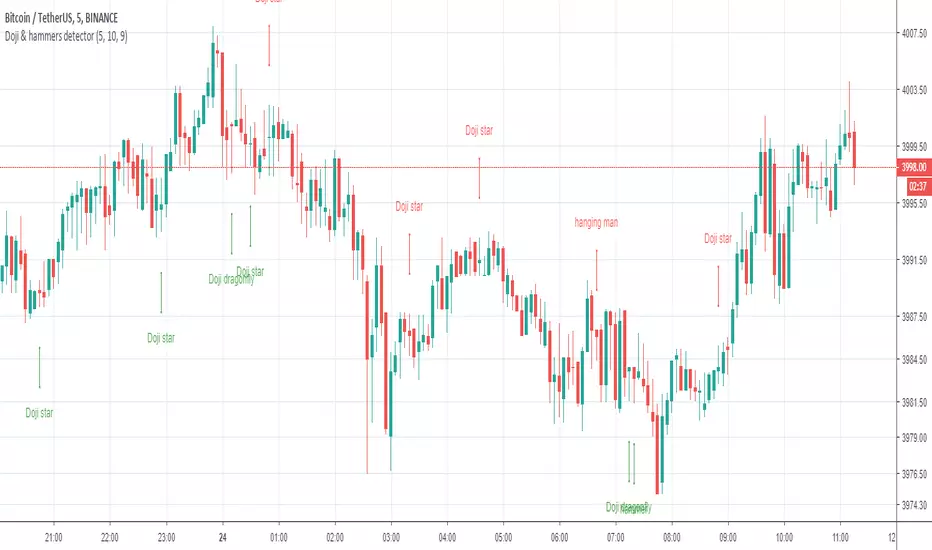
Doji & hammers markerDoji & hammers marker marks:
- long/ short doji star ( marks as doji star )
- doji grave
- doji dragonfly
- hammer
- falling star
- hanging man
- reversed hammer
Doji detectorDoji detector marks doji candles.
Can find:
- short / long Doji star ( marks as Doji star )
- Doji grave
- Doji dragonfly

Combined MTF Camarilla Pivots (HA + Candles)This is a fairly basic (but hopefully useful) indicator that combines three time-frames of Camarilla pivots into one.
Default time-frames are:
Weekly
Monthly
Yearly
Time-frames can be modified as you wish, they are just set to these as I generally only trade higher intervals (just note that formatting labels will not change - but you can update these as needed).
The Camarilla pivots displayed are as follows:
R3, R4, R5, R6
Pivot line (Middle/Base)
S3, S4, S5, S6
R1/S1 & R2/S2 are excluded to make way for R5/S5 & R6/S6 - as these are more useful for the majority of traders. The formula for levels 5/6 are always up for debate, as no official formula has ever been released. I've used what I consider a mid, or consensus calculation.
By default all historical pivot levels are displayed, as there can be some benefit to mapping these forward once the relevant period has ended. If people find it's too cluttered I'll look into having an option to display the current period only.
Unfortunately, TradingView doesn't allow labels on plots (seems like such a basic feature to be missing, but there you go), so you'll have to learn the colours/linewidths.
Oh, and there's a checkbox to enable pivots to be calculated on Heiken-Ashi prices/candles rather than default prices/candles. This heavily modifies the location of the Camarilla Pivots, but I've found that in certain situations you can get some great results.
Let me know your thoughts/comments/suggestions.
Cheers
DD

Hammer and Hanging Man candlesticks detectorSimple script to detect and mark possible reversal candlesticks - "hammer" and reversed version "hanging man".
hammer:
en.wikipedia.org(candlestick_pattern)
hanging man:
en.wikipedia.org(candlestick_pattern)