Animal EnvironmentInfers based on topogrophy if you are more likely to encounter bears or bulls near.
Centered Oscillators

Regime Reaper | QuantEdgeB📊 Regime Reaper | QuantEdgeB
🔍 What is Regime Reaper?
Regime Reaper is QuantEdgeB’s premier regime detection engine, designed to quantify market behavior through a scientific blend of stationarity tests, trend diagnostics, and reversion signals.
Rather than guessing if a market is trending or mean-reverting, Regime Reaper mathematically determines it—blending econometrics with market momentum, volatility texture, and predictive correlation.
💡 Think of Regime Reaper as a financial MRI — probing deep statistical layers to tell you what kind of environment you're in before you make a move.
⚙️ Core Components
✅ Z-Blend Framework
At its core, Regime Reaper combines up to 15 independent signals, each normalized via Z-Scores, including:
• 🧪 Stationarity Tests: ADF, KPSS, PP Test — detecting mean-reverting pressure or randomness
• 🌀 Cycle Predictors: Hurst exponent, Fourier approximation
• 🔥 Trend Strength: ADX, Price Momentum Correlation (PMC), Relative Price Change
• 💣 Volatility Analysis: GARCH, BBW, VAM
• ⚡ Behavioral Texture: Choppiness Index, Wavelet Energy, Half-Life
Each signal is optionally enabled/disabled — allowing surgical custom blends tailored to your asset or timeframe.
✅ Z-Avg Value Engine
• All active signals are aggregated into a composite Z-Score (Z-Avg)
• This value forms the backbone of regime classification logic
• Combined with adaptive percentile thresholds for precision detection
🎯 Regime Classification Logic
🧭 Z-Avg-Based Threshold Model
Regime Reaper classifies markets into three states:
Z-Avg Score Market Regime
≥ Threshold + Percentile 🔺 Trending
≥ Threshold Only ⚖️ Neutral / Weak Trend
≤ Reversion Threshold 🔻 Mean-Reverting
These scores are colored, plotted, and displayed in a histogram view to make regime transitions immediately visible.
✅ Custom threshold values via:
• Trending Threshold
• Reverting Threshold
• Percentile Rank Comparison
📊 Dashboard Overlay (Optional)
Regime Reaper includes three live tables:
1. Metrics Panel (𝓡𝓮𝓰𝓲𝓶𝓮 𝓡𝓮𝓪𝓹𝓮𝓻)
o Displays the Z-Score of each active metric
o Highlights total Z-Blend Score
o Shows current regime stage (Trending, Reverting, Neutral)
2. Signal Scanner Table
o Explains current Z-Avg score & decision logic
o Displays thresholds for trend/revert neutrality
o Delivers a stage verdict with live updates
3. Info Panel
o Visual color-coded regime bars
o Snapshot of all 3 possible states
🎨 Visual Signal System
• Z-Avg Histogram — core value colored by regime state
• Background Coloring — lightly shades trending vs reverting periods
• Table Text Coloring — shows metric strength in live table updates
• User-Specified Color Themes — switch between Magic, Strategy, Cool, etc.
🧠 Why Use Regime Reaper?
Because knowing the market’s regime changes everything:
• Reversion strategies fail in strong trends
• Trend systems bleed during choppy reverts
• Random walks are dangerous to both
With Regime Reaper, you no longer have to guess — you measure.
💼 Ideal Use Cases
• Trend vs Mean-Reversion Filters
• System Mode Switching (Auto Toggle)
• Volatility Regime Adaptation
• Signal Confidence Boosting (by regime match)
• Portfolio Allocation Strategy Filters
🧬 Default Config
• Composite Model: All 15 metrics ON
• Trending Threshold: +0.15
• Reversion Threshold: −0.15
• Adaptive Filtering via Percentile Ranks
🧬 In Summary
Regime Reaper | QuantEdgeB is more than a filter — it's a regime recognition system built on powerful statistical indicators and dynamic Z-Score fusion. It doesn’t just observe behavior; it categorizes it.
Use it to confirm entries, time exits, suppress signals in bad regimes, or dynamically change your system logic.
📌 Trade the Right Logic in the Right Market | Powered by QuantEdgeB
🔹 Disclaimer: No indicator guarantees future performance.
🔹 Tip: Tune metric

Risk-On - Risk-Off 3 Alarm System V2📍 Risk-On / Risk-Off Alarm Labels
This overlay indicator visually displays the activation status of three key risk criteria directly on the chart using colored labels:
Trend – Flagged red when price is below the 20-day EMA.
Breadth – Flagged red when net new 52-week highs (NASDAQ + NYSE) are negative.
Momentum – Flagged red when the PPO histogram is negative.
The top label shows the total number of risk-off criteria active (0 to 3).
Green dots = condition favorable (risk-on).
Red dots = condition unfavorable (risk-off).
Use this for fast visual confirmation of market conditions and to support allocation or de-risking decisions.
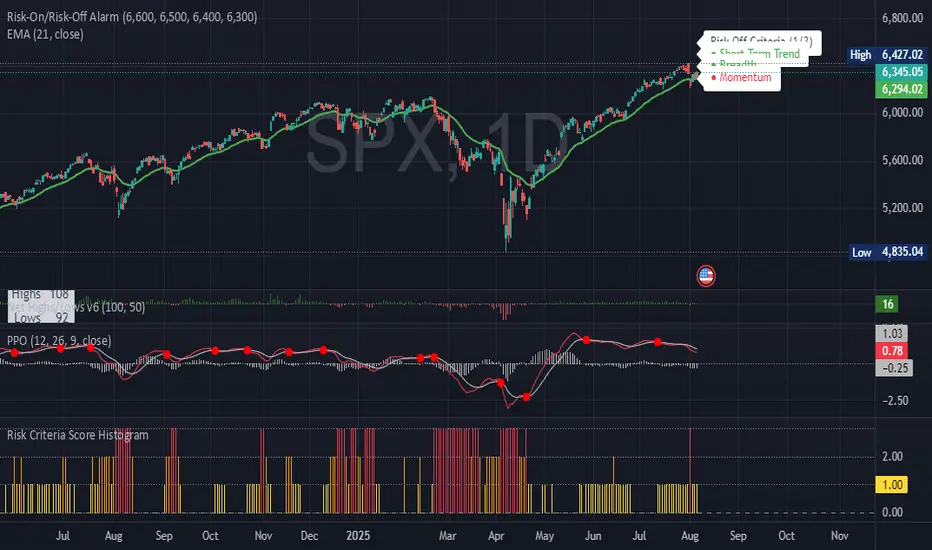
Risk Criteria Score Histogram V2📊 Risk Criteria Score Histogram
This indicator visualizes a daily risk score ranging from 0 to 3, based on three core market conditions:
Trend Risk – Activated when price is below the 20-day EMA.
Breadth Risk – Triggered when net new 52-week highs (NASDAQ + NYSE) are negative.
Momentum Risk – Flagged when the PPO histogram turns negative.
Each day, the script calculates how many of these criteria are signaling risk-off conditions. The result is plotted as a color-coded histogram:
🟩 0 – No risk signals (favorable environment)
🟨 1 – Mild caution
🟧 2 – Elevated risk
🟥 3 – All signals active (risk-off conditions)
This tool helps traders track shifts in market conditions and adjust exposure accordingly. Ideal for macro and swing trading perspectives.

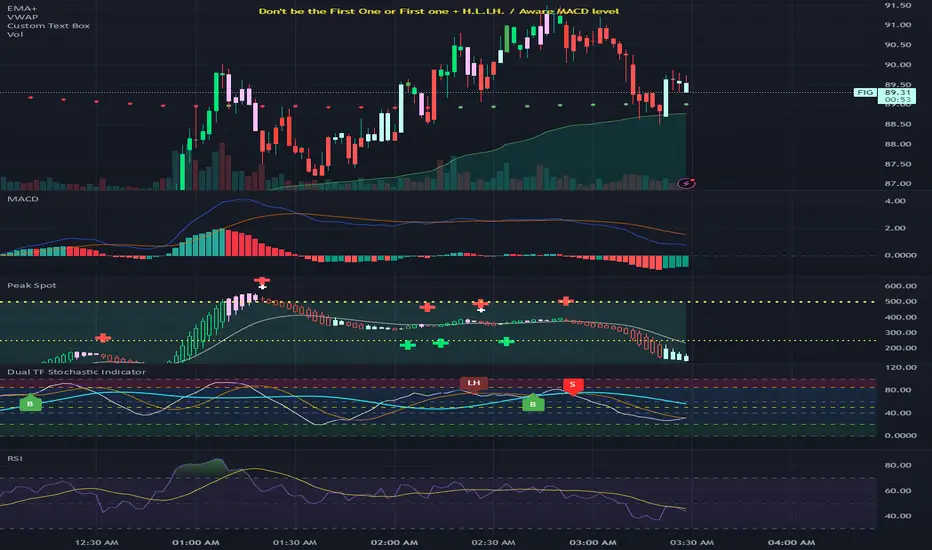
Spot the Peak & BottomCombines Heikin-Ashi candlesticks with MACD histogram analysis to identify potential market reversals and trend continuations. The script provides advanced pattern recognition with visual signals and alerts.
Core Components
1. Technical Foundation
Heikin-Ashi Candlesticks: Modified candlestick calculation that smooths price action
MACD Histogram: Custom STMC (Smooth Trend Momentum Change) oscillator
Multiple Price Sources: Support for open, high, low, close, and various averages (hl2, hlc3, ohlc4, hlcc4)
2. Pattern Detection System
Bullish Patterns:
HA D ↑ → HA ↑: Divergence resolution (Heikin-Ashi bearish but histogram strengthening, then turning bullish)
Normal Rise: HA rising + histogram strengthening/maintaining
Bottom Reversal: HA falling but histogram strengthening
Bearish Patterns:
HA U ↓ → HA ↓: Divergence resolution (Heikin-Ashi bullish but histogram weakening, then turning bearish)
Top Reversal: HA rising but histogram weakening
Strong Downtrend: HA falling + histogram weakening
Divergence Patterns:
HA D ↓: Heikin-Ashi bullish but momentum weakening
HA D ↑: Heikin-Ashi bearish but momentum strengthening
3. Signal Classification System
Bullish Signals (▲):
Bull Highlight: Higher HA close than previous signal (strongest)
Bull Normal: Normal signal within neutral range (-100 to 100)
Bull Gray: Normal signal outside neutral range
Bearish Signals (▼):
Bear Highlight: Lower HA close than previous signal (strongest)
Bear Normal: Normal signal within neutral range (-100 to 100)
Bear Gray: Normal signal outside neutral range
Transition Signals:
HA DD: Hollow green to hollow red transition
HA UU: Hollow red to hollow green transition
4. Visual Features
Color Coding:
Green/Lime: Bullish patterns and signals
Red/Orange: Bearish patterns and signals
Pink/Cyan: Divergence conditions
White: Neutral signals
Background Zones:
Upper Zone (50-500): Overbought/extreme high areas
Lower Zone (-50 to -500): Oversold/extreme low areas
Reference Lines: Do Not Short (-500), Do Not Long (500), Semi-lines (±250)
Display Modes:
Hybrid: Shows both MACD and Heikin-Ashi
MACD: MACD line and signal only
Histogram: Histogram only
5. Alert System
The script provides comprehensive alerts for:
Bull/Bear signal types (Highlight, Normal, Neutral Area)
HA DD/UU transitions
Divergence start/end conditions
6. Customization Options
MACD Settings: Fast/slow lengths, signal parameters
UI Options: Colors, display modes, background fills
Pattern Detection: Enable/disable various pattern types
Divergence Styling: Custom colors for divergence conditions
This indicator is particularly useful for traders who want to combine the smoothing benefits of Heikin-Ashi with the momentum insights of MACD for more accurate entry and exit timing.
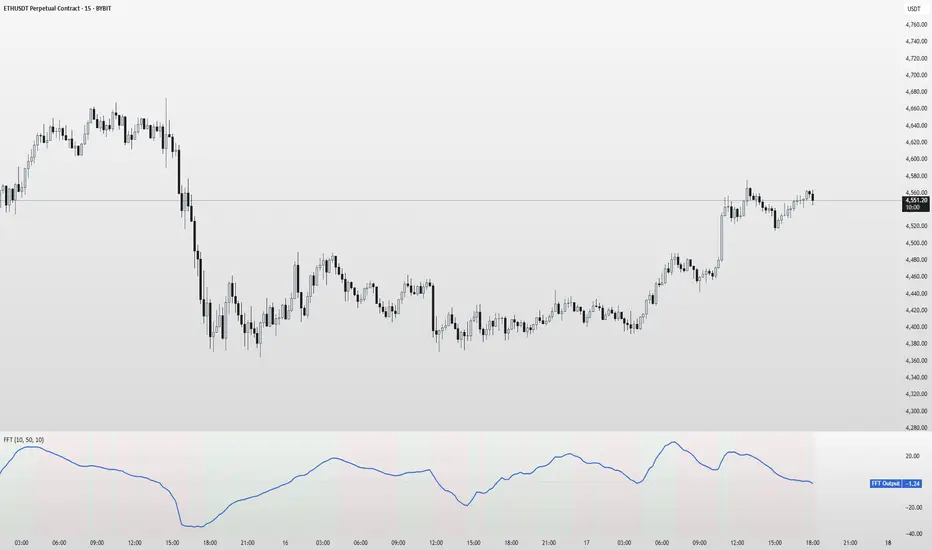
FFT Signal AnalyzerFFT Signal Analyzer
The FFT Signal Analyzer uses a simplified Fast Fourier Transform (FFT) approach to extract dominant cyclical components from price data. By detrending and applying adaptive smoothing, the indicator highlights frequency-driven signals that traditional indicators often miss.
This tool is ideal for traders who want to visualize cyclical market behavior, identify turning points, and confirm entries/exits with frequency-based momentum signals.
How it works:
Removes price trend via detrending (moving average subtraction)
Applies a bandpass filter (EMA) to isolate dominant frequency components
Normalizes the signal using a z-score for consistent visibility
Amplifies the signal for easy interpretation
Highlights slope changes with background coloring (green = rising, red = falling)
Use Cases:
Use zero-line crosses to detect cycle shifts or momentum pivots
Combine with trend filters (e.g., GRJMOM) for high-probability setups
Ideal for detecting underlying rhythm in sideways or oscillating markets
Best for:
Swing traders, scalpers, and cycle analysts looking for frequency-aware confirmation signals
Works on all timeframes and asset classes
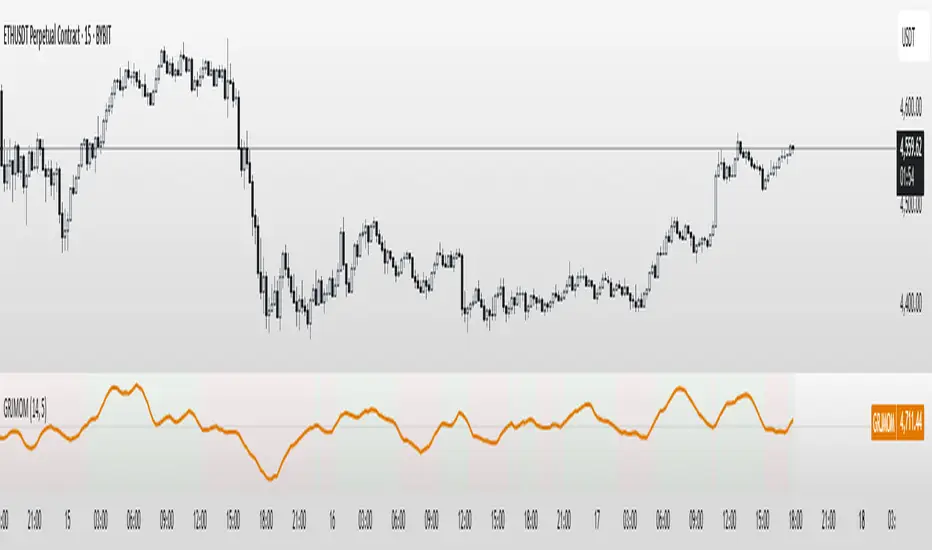
GRJMOM - Risk-Adjusted MomentumGRJMOM – Risk-Adjusted Momentum
GRJMOM stands for Generalized Risk-Adjusted Momentum. This indicator adjusts traditional momentum by dividing it by realized volatility over the same formation period. The result is a cleaner, more risk-sensitive momentum signal designed to avoid momentum crashes and volatility-driven false breakouts.
How it works:
Calculates raw momentum: Close - Close
Computes realized volatility using standard deviation of log returns
Outputs a risk-adjusted momentum score (Momentum / Volatility)
Optional smoothing can be applied to reduce short-term noise
Background coloring highlights bullish (green) and bearish (red) regimes
Use Cases:
GRJMOM > 0 suggests a bullish risk-adjusted trend
GRJMOM < 0 indicates a weakening or bearish trend
Can be used as a trend confirmation filter
Pairs well with cycle indicators like HHT or FFT for timing
Best for:
Swing traders, trend followers, and systematic strategy builders looking for smarter momentum signals with built-in risk awareness
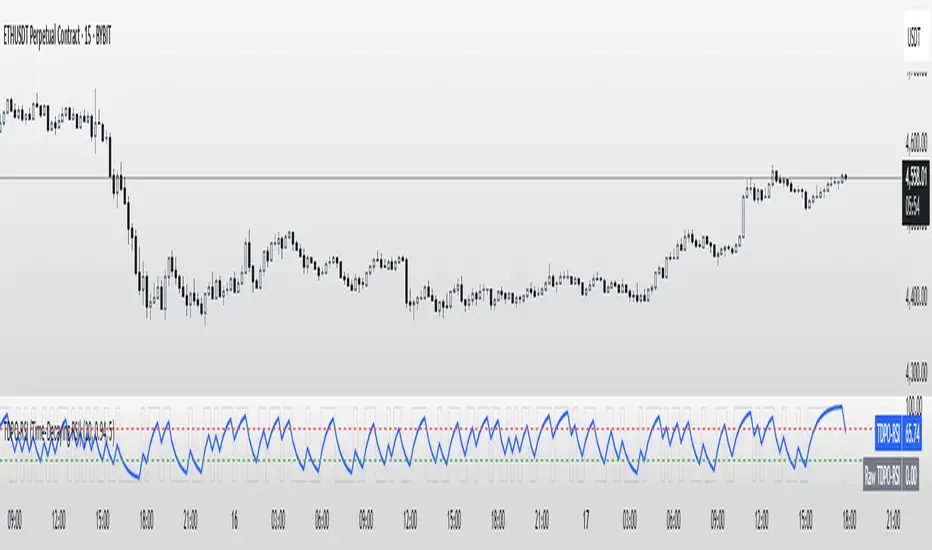
TDPO-RSI (Time-Decaying Percentile RSI)TDPO-RSI (Time-Decaying Percentile RSI)
TDPO-RSI is a modern, statistically-enhanced momentum indicator that improves on traditional RSI by using percentile-based analysis with exponential time decay. Instead of averaging gains and losses equally, this indicator ranks them by size and weights recent data more heavily—resulting in a more responsive and noise-resistant signal.
How it works:
Calculates percentile rank of gains and losses over a lookback window
Applies a decay factor (lambda) to give more weight to recent price action
Outputs a percentile-based RSI value between 0 and 100
Optional smoothing via EMA for clearer crossover signals
Key Uses:
Identify overbought/oversold zones (default: 70/30)
Use raw vs. smoothed RSI crossovers for entries
Detect momentum shifts earlier than traditional RSI
Suitable for scalping, trend continuation, and reversal setups
Inputs:
Lookback Length: Number of bars used for percentile calculation
Decay Factor (lambda): How quickly older data fades in influence (0.80–0.99)
Smoothing EMA: Smooths the final output to reduce noise
Tip: Combine with price structure and volume for best results. Higher timeframes can be used for trend context, while lower timeframes help with precise entries.
This tool is ideal for traders who want adaptive momentum analysis rooted in statistical behavior.
Fundur - Trend LinesFundur - Trend Lines: Complete Trading Indicator Guide
Indicator Overview
The Fundur - Trend Lines is an advanced multi-layered trend analysis system that combines adaptive trend line technology, momentum analysis, and intelligent signal generation into one comprehensive trading tool. This indicator goes beyond traditional moving averages by utilizing volatility-adjusted trend lines that dynamically adapt to market conditions, providing traders with precise trend strength measurements and actionable trading signals.
What Makes Trend Lines Unique?
The Trend Lines indicator introduces Adaptive Trend Line Technology - a sophisticated methodology that uses Average True Range (ATR) calculations to create trend lines that respond intelligently to market volatility. Unlike static indicators, Trend Lines provides dynamic analysis that adapts its sensitivity based on current market conditions, offering more accurate trend identification and strength assessment.
Core Methodology
The indicator operates on the principle that trend strength can be quantified by analyzing the relationship between multiple adaptive trend lines, momentum indicators, and market structure. By combining Alignment Analysis , Distance Measurements , Momentum Confirmation , and Volatility Expansion Potential , the system generates a comprehensive trend strength score from 0-100% with corresponding trading signals.
Key Features
🎯 Adaptive Trend Line System Slow Trend Line : Primary trend direction with lower sensitivity for major trend identification Fast Trend Line : Higher sensitivity trend line for early trend change detection Volatility Adaptation : Both lines automatically adjust to market volatility using ATR calculations Cloud Visualization : Colored areas between trend lines show trend strength and direction
📊 Comprehensive Trend Strength Analysis Quantified Strength (0-100%) : Precise trend strength measurement combining multiple factors Alignment Score : Measures agreement between multiple trend line systems Distance Analysis : Evaluates price proximity to trend lines using ATR normalization Momentum Integration : Incorporates Awesome Oscillator for momentum confirmation Squeeze Factor : Identifies volatility expansion potential for breakout opportunities
🧠 Intelligent Signal Generation Position Signals : Clear ADD LONG, ADD SHORT, REDUCE, HOLD recommendations Risk Zone Classification : STRONG, MEDIUM, WEAK trend categorization Trend Direction : Bullish, Bearish, or Neutral trend identification Dynamic Updates : Real-time signal adjustments based on changing conditions
⚡ Enhanced Momentum Analysis Smoothed Momentum : Configurable momentum smoothing to reduce noise Acceleration Detection : Identifies momentum acceleration and deceleration Divergence Alerts : Detects price-momentum divergences for reversal warnings Directional Bias : Momentum confirmation for trend direction validation
🔍 Advanced Market Structure Detection Momentum Squeeze : Identifies low-volatility periods preceding major moves Volatility Expansion : Detects when markets break out of consolidation phases Trend Weakness Detection : Early warning system for deteriorating trends Structure Transition : Identifies when trends change character or direction
🎨 Professional Visual Interface Comprehensive Analysis Table : All key metrics displayed in organized format Visual Strength Bar : Graphical representation of trend strength Color-Coded Components : Intuitive color scheme for quick analysis Customizable Display : Flexible positioning and sizing options
Setup Guide
Step 1: Adding the Indicator
Open TradingView and navigate to your desired chart Click the "Indicators" button or press "/" key Search for "Fundur - Trend Lines" Add the indicator to your chart
Step 2: Basic Configuration
Main Features Settings ✅ Show Trend Analysis Table : ON (Essential for comprehensive analysis) ✅ Enable Trend Strength Analysis : ON (Core functionality) ✅ Generate Trading Signals : ON (For position management guidance)
Trend Lines Display ✅ Show Slow Trend Line : ON (Primary trend identification) ✅ Show Fast Trend Line : ON (Early signal detection) Trend Cloud Transparency : 89% (Default recommended, adjust for visibility)
Table Positioning Table Position : Top Right (recommended for most setups) Table Size : Normal (adjust based on screen size)
Step 3: Advanced Analysis Configuration
Enhanced Features (Optional) ✅ Enhanced Momentum Analysis : ON (for more accurate signals) ✅ Divergence Detection : ON (for reversal warnings) ⚠️ Momentum Squeeze Analysis : OFF initially (can add visual complexity)
Sensitivity Settings Divergence Sensitivity : 5 (Default - lower = more sensitive) Momentum Smoothing : 3 (Default - higher = smoother signals)
Step 4: Alert Configuration
Essential Alerts (Recommended) Trading Signal Alerts : Enable for position changes Trend Strength Change Alerts : Enable for trend monitoring Strength Change Threshold : 15% (Default recommended)
Advanced Alerts (Optional) Divergence Alerts : Enable for reversal warnings Early Weakness Alerts : Enable for risk management Momentum Squeeze Alerts : Enable for breakout opportunities Trend Line Cross Alerts : Enable for level-based signals
Basic Trading Guide
Understanding Trend Strength
The indicator's foundation is the Trend Strength Score - a quantified measurement (0-100%) that combines four key factors:
Strong Trends (75%+ Strength) 🟢 Characteristics : High alignment, close price-to-trend proximity, strong momentum Signals : ADD LONG (bullish) or ADD SHORT (bearish) Strategy : Aggressive position building, trend continuation trades Risk : Lower risk due to strong trend confirmation
Medium Trends (35-75% Strength) 🟡 Characteristics : Mixed signals, moderate alignment, transitional phases Signals : HOLD current positions Strategy : Conservative approach, wait for clearer signals Risk : Medium risk, requires careful monitoring
Weak Trends (Below 35% Strength) 🔴 Characteristics : Poor alignment, distant from trend lines, weak momentum Signals : REDUCE positions or CLOSE Strategy : Risk reduction, position unwinding Risk : High risk, trend likely changing or failing
Entry Strategies
Primary Strategy: Trend Continuation Entries Setup : Strong trend strength (75%+) with clear directional bias Entry Trigger : ADD LONG or ADD SHORT signal confirmation Direction : Follow the trend direction (Bullish ⬆ or Bearish ⬇) Timing : Enter on signal generation or price pullback to trend lines
Stop Loss Placement Conservative Method : Beyond the opposite trend line Aggressive Method : Below/above recent swing points For Long Positions : Below the Slow Trend Line For Short Positions : Above the Slow Trend Line Dynamic Adjustment : Move stops with trend line progression
Profit Taking Strategy
For Long Positions (Bullish Trend): Take 50% profits when trend strength begins declining from peak Take another 25% when trend strength drops below 60% Close remaining position when REDUCE signal appears Trail stops using Fast Trend Line for remaining position
For Short Positions (Bearish Trend): Take 50% profits when trend strength begins declining from peak Take another 25% when trend strength drops below 60% Close remaining position when REDUCE signal appears Trail stops using Fast Trend Line for remaining position
Alternative Strategy: Divergence-Based Reversal Entries Setup : Bullish or bearish divergence detected with weakening trend strength Entry : On trend direction change confirmation Risk Management : Tight stops due to counter-trend nature Targets : Opposite trend line or previous swing levels
Risk Management Framework
Position Sizing Based on Trend Strength Strong Trends (75%+) : Full position size (within risk tolerance) Medium Trends (35-75%) : Reduced position size (50-75% of normal) Weak Trends (Below 35%) : Minimal or no new positions Transitional Periods : Smallest position sizes due to uncertainty
Dynamic Risk Adjustment Increasing Strength : Can add to positions gradually Decreasing Strength : Begin profit-taking and position reduction Rapid Strength Loss : Quick position reduction or exit Divergence Warning : Tighten stops and prepare for reversal
Analysis Setups
Setup 1: Scalping Configuration (1-5 minute charts)
Settings Optimization: Momentum Smoothing: 2 (more responsive) Divergence Sensitivity: 3 (higher sensitivity) Enhanced Momentum Analysis: ON All alerts: ON for rapid signal updates
Visual Settings: Table Size: Small (less screen space) Table Position: Top Right Trend Cloud Transparency: 85% (subtle background)
Trading Approach: Focus on quick ADD signals in strong trends Use Fast Trend Line for entry timing Quick profit-taking at first sign of strength decline Very tight risk management due to lower timeframe noise
Setup 2: Day Trading Configuration (5-15 minute charts)
Settings Optimization: All default settings work well Enable Momentum Squeeze Analysis for breakout identification Divergence Detection: ON for reversal warnings Trend Strength Change Threshold: 12% (more sensitive)
Visual Settings: Table Size: Normal Show all trend analysis components Trend Cloud Transparency: 89% (default)
Trading Approach: Wait for clear trend strength above 65% before entering Use momentum squeeze breakouts for early entries Hold positions through medium strength phases Exit on REDUCE signals or strength below 40%
Setup 3: Swing Trading Configuration (1-4 hour charts)
Settings Optimization: Momentum Smoothing: 4 (smoother for higher timeframe) Divergence Sensitivity: 7 (less sensitive, higher quality signals) Enhanced Momentum Analysis: ON Early Weakness Alerts: ON (important for swing trades)
Visual Settings: Table Size: Normal or Large Focus on trend strength and direction components Enable all visual features for comprehensive analysis
Trading Approach: Require trend strength above 70% for new positions Hold through temporary strength dips if above 50% Use divergence signals for early exit warnings Focus on major trend changes for position adjustments
Setup 4: Position Trading Configuration (4H-Daily charts)
Settings Optimization: Momentum Smoothing: 5 (maximum smoothing) Divergence Sensitivity: 10 (only high-quality divergences) Strength Change Threshold: 20% (major changes only) Focus on trend direction and strength alerts
Visual Settings: Table Size: Large (detailed analysis) Clean visual setup focusing on major components Minimal clutter for long-term perspective
Trading Approach: Only enter on very strong trends (80%+ strength) Hold through significant strength fluctuations Focus on major trend direction changes Use weekly/monthly trend alignment for confirmation
Setup 5: Multi-Asset Analysis Configuration
For Forex Pairs: Standard settings work well due to 24-hour markets Pay attention to session-based strength changes Use momentum squeeze for breakout trading Enable all alert types for continuous monitoring
For Cryptocurrency: Reduce momentum smoothing (2-3) due to high volatility Increase divergence sensitivity (3-4) for early warnings Focus on strength changes above 20% threshold Use squeeze analysis for breakout opportunities
For Stock Indices: Standard settings appropriate for most indices Enable early weakness alerts for risk management Consider market hours for signal validity Use higher timeframes for better signal quality
Visual Components
Trend Analysis Table Trend Strength : Percentage with visual strength bar Trend Signal : Current position recommendation Risk Zone : STRONG/MEDIUM/WEAK classification Alignment : Trend line agreement analysis Distance : Price proximity to trend lines Momentum : Current momentum direction and strength
Trend Lines and Clouds Colored Clouds : Green for bullish trends, red for bearish trends Cloud Intensity : Opacity reflects trend strength Dynamic Colors : Automatically adjust based on trend direction
Momentum Squeeze Visualization Yellow Highlights : Above and below price during squeeze periods Squeeze Indication : Identifies low-volatility consolidation Breakout Preparation : Visual cue for potential explosive moves
Alert System
Trading Signal Alerts ADD LONG : Strong bullish trend confirmed ADD SHORT : Strong bearish trend confirmed REDUCE : Trend weakness detected, position reduction recommended HOLD : Maintain current positions, no change needed
Trend Analysis Alerts Strength Increase : Trend gaining momentum Strength Decrease : Trend losing momentum Early Weakness : Warning of potential trend deterioration Trend Direction Change : Major trend shift detected
Technical Alerts Bullish Divergence : Price falling but momentum rising Bearish Divergence : Price rising but momentum falling Momentum Squeeze Start : Volatility contraction beginning Momentum Squeeze End : Breakout from low volatility period Trend Line Cross : Price crossing above/below trend lines
Setting Up Alerts Enable desired alert types in indicator settings Create TradingView alerts using "Fundur - Trend Lines" as source Configure notification methods (email, SMS, app notifications) Test alerts with paper trading before live implementation Adjust alert frequency settings to avoid spam
Best Practices
Trend Strength Interpretation Above 75% : High confidence trades, full position sizes 50-75% : Moderate confidence, reduced positions Below 50% : Low confidence, minimal or no positions Rapid Changes : Pay attention to sudden strength shifts
Signal Management Don't Chase : Wait for clear signals rather than predicting Confirm with Price Action : Use chart patterns for additional confirmation Respect Risk Zones : Adjust position sizes based on trend classification Monitor Alignment : Strong alignment increases signal reliability
Multi-Timeframe Integration Higher Timeframe Bias : Use daily/weekly for overall trend direction Lower Timeframe Entries : Use hourly/15min for precise entry timing Confirmation Requirement : Ensure alignment between timeframes Conflict Resolution : Higher timeframe takes precedence
Common Mistakes to Avoid
Signal Misinterpretation Ignoring Trend Strength : Don't trade weak signals (below 60%) Fighting the Trend : Don't go against strong trend directions Overreliance on Single Component : Consider all analysis factors Impatience : Wait for clear STRONG trend classification
Risk Management Errors Fixed Position Sizes : Adjust sizes based on trend strength Ignoring REDUCE Signals : Take profits when indicator suggests No Stop Losses : Always use stops beyond trend lines Overleveraging Weak Signals : Use smaller positions in MEDIUM zones
Technical Analysis Errors Ignoring Divergences : Pay attention to momentum warnings Missing Squeeze Opportunities : Watch for breakout setups Poor Timeframe Selection : Match timeframe to trading style Alert Fatigue : Don't enable too many alerts simultaneously
Advanced Techniques
Divergence Trading Early Reversal Detection : Use divergences to anticipate trend changes Confirmation Required : Wait for trend strength decline confirmation Tight Risk Management : Use smaller positions for counter-trend trades Quick Exits : Take profits rapidly on divergence trades
Momentum Squeeze Strategies Breakout Preparation : Position before squeeze resolution Direction Bias : Use trend direction for breakout direction Volume Confirmation : Combine with volume analysis when possible False Breakout Protection : Use tight stops for failed breakouts
Multi-Component Analysis Alignment Priority : Perfect alignment (100%) provides highest confidence Distance Consideration : Closer to trend lines = higher probability Momentum Confirmation : Rising momentum supports trend direction Squeeze Integration : High squeeze factor increases breakout potential
Dynamic Position Management Scaling In : Add to positions as trend strength increases Scaling Out : Reduce positions as trend strength decreases Stop Trailing : Move stops with Fast Trend Line progression Profit Optimization : Use strength peaks for profit-taking timing
Conclusion
The Fundur - Trend Lines indicator represents a sophisticated approach to trend analysis, combining adaptive trend line technology with comprehensive strength measurement and intelligent signal generation. By quantifying trend strength through multiple analytical components, this indicator provides traders with objective, data-driven insights for making informed trading decisions.
The indicator's strength lies in its ability to adapt to changing market conditions while providing clear, actionable signals. The comprehensive trend strength analysis removes guesswork from trend trading, allowing traders to size positions appropriately and manage risk effectively based on quantified market conditions.
Success with the Trend Lines indicator comes from understanding that trend strength is dynamic and requires continuous monitoring. The 0-100% strength scale provides an objective framework for position management, while the multi-component analysis ensures robust signal generation across different market conditions.
Remember that this indicator works best when combined with proper risk management, position sizing, and market context awareness. Start with conservative settings and smaller position sizes while learning the indicator's behavior in different market environments. The comprehensive alert system helps maintain awareness of changing conditions, but successful trading still requires discipline and adherence to your trading plan.
For optimal results, practice with the indicator across different timeframes and market conditions, always prioritizing risk management over profit potential, and maintaining realistic expectations about market behavior and indicator performance.

Stochastic MACDStochastic MACD Indicator: Quick Guide
This Pine Script indicator, "Stochastic MACD" (SMACD), blends MACD and Stochastic Oscillator principles to help you spot momentum shifts and potential reversals.
What it Shows:
SMACD Line: Tracks momentum.
Signal Line: Averages the SMACD line, creating crossovers.
Histogram: Visualizes momentum strength, changing color with direction.
Overbought/Oversold Levels: (Default 10 and -10) Help identify stretched market conditions. Adjustable in settings.
Visual Signals (Triangles):
Red Down Arrow (Overbought Signal): Appears when both SMACD and Signal lines are above the Overbought level (default 10) AND SMACD crosses the Signal line upwards. This suggests strong overbought conditions and a potential reversal down.
Green Up Arrow (Oversold Signal): Appears when both SMACD and Signal lines are below the Oversold level (default -10) AND SMACD crosses the Signal line upwards. This suggests potential buying opportunities from oversold conditions and a possible reversal up.
How to Use It:
Confirm Trends: Use the histogram and line directions.
Spot Reversals: Look for the red and green triangles for quick alerts.
Combine: Always use with other analysis like price action or support/resistance.
Important: This is an analytical tool, not financial advice. Trading involves risk.

Mayfair Fx Scalper✅ Mayfair FX Scalper — By EastWave Capital
The Mayfair FX Scalper is a precision-focused, closed-source indicator designed for short-term intraday trading, particularly scalping on lower timeframes such as 1-minute, 3-minute, and 5-minute charts. This tool is developed by EastWave Capital and is based on a combination of Relative Strength Index (RSI) extremes and specific candlestick structure patterns to detect potential exhaustion and reversal points in the market.
🔍 How It Works:
The algorithm operates by evaluating three core elements:
RSI Extremes:
RSI is calculated using default settings.
Buy signals are considered only when the RSI on the previous candle is below 22 (oversold), and the current candle is bullish, while the previous one was bearish.
Sell signals are considered when the RSI on the previous candle is above 78 (overbought), and the current candle is bearish, while the previous one was bullish.
Candle Confirmation Logic:
The system waits for candle confirmation (e.g., shift in bullish/bearish structure) rather than triggering signals based on RSI alone.
This avoids false triggers in strong trends and filters weak entries.
SL/TP Estimation (Visual):
While not automatically placing orders, the indicator can optionally display lines or small labels showing a Stop Loss at the previous swing high/low (±0.5) and TP levels at 1R, 2R, and 3R based on that stop.
These visual aids help traders plan risk/reward and exits manually.
📈 How to Use:
Timeframes: Best suited for 1M, 3M, and 5M charts
Markets: Works well on Gold (XAU/USD), Forex majors, Indices, and Crypto
Session: Performs best during high volatility sessions (London & NY)
Use Case:
Wait for a signal label to appear after a clear momentum move.
Confirm price action and trend context.
Use provided visual SL/TP labels or apply your manual RR planning.
Combine with structure breaks, FVG zones, or liquidity sweeps for confluence.
⚠️ Important Notes:
This indicator does not repaint.
No automatic trades are executed. Signals are visual.
Not intended for use in isolation; best when combined with proper trade management and confirmation tools.
Past performance does not guarantee future results. Always manage risk appropriately

Ultimate Precision Buy/Sell with SL - Clean Labels FIXThis is a premium indicator designed for traders who demand accuracy, simplicity, and clean visual signals.
✅ Key Features:
📈 Precise Buy/Sell entries based on trend confirmation (EMA) and momentum (RSI)
🛡️ Automatic Stop Loss (SL) drawn for every trade, calculated from ATR
🔄 SL line dynamically moves with each new candle to reflect live action
❗ Only one active signal at a time – no clutter, no repaints
⏱ Optimized for 1H timeframe
💰 Best for Forex pairs, Gold (XAUUSD), Silver (XAGUSD), Platinum (XPTUSD)
🧠 How it works:
Buy Signal: When fast EMA > slow EMA & RSI crosses above 30
Sell Signal: When fast EMA < slow EMA & RSI crosses below 70
A single SL line is drawn per trade and remains until either:
Opposite signal appears, or
SL is hit
⚠️ No repainting. No noise. Just precision.
If you want to trade smart, clean and with confidence – this indicator is built for you.

RSI-CCI Momentum ScreenerRSI-CCI Momentum Screener;
How to Use:
Apply this script to 1H or 4H timeframe
Works well for NSE stocks, crypto, or forex
Look for a green label “BUY” that shows when the screener conditions are met

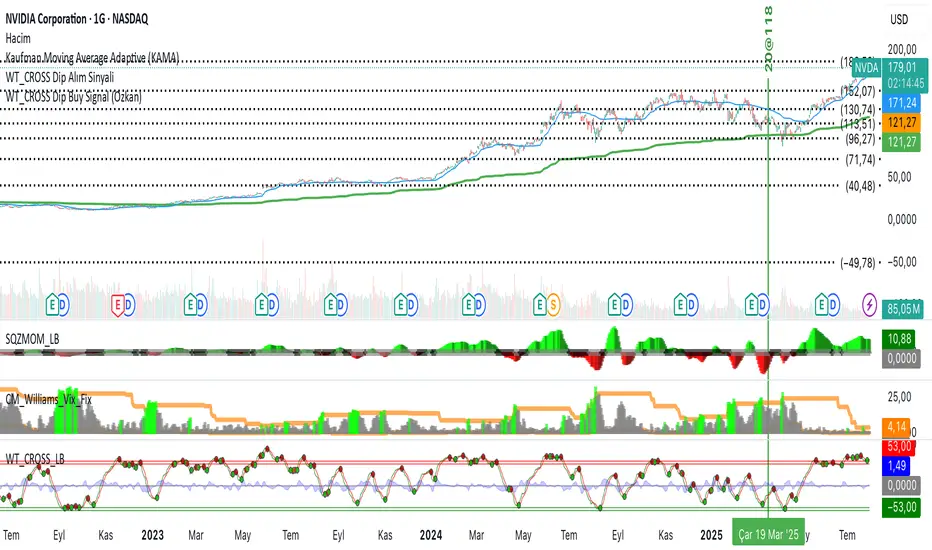
WT_CROSS Dip Buy Signal(ozkan)This script identifies potential buy opportunities based on WaveTrend (WT_CROSS) momentum crossing below the -60 level — often indicating oversold conditions.
Additional filters include price being above the Kaufman Adaptive Moving Average (KAMA) and volume below the 5-period average, which helps isolate pullbacks within an uptrend.
Buy Signal Conditions:
WT1 < -60
Price > KAMA
Volume < 5-period SMA of volume
Purpose:
To capture early entries at possible local bottoms during bullish trends while avoiding high-volume breakdown traps.
🔔 You can also set an alert based on this condition.
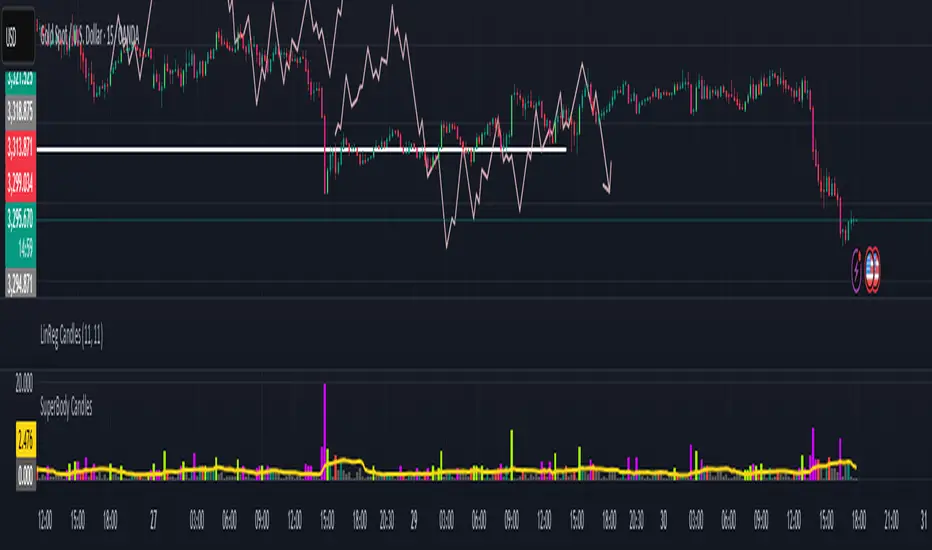
SuperBody CandlesInspired by the original script by Gautam_Dixit.
Updated to the latest Pine Script v6, now featuring fully customizable color settings so users can tailor hues to their preference.
Description:
The Momentum Candle indicator highlights bars whose real body significantly exceeds the 15-period average. 'Super' bullish and bearish candles (body ≥ 1.5× avg) receive standout colors, while above-average and below-average bars are tinted differently to reflect momentum strength.
Momentum DivergenceOverview
The Momentum Divergence Oscillator is a valuable tool designed for traders who are familiar with basic charting but want to deepen their market insights. This indicator combines a momentum calculation with divergence detection, presenting the data in an intuitive way with a blue momentum line and colored divergence signals ("Bull" and "Bear"). It’s perfect for refining entry and exit points across various timeframes, especially for scalping or swing trading strategies.
Understanding the Concepts
What is Momentum?
Momentum measures the speed and strength of a price movement by comparing the current closing price to a previous close over a set period. In this indicator, it’s calculated as the difference between the current close and the close from a user-defined number of bars ago (default: 10). A rising momentum line indicates accelerating upward momentum, while a falling line suggests slowing momentum or a potential reversal. This helps you gauge whether a trend is gaining power or losing steam, making it a key indicator for spotting overbought or oversold conditions.
What is a Divergence?
A divergence occurs when the price action and the momentum indicator move in opposite directions, often signaling a potential trend reversal. The Momentum Divergence Oscillator highlights two types:
Bullish Divergence: When the price forms a lower low (indicating weakness), but the momentum shows a higher low (suggesting underlying strength). This can foreshadow an upward reversal.
Bearish Divergence: When the price reaches a higher high (showing strength), but the momentum records a lower high (indicating fading momentum). This may hint at an impending downward turn.
How the Indicator Works
The indicator plots a momentum line in a separate pane below your chart, giving you a clear view of price momentum over time. It also scans for divergences using adjustable lookback periods (default: 5 bars left and right) and a range window (default: 5-60 bars) to ensure relevance. When a divergence is detected, it’s visually highlighted, and you can customize the sensitivity through input settings like the momentum length and pivot lookback. Alerts are included to notify you of new divergence signals in real-time, saving you from constant monitoring.
How to Apply It
Identifying Opportunities: Use bullish divergences ("Bull") as a cue to consider long positions, especially when confirmed by support levels or a moving average crossover. Bearish divergences ("Bear") can signal short opportunities, particularly near resistance zones.
Combining with Other Tools: Pair this oscillator with indicators like the Relative Strength Index (RSI) or volume analysis to filter out false signals and increase confidence in your trades. For example, a bullish divergence with rising volume can be a stronger buy signal.
Timeframe Flexibility: Test it on shorter timeframes (e.g., 5-minute charts) for quick scalping trades or longer ones (e.g., 1-hour or 4-hour charts) for swing trading, adjusting the momentum length to suit the market’s pace.
Alert Setup: Enable the built-in alerts to get notified when a divergence forms, allowing you to react promptly without staring at the screen all day.
Strategy Example
Spot a bullish divergence on a 15-minute chart where the price hits a lower low, but the momentum rises.
Confirm with a break above a 20-period EMA and increasing volume.
Enter a long position with a stop-loss below the recent low and a take-profit near the next resistance level.
Customization Tips
Adjust the "Momentum Length" (default: 10) to make the oscillator more or less sensitive—shorter lengths react faster, while longer ones smooth out noise.
Tweak the "Pivot Lookback" settings to widen or narrow the divergence detection range based on your trading style.
Use the "Range Upper/Lower" inputs to focus on divergences within a specific timeframe that matches your strategy.
Important Considerations
b]This indicator is a technical analysis tool, not a guaranteed trading system. Always pair it with a solid strategy and strict risk management, such as setting stop-losses.
In strong trending markets, divergences can sometimes produce false signals. Consider adding a trend filter (e.g., ADX below 25) to avoid whipsaws.
Experiment with the settings on a demo account or backtest to find what works best for your preferred markets and timeframes.

RSI and MACD Divergence IndicatorThe RSI and MACD Divergence Indicator is a custom Pine Script v6 indicator designed for TradingView that identifies and visualizes divergences between price movements and two technical indicators: the Relative Strength Index (RSI) and the Moving Average Convergence Divergence (MACD). Here's a brief explanation of its functionality:
Divergence Detection: The indicator detects both regular and hidden divergences for RSI, MACD (MACD Line), and Histogram. Regular bullish divergences occur when price makes a lower low but the indicator makes a higher low (suggesting a potential reversal upward), while regular bearish divergences occur when price makes a higher high but the indicator makes a lower high (suggesting a potential reversal downward). Hidden divergences indicate continuation patterns (e.g., higher low in price with a lower low in the indicator for bullish continuation).
Customizable Inputs:
Pivot Bars: Sets the number of bars used to confirm pivot highs and lows (default: 5).
RSI and MACD Parameters: Allows adjustment of RSI length (default: 14) and MACD settings (fast: 12, slow: 26, signal: 9).
Toggle Options: Enables/disables detection of regular and hidden divergences for RSI, MACD, and Histogram individually.
Confirmation: Option to wait for pivot confirmation (default: true), delaying divergence display until the pivot is fully formed.
Show Only Last Divergence: Toggles between showing only the most recent divergence (default: true) or all detected divergences (false), with previous lines and labels cleared when true.
Minimum Divergences: Sets the minimum number of divergence types required at a pivot to display (default: 1, max: 6).
Maximum Pivot Points: Limits the number of historical pivot points to check (default: 10).
Maximum Bars to Check: Restricts analysis to the last specified number of bars (default: 500).
Visualization:
Draws lines connecting the price pivot points where divergences are detected, with customizable colors, widths, and styles (solid, dashed, dotted) for RSI and MACD.
Displays a single label per pivot with vertically stacked text listing all detected divergence types (e.g., "RSI Bull Div MACD Bull Div"), using semi-transparent backgrounds (green for bullish, red for bearish) and white text.

MACD-RSI Divergence OscillatorMACD-RSI Divergence Oscillator: Dual Confirmation with Momentum + Divergence Signals
This powerful oscillator combines MACD and RSI into a single normalized visual tool, enriched with automatic divergence detection and smart signal alerts. It’s designed to give traders advanced insights into momentum shifts and trend reversals.
Key Features:
• MACD + RSI Combo: Both indicators are scaled and merged into one oscillator for clearer interpretation.
• Automatic Divergence Detection:
• Bullish & Bearish divergences on both MACD and RSI
• Highlights strong divergences when both confirm
• Trading Signals:
• Detects MACD crossovers and RSI reversals
• Smart buy/sell signals based on momentum + divergence
• Custom Oscillator View:
• Plots MACD and RSI on the same scale
• Visual zero-line, overbought/oversold levels, and customizable colors
• Optional Dashboard Table:
• Displays live indicator values, signal states, and divergence status
Ideal For:
• Spotting early trend reversals
• Confirming trade entries/exits
• Avoiding false signals using dual indicator logic
Highly customizable and suitable for all timeframes and asset types.

Market DashboardMarket Dashboard — All-in-One Technical Indicator Panel
The Market Dashboard is a powerful visual tool that consolidates key technical indicators into a single on-chart table, helping traders make faster and more informed decisions. This script includes:
RSI — Detects overbought and oversold market conditions
MACD — Shows trend momentum and crossover signals
CVD (Cumulative Volume Delta) — Highlights buyer vs. seller pressure
Volume Analysis — Flags unusually high volume
ATR (Average True Range) — Displays current market volatility
Session Detector — Automatically identifies ASIAN, LONDON, or NEW YORK sessions based on UTC time
Fully Customizable — Adjust table position and text size to fit your chart layout
Designed for traders who want a clean, real-time snapshot of market dynamics, directly on the chart.

Nexus v10Nexus v10 - Confluence-Driven Trading Indicator
The Nexus v10 is a sleek, modern, and versatile trading indicator that delivers precise buy and sell signals by synthesizing a confluence of technical factors, including Heikin Ashi candles, RSI, ADX, and EMA crossovers. The name "Nexus" captures its core strength—connecting and synthesizing multiple signals into a cohesive trading decision point. The term evokes a central hub or convergence, reflecting the script’s confluence-based approach, dynamic adaptability, and real-time precision for scalping. Designed for traders seeking clarity and efficiency, it’s a powerful tool for navigating dynamic markets.
Key Features:
Confluence-Based Signals: Combines weighted signals from Heikin Ashi, RSI, ADX, and EMA crossovers to generate high-probability buy/sell signals.
Neutral Status Logic: Limits consecutive signals to two per direction, requiring a "Neutral" status before the second signal to ensure disciplined trading.
Clean Visualization: Displays only the two most recent buy/sell signals, keeping the chart uncluttered and focused on current opportunities.
Dynamic Adaptability: Offers customizable RSI thresholds, EMA lengths, MTF settings, and dynamic overbought/oversold levels to fit any market or style.
Candle Coloring & Inside Bars: Highlights overbought/oversold conditions and inside bars with customizable colors for enhanced context.
Real-Time Debug Table: Provides live insights into signal status, RSI, MTF trends, and ADX for informed decision-making.
How It Works:
Nexus v10 integrates multiple technical factors, including MTF analysis (default: 3m, 15m, 240m, D), RSI, ADX, and EMA crossovers, to produce signals when confluence criteria are met. Signals appear as circles on the chart, with a maximum of two visible signals per direction (buy or sell). A second signal in the same direction requires a neutral status, ensuring precision. Ideal for scalping, swing, and trend trading across stocks, forex, futures, and more.
Usage Tips:
Customize settings like RSI thresholds and MTF periods to align with your trading strategy.
Use the debug table to monitor confluence factors and signal status in real-time.
Pair with sound risk management and personal analysis for optimal results.
Note:
Always backtest thoroughly in your trading environment to validate performance. Let the Nexus v10 guide your next trade with precision and clarity!

[volfgang] wave.liteThe wave.lite indicator is a simplified version of my WAVE momentum tracker indicator, designed to help traders identify market trends by analysing price action across multiple timeframes. As a simplified version of my full WAVE script, it focuses on core momentum signals and confluence for the current timeframe only.
Quick Summary
The Lite WAVE features a signal line that alternates between Red (bearish) and Blue (bullish).
It turns Blue when the WAVE line crosses above the signal and holds for 1 bar.
It turns Red when the WAVE line crosses below the signal and holds for 1 bar.
Under The Hood
The Lite WAVE aggregates close, high, low, and EMA data over a set period to measure recent price extremes and midpoint deviations, emphasizing newer action. It calculates averages for high-to-high and low-to-low differences to derive the WAVE value, smoothed for trend determination.
This lite version omits advanced divergence, specialist info box, confluence scanner and signal features from the full WAVE, focusing on momentum tracking for simplicity. It's suitable for all markets and assets; always combine with other analysis—past performance doesn't guarantee future results.
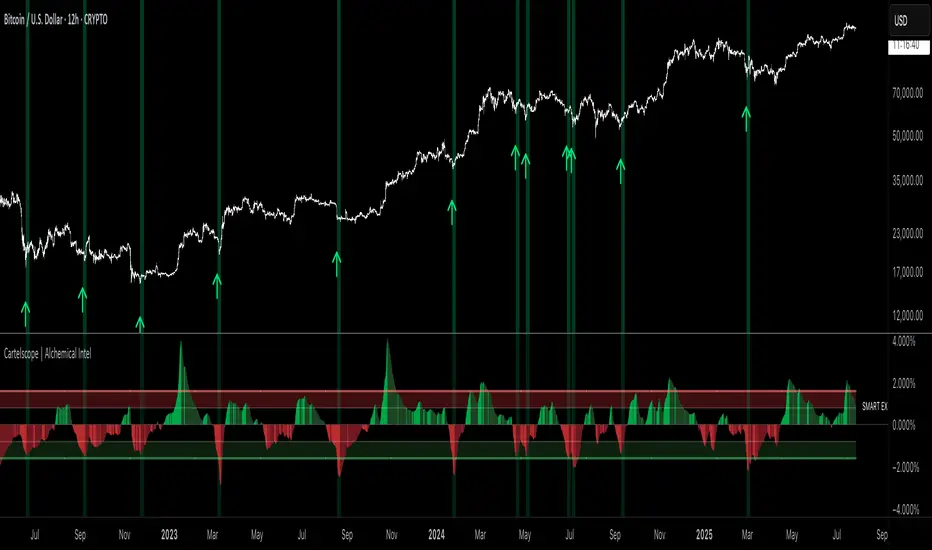
Cartelscope | Alchemical IntelSUMMARY
This unique tool looks beneath the surface of price, at a range of fundamental core catalyst metrics that tend to lead & influence price -- the price of most high cap crypto assets, most of the time.
Cartelcope offers a range of fundamental visualizations out-of-the-box, derived from first principles crypto metrics.
Like Stablecoin Supply, Coinbase Premium & Tether Dominance, as well as custom metrics that measure whale activity and macro sentiment.
Stack them vertically into a dashboard, for a top down view of some of the most relevant leading indicators. All normalized to each other.
TRADE SIGNALS
Cartelscope generates long & short signals, utilizing cumulative volume thresholds & horizontal oscillator thresholds.
Signals are designed for use with most (but certainly not all) high cap crypto assets. See the list of recommended assets at the end of these docs.
Most Cartelscope signals will make good trade entries (or exits), but no signals are perfect, and Cartelscope will never have a 100% hit rate.
ALERTS ENABLED
Cartelscope alerts are enabled out-of-the-box. With JSON automation available to Premium users.
SIGNAL CONFLUENCE
A confluence of signals from multiple metrics is a high probability trade setup.
Consider stacking & minimizing your leading indicators, for the clearest view of all signals.
Cartelscope's first two settings are important: SCOPE & LENS.
SCOPE is your data source:
What's being visualized.
LENS is your zoom:
Cumulative (zoomed out) for better long & short signals.
Realtime (zoomed in) for more precision data.
CUMULATIVE & REALTIME SIGNALS
Cumulative signals should be expected to out-perform realtime signals. They're higher timeframe, and higher conviction.
Realtime signals are shorter term. Their main use case is day to day momentum scalps, in the direction of HTF trend, with conservative targets.
Their other use case is market visualization, in a dashboard. Your focus should probably skew cumulative, but there's room for both.
SCOPES AT A GLANCE
The scopes tooltip is a helpful quickview of each use case -- expanded upon in much greater depth throughout the rest of these docs.
EXPLORING EACH SCOPE, AND THEIR USE CASES:
SMART EXCHANGE VOLUME
Volume & open interest from exchanges dominated by whales and smart money.
Divided by the opposite -- volume from 'dumb money' exchanges. Kim Chi Premium was made for that. No disrespect to our Korean friends.
Setting LENS set to cumulative reveals picture perfect buy signals, at every local low for the last 3 years.
Setting LENS to realtime offers shorter term trade signals.
The stronger the indicator print, the higher (or lower) it goes on its Y axis -- the stronger you should consider the signal.
FIAT LIQUIDITY RATIO
USDT / USD, a proxy for Tether entering (or exiting) centralized exchanges.
Expect price to follow Tether closely, in either direction.
COINBASE PREMIUM
Coinbase spot BTC premium (or discount) / BTCUSD Index
Frequent cumulative & realtime signals, for shorter term swing entries.
STABLECOIN SUPPLY
USDT + USDC market cap
Unlike Fiat Liquidity Ratio, which visualizes stablecoin inflow momentum, this metric measures market cap -- raw purchasing power across the marketplace. Which tends to reliably lead price.
In cumulative mode, signals are good, but we're less interested in them. For Stablecoin Supply, we're interested in oscillator momentum. Which reliably tends to lead price -- by days, sometimes by weeks.
In realtime mode, outsized changes to stablecoin supply tend to resolve in the direction of the change, later that same day or the next day.
BITFINEX BTC MARGIN LONGS / MARGIN SHORTS
Some call it Tether's 'man behind the curtain'. The ratio of BTC margin longs to shorts on Bitfinex plays an outsized role in day-to-day price action.
This metric paradoxically counter-trades the broader market in realtime mode, while revealing true market direction in cumulative mode.
The cumulative higher timeframe view:
In Realtime, on lower timeframes:
ESCOBAR EXPRESS
Cartelscope's most lethal weapon & highest hit rate scope.
Escobar signals are highly directionally accurate, within a 24-48 hour window. Cumulative signals should be considered dated after 48 hours.
Realtime signals are usually excellent.
TETHER DOMINANCE
USDT.D
Cumulative USDT.D generates extraordinary buy signals at key swing low pivots, like smart exchange volume.
Realtime USDT.D tends to generate well-timed lower timeframe long & short signals.
MACRO CREDIT SPREADS
This global macro metric generates some of our most reliable swing entries, in cumulative mode.
SIGNAL STRENGTH
HOW TO NAVIGATE MIXED SIGNALS
RECOMMENDED ASSETS
The author has tested all of the above signals on the following list of high cap crypto assets. Signals generally perform well on each of these assets.
Other assets may or may not perform as well with these signals. The lower the token's FDV, the less you should expect these signals to perform.
TIMEFRAMES FOR USE
For HTF big picture, use the 4H, 8H or 12H. To zoom in for day to day use, use the 1H or 15M.
SPREAD SYMBOL TRADEOFFS
Spread symbols in tradingview have limited history. Which means less backtesting data than we prefer. Most of our metrics print 2 years of history. Some print more.
Also, our scopes are 'pinned' to a timeframe -- so you see the same print, no matter what timeframe you like to use. That's a good thing. But it has the same tradeoffs -- limited history, less backtesting data.