FusionFlow Pro – Trend & Regime🌀 FusionFlow Pro — Trend & Regime
Introduction
FusionFlow Pro is a visual trend-and-regime map designed for traders who prefer clarity over noise.
It blends multiple concepts—trend direction, volatility, volume behavior, higher-timeframe bias, and a smooth neon-gradient ribbon—into a single, readable structure.
This tool was built over many revisions and experiments, and it’s offered freely for the community. The goal is simple: provide a clean way to understand market context without overwhelming the chart.
About the Indicator
FusionFlow Pro combines several market components into one display:
• Trend Engine
Two adaptive moving averages form the core directional structure. Their separation, strength, and interaction define whether the market is leaning bullish, bearish, or neutral.
• Regime Classifier
The script can interpret either ADX or Choppiness Index to determine whether conditions favor trending behavior or range-bound phases.
• Volume & Momentum Influence
Volume expansion and short-term momentum add additional context, helping highlight when market participation is rising or cooling.
• Higher-Timeframe Bias (HTF)
The option to reference a larger timeframe gives users a broader directional backdrop while still trading on their preferred interval.
• Neon Ribbon Visualization
The slow MA forms the backbone of a multi-gradient, distance-based ribbon.
When price hugs the ribbon, the fill becomes subtle and transparent; as price moves away, the ribbon becomes more visible.
This creates an intuitive sense of distance, pressure, and trend engagement.
• HUD Panel
A compact top-right panel summarizes the current trend state, regime, volume condition, HTF bias, and most recent event.
It acts as a quick reference so the chart stays readable even at fast timeframes.
Color Interpretation
FusionFlow Pro uses color to convey structure at a glance:
Ribbon Line:
• Uptrend: green-cyan tone
• Downtrend: soft red-magenta tone
• Neutral: cool gray-blue
Ribbon Fill:
A neon gradient cycles from lime → aqua → blue → violet → soft red.
The specific color is determined by the slow MA’s position inside a 50-bar normalization window.
Opacity Behavior:
• Near the ribbon: color is more pronounced
• Approaching the candles: the fill fades smoothly
• At the extremes: almost fully transparent
This tapered fade is intentional—it helps the shape remain visible without overwhelming the candles underneath.
HUD Colors:
Each HUD value shifts based on conditions—bullish, bearish, neutral, trending, choppy, strong volume, etc.—making it easy to read with peripheral vision.
Settings & Customization
FusionFlow Pro allows users to customize its behavior without assuming any specific market or style.
Different symbols—indices, crypto, commodities, forex, individual stocks—can have very different volatility and rhythm. Because of that, many traders tweak the MA lengths, ATR multiplier, volume factor, and regime settings depending on the symbol or timeframe they prefer.
Shorter lengths generally create a more reactive environment; longer lengths smooth out noise. ATR buffer and volume requirements can be increased or reduced depending on how tightly or loosely the user wants FusionFlow Pro to respond.
Instead of prescribing “best settings,” FusionFlow Pro stays neutral and flexible.
Experimenting with adjustments is part of the workflow, and finding a comfortable configuration is encouraged.
Disclaimer
This script is published purely for chart visualization and educational use.
It does not provide financial advice, does not guarantee outcomes, and should not be used as a sole basis for trading decisions.
Users remain responsible for their own analysis and risk management.
CFD

Retail Sentiment Indicator - Multi-Asset CFD & Fear/Greed IndexRetail Sentiment Indicator - Multi-Asset CFD & Fear/Greed Index
Overview
The Retail Sentiment Indicator provides real-time sentiment data for major financial instruments including stocks, forex, commodities, and cryptocurrencies. This indicator displays retail trader positioning and market sentiment using CFD data and fear/greed indices.
Methodology and Scale Calculation
This indicator operates on a **-50 to +50 scale** with zero representing perfect market equilibrium.
Scale Interpretation:
- **Zero (0)**: Market balance - exactly 50% of investors buying, 50% selling
- **Positive values**: Majority buying pressure
- Example: If 63% of investors are buying, the indicator shows +13 (63 - 50 = +13)
- **Negative values**: Majority selling pressure
- Example: If 92% of investors are selling, the indicator shows -42 (50 - 92 = -42)
BTC Fear & Greed Index Scaling:
The original `BTC FEAR&GREED` index is natively scaled from 0-100 by its creator. In our indicator, this data has been rescaled to also fit the -50 to +50 range for consistency with other sentiment data sources.
This unified scaling approach allows for direct comparison across all instruments and data sources within the indicator.
-Important Data Source Selection-
Bitcoin (BTC) Data Sources
When viewing Bitcoin charts, the indicator offers **two different data sources**:
1. **Default Auto-Mode**: `BTCUSD Retail CFD` - Retail CFD traders sentiment data (automatically loaded).
2. **Manual Selection**: `BTC FEAR&GREED` - Fear & Greed Index from website: alternative dot me
**To access BTC Fear & Greed Index**: Input settings -> disable checkbox "Auto-load Sentiment Data" -> manually select "BTC FEAR&GREED" from the dropdown menu.
US Stock Market Data Sources
For US stocks and indices (S&P 500, NASDAQ, Dow Jones), there are **two data source options**:
1. **Default Auto-Mode**: Individual retail CFD sentiment data for each instrument
2. **Manual Selection**: `SNN FEAR&GREED` - SNN's Fear & Greed Index covering the overall US market sentiment. SNN was used as the name to avoid any potential trademark infringement.
**To access SNN Fear & Greed Index**: When viewing US market charts, disable in input settings checkbox "Auto-load Sentiment Data" and manually select "SNN FEAR&GREED" from the dropdown menu.
This distinction allows traders to choose between **instrument-specific retail sentiment** (auto-mode) or **broader market sentiment indices** (manual selection).
Features
- **Auto-Detection**: Automatically loads sentiment data based on the current chart symbol
- **Manual Selection**: Choose from 40+ supported instruments when auto-detection is unavailable
- **Multiple Data Sources**: Combines retail CFD sentiment with Fear & Greed indices
- **Visual Zones**: Clear greed/fear zones with color-coded backgrounds
- **Real-time Updates**: Live sentiment data from merged data sources
Supported Instruments
Major Indices
- S&P 500, NASDAQ, Dow Jones 30, DAX
Forex Pairs
- Major pairs: EURUSD, GBPUSD, USDJPY, USDCHF, USDCAD
- Cross pairs: EURJPY, GBPJPY, AUDUSD, NZDUSD, and 20+ others
Commodities
- Precious metals: Gold (XAUUSD), Silver (XAGUSD)
- Energy: WTI Oil
- Agricultural: Wheat, Coffee
- Industrial: Copper
Cryptocurrencies
- Bitcoin (BTC) sentiment data
- BTC & SNN Fear & Greed indices
How to Use
1. **Auto Mode** (Default): Enable "Auto-load Sentiment Data" to automatically display sentiment for the current chart symbol
2. **Manual Mode**: Disable auto-load and select from the dropdown menu for specific instruments
3. **Interpretation**:
- Values above 0 (green) indicate retail greed/bullish sentiment
- Values below 0 (red) indicate retail fear/bearish sentiment
- Fear & Greed indices use 0-100 scale (50 is neutral)
Data Sources
This indicator uses curated sentiment data from retail CFD providers and established fear/greed indices. Data is updated regularly and sourced from reputable financial data providers.
Trading Strategy & Market Philosophy
Contrarian Trading Approach
The primary purpose of this indicator is based on the fundamental market principle that **the majority of retail investors are often wrong**, and markets typically move opposite to the positions held by the majority of market participants.
Key Strategy Guidelines:
- **Contrarian Signal**: When the majority of users are positioned on one side of the market, there is statistically greater market advantage in taking positions in the opposite direction
- **Trend Exhaustion Signal**: An interesting observed phenomenon occurs when, during a long-lasting trend where the majority of investors have consistently been on the wrong side, the Sentiment indicator suddenly shows that the majority has flipped and opened positions in the direction of that long-running trend. This is often a signal of fuel exhaustion for further movement in that direction
Interpretation Examples
- High greed readings (majority bullish) → Consider bearish opportunities
- High fear readings (majority bearish) → Consider bullish opportunities
- Sudden sentiment flip during established trends → Potential trend reversal signal
Technical Notes
- Built with PineScript v6
- Dynamic symbol detection with fallback options
- Optimized for performance with minimal resource usage
- Color-coded visualization with customizable zones
Data Sources & Expansion
Acknowledgments
We extend our gratitude to **TradingView** for enabling the use of custom data feeds based on GitHub repositories, making this comprehensive sentiment analysis possible.
Data Expansion Opportunities
As the operator of this indicator, I am **open to suggestions for new data sources** that could be integrated and published. If you have ideas for additional instruments or sentiment data:
How to Submit Suggestions:
1. Send a **private message** with your proposal
2. Include: **instrument/data type**, **source**, and **brief description**
3. If technically feasible, we will work to import and publish the data
Data Infrastructure Status
Current Data Upload Process:
Please note that sentiment data uploads may occasionally experience minor interruptions. However, this should not pose significant issues as sentiment data typically changes gradually rather than rapidly.
Infrastructure Development:
We are actively working on establishing permanent cloud-based infrastructure to ensure continuous, automated data collection and upload processes. This will provide more reliable and consistent data availability in the future.
Disclaimer
This indicator is for educational and informational purposes only. Sentiment data should be used as part of a comprehensive trading strategy and not as the sole basis for trading decisions. Past performance does not guarantee future results. The contrarian approach described is a market theory and may not always produce profitable results.

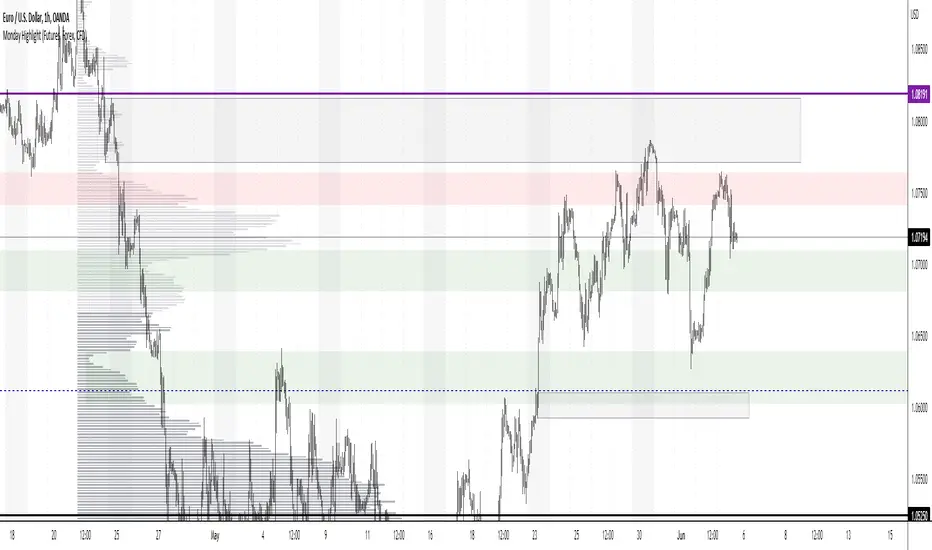
Monday Highlight (Futures, Forex, CFD)Hello Traders
This is a very simple indicator that will highlight the background vertically over every Monday for Futures, Forex and CFD markets. I use this indicator in all my technical analysis as it lets me very quickly see where each week begins without being too distracting. It can be easily customizable to whatever color, transparency level and visibility you want. Because of the way closing times are processed in different markets I could not make a single indicator to include all markets, but check out my second Monday Highlight indicator for Crypto and Stock markets.
Hope you find them useful and don't forget to add them to your "favorites" list for easy access.
CFD Ticks LevelsSimple but very effective script that finds areas of support and resistance through ticks exchange. Only works with CFDs
(You must enter in the settings the value corresponding to the CFD, example: US500 = 500, DAX30 = 30, FRANCE40 = 40 etc ...)
As usual, if you have any suggestions or bug reports don't hesitate.
Cheers

MACD Crossover with signalsMACD Crossover with signals - a simple trading indicator based on classic MACD.
It shows crossovers and plots them on chart as "Long" or "Short".
The MACD itself is not plotted in order to keep your charts cleaner.
By default, all the crossovers are displayed on the chart.
However, you can use only trend-based ones. They are filtered according to the trend (which is plotted and colored using 200 period EMA) and the "zero-line rule" of the MACD.
So if you consider using only trend-based signals, the indicator will only show Long signals on an uptrend and Short signals on a downtrend.
All signals/lines can be turned on/off and styled in the settings menu.
It can be used with all major timeframes and assets (crypto, fx, cfd, stocks, commodities etc).
Consider using it with respect to your trading style, money- and risk-management as well as other strategies and indicators.
If it was useful for you – hit the Like button and share it with your friends - it's free 😉

Buy/Sell ZonesEN:
This indicator is made to display main buy/sell zones of an asset. The core parameters are: Price, Volume and Donchian Channels.
It is more trend-based and may be suitable for swing traders or those who trade higher timeframes (1D and above).
The plotted colors display the dominance of buyers, sellers or indecision on the market at the current timeframe.
If the zone is green - consider opening Long/Buy positions.
If the zone is red - consider opening Short/Sell or scale out your position.
The white zone displays indecision between Bulls and Bears - consider not to take any trades within white zone.
RU:
Этот индикатор показывает зоны покупателя/продавца выбранного актива. Основные параметры расчета: Цена, Объем и Каналы Дончиана.
Он является индикатором трендового анализа и больше подходит для свинг-трейдеров или тех, кто торгует на старших таймфреймах (от 1Д).
Отображаемые цвета показывают доминацию продавца, покупателя или неопределенность на рынке в конкретный временной период.
Зеленая зона указывает на преобладание покупателя - возможно открытие длинных позиций/покупок .
Красная зона указывает на преобладание продавца - потенциальный момент для открытия коротких позиций/продаж или сокращения своих длинных позиций/покупок .
Белая зона указывает на неопределенность на рынке - в этой зоне лучше не предпринимать никаких торговых решений .
EN: This indicator may be used for Crypto markets
RU: Этот индикатор можно использовать для криптовалютных рынков
BITSTAMP:BTCUSD
BITSTAMP:ETHUSD
COINBASE:COMPUSD
EN: Stocks, CFD and commodities
RU: Акций, CFD и рынков сырьевых товаров
FOREXCOM:SPXUSD
NASDAQ:TSLA
NYSE:BA
NASDAQ:EBAY
FOREXCOM:XAUUSD
EN: Consider using it with respect to Your trading style, money- and risk-management as well as other indicators
RU: Используйте этот индикатор в соответствии со своим стилем торговли, риск-, мани-менеджментом и другими индикаторами.

Relativity BEARS FUTURES 50X 4H AlgorithmHi,
This system is prepared only for leveraged markets and for Futures and CFD markets.
Leveraged processing apply to cryptocurrency contracts that are also subject to.
System parameters:
Timeframe = 4H (4 Hours)
Leverage = 50X
Position Size = %1 (0.01) Each Trade
Market Direction : Short
System features :
- It targets the Risk /Reward Ratio of 1/3 and above. (Risk/Reward Ratio >= 3 )
- If a Take Profit Point has come in a successful trade but the parameter conformity has not deteriorated, system continues the trade.
- In this way, you can catch strong long trends several times a year.
But it is strict as stop-loss and avoids large declines,whipsaws whenever possible.
- The system tries to avoid unnecessary processes as much as possible.
This means less commission and less sideways market.
- Since it takes advantage of the reverse market, it is suitable not only for long and short but only for short position, ie "bears".
But this neutralizes unnecessary processes.
- Stop-Loss points and Snow-take points are shown in red and green.
-However, if there is a small amount of follow-up available at the computer, it is recommended to put stop-loss only.
Because the system revises both stop-loss and take profit points according to the conditions formed.
Doing this in the right major long trend here allows you to be in trades.
-The system takes into account the risk and only opens transactions where the value corresponding to 10 leverage ratio is greater than the risk.
This provides as much protection from risk as possible.
-Alerts added.
About Backtest :
Since this system uses leveraged market, backtest results are not healthy.
But since it targets the 1/3 Risk Reward Rate (3.00),
we must look Ratio Avg Win/Loss and it must be over 0.5 because :
This ratio means: When we reach 33% of our correct trades in all our trades, we are at breakeven.
This is 100 - 33 = 66
33/66 = 0.5 (Ratio Avg. Win / Avg Loss )
So whenever this rate is over 0.5, we make a profit.
*** The fact that this ratio is over 0.70-1.00 in terms of securing ourselves because there is a maturity in the future indicates that we are doing
successful snowball trades.(Because future contracts have loss of maturity and end dates)
And we achieve success cumulatively.
Important Note : This system is prepared only for these parameters.
These parameters are designed for Futures and CFDs.
It doesn't work in spot markets and Forex Markets.
NOTE :
The system has been prepared as a strategy to present success in a transparent manner.
Please check "Ratio Avg . Win / Avg Loss" rates in backtests.(Especially preferred financial instruments what you trade generally)
Important Note 2 -
Although the system revises the stop and take profit points in the required parameters, the most accurate place is when the signal comes.
It should be entered when the signal comes as much as possible and if this did not happen,
trade must be opened in the nearest bars after the signal comes.
If the position is not closed, renew your position in the new month by observing the maturity conditions.
Here you should pay attention to the maturity, the cost of transportation.
Because the more time to maturity, the more advantageous it will be.
Best regards.

Relativity BULLS FUTURES 50X 4H AlgorithmHi,
This system is prepared only for leveraged markets and for Futures and CFD markets.
Leveraged processing apply to cryptocurrency contracts that are also subject to.
System parameters:
Timeframe = 4H (4 Hours)
Leverage = 50X
Position Size = %1 (0.01) Each Trade
System features :
- It targets the Risk /Reward Ratio of 1/3 and above. (Risk/Reward Ratio >= 3 )
- If a Take Profit Point has come in a successful trade but the parameter conformity has not deteriorated, system continues the trade.
- In this way, you can catch strong long trends several times a year.
But it is strict as stop-loss and avoids large declines,whipsaws whenever possible.
- The system tries to avoid unnecessary processes as much as possible.
This means less commission and less sideways market.
- Since it takes advantage of the reverse market, it is suitable not only for long and short but only for long position, ie "bulls".
But this neutralizes unnecessary processes.
- Stop-Loss points and Snow-take points are shown in red and green.
-However, if there is a small amount of follow-up available at the computer, it is recommended to put stop-loss only.
Because the system revises both stop-loss and take profit points according to the conditions formed.
Doing this in the right major long trend here allows you to be in trades.
-The system takes into account the risk and only opens transactions where the value corresponding to 10 leverage ratio is greater than the risk.
This provides as much protection from risk as possible.
-Alerts added.
About Backtest :
Since this system uses leveraged market, backtest results are not healthy.
But since it targets the 1/3 Risk Reward Rate (3.00),
we must look Ratio Avg Win/Loss and it must be over 0.5 because :
This ratio means: When we reach 33% of our correct trades in all our trades, we are at breakeven.
This is 100 - 33 = 66
33/66 = 0.5
So whenever this rate is over 0.5, we make a profit.
*** The fact that this ratio is over 0.70-1.00 in terms of securing ourselves because there is a maturity in the future indicates that we are doing
successful snowball trades.(Because future contracts have loss of maturity and end dates)
And we achieve success cumulatively.
Important Note : This system is prepared only for these parameters.
These parameters are designed for Futures and CFDs.
It doesn't work in spot markets and Forex Markets.
NOTE :
The system has been prepared as a strategy to present success in a transparent manner.
Please check "Ratio Avg . Win / Avg Loss" rates in backtests.
Important Note 2 -
Although the system revises the stop and take profit points in the required parameters, the most accurate place is when the signal comes.
It should be entered when the signal comes as much as possible and if this did not happen,
trade must be opened in the nearest bars after the signal comes.
If the position is not closed, renew your position in the new month by observing the maturity conditions.
Here you should pay attention to the maturity, the cost of transportation.
Because the more time to maturity, the more advantageous it will be.
Best regards.

Relativity BEARS FUTURES 10X 1D AlgorithmHi,
This system is prepared only for leveraged markets and for Futures and CFD markets.
Leveraged processing apply to cryptocurrency contracts that are also subject to.
System parameters:
Timeframe = 1D (1 Day)
Leverage = 10x
Position Size = %1 (0.01) Each Trade
System features :
- It targets the Risk /Reward Ratio of 1/3 and above. (Risk/Reward Ratio >= 3 )
- If a Take Profit Point has come in a successful trade but the parameter conformity has not deteriorated, system continues the trade.
- In this way, you can catch strong long trends several times a year.
But it is strict as stop-loss and avoids large declines,whipsaws whenever possible.
- The system tries to avoid unnecessary processes as much as possible.
This means less commission and less sideways market.
- Since it takes advantage of the reverse market, it is suitable not only for long and short but only for short position, ie "bears".
But this neutralizes unnecessary processes.
- Stop-Loss points and Snow-take points are shown in red and green.
-However, if there is a small amount of follow-up available at the computer, it is recommended to put stop-loss only.
Because the system revises both stop-loss and take profit points according to the conditions formed.
Doing this in the right major long trend here allows you to be in trades.
-The system takes into account the risk and only opens transactions where the value corresponding to 10 leverage ratio is greater than the risk.
This provides as much protection from risk as possible.
-Alerts added.
About Backtest :
Since this system uses leveraged market, backtest results are not healthy.
But since it targets the 1/3 Risk Reward Rate (3.00),
we must look Ratio Avg Win/Loss and it must be over 0.5 because :
This ratio means: When we reach 33% of our correct trades in all our trades, we are at breakeven.
This is 100 - 33 = 66
33/66 = 0.5
So whenever this rate is over 0.5, we make a profit.
*** The fact that this ratio is over 0.70-1.00 in terms of securing ourselves because there is a maturity in the future indicates that we are doing
successful snowball trades.(Because future contracts have loss of maturity and end dates)
And we achieve success cumulatively.
Important Note : This system is prepared only for these parameters.
These parameters are designed for Futures and CFDs.
It doesn't work in spot markets and Forex Markets.
NOTE :
The system has been prepared as a strategy to present success in a transparent manner.
Please check "Ratio Avg . Win / Loss" rates in backtests.
Important Note 2 -
Although the system revises the stop and take profit points in the required parameters, the most accurate place is when the signal comes.
It should be entered when the signal comes as much as possible and if this did not happen,
trade must be opened in the nearest bars after the signal comes.
Here you should pay attention to the maturity, the cost of transportation.
Because the more time to maturity, the more advantageous it will be.
Best regards.

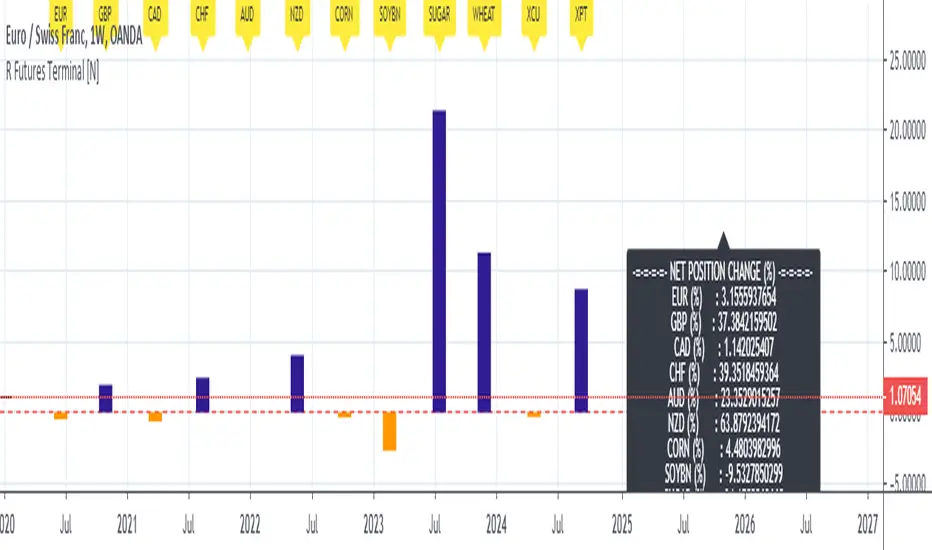
Live Mini Terminal 3 : Relative Forex & Futures Change DataThis script displays relative data changes occurring in the adjustable period and/or adaptive automatic period in the rest liquid futures.
It was inspired by the data terminals used by commercial traders.
Period selection can be set in the menu.
This script uses the adaptive period algorithm used by Autonomous LSTM and Relativity scripts.
Or you can set the period manually from the menu.
For more information about adaptive period:
This script works only for 1 day (1D) and 1 week (1W) time frames.
Since COT data is used, the most efficient time frame is 1 week (1W) .
Features
Value changes on a percentage basis (%)
Commitment of Traders position changes on a percentage basis :
Net position percentage is calculated as Short - Long and there is no inverse relationship.
Direct relationship is provided.
Due to the advantage of movement, future data were drawn instead of spot values on the required instruments.
The script provides the opportunity to comment on all major and minor Forex parities with liquid futures.
INSTRUMENTS
Euro Futures (EURUSD)
British Pound Futures (GBPUSD)
Canadian Dollar Futures (CADUSD)
Swiss Franc Futures (CHFUSD)
Australian Dollar Futures (AUDUSD)
New Zealand Dollar Futures (NZDUSD)
Corn Futures
Soybeans Futures
Sugar Futures
Wheat Futures
Copper Futures (XCU)
Platinum Futures (XPT)
Position Change InfoPanel
Position definition for the related instruments and data were taken and the calculations were made.
USAGE
The script can be used as an indicator by putting it under the chart as shown above.
It is necessary to enlarge to see clearly.
Since it is not often looked at, such use under chart is the best method for healthy interpretation.
Regards.
Syminfo.TypeHello traders
Earlier this week I discovered a new built-in variable called syminfo.type
What is it for?
This variable returns the type of the current symbol. Possible values are cfd, stock, futures, indices, forex, crypto, fund.
Cool bro but... should we care?
Well... we all should. Imagine you have a generic script and you want a different configuration whether you're trading FOREX or Crypto .
I designed a dummy example in that script that will preset the inputs according to the asset type from the chart.
Here I want 12/26/9 for forex and 20/50/50 for crypto - 30/60/90 otherwise
Quick caveat
It seems that for any crypto asset, syminfo.type returns "bitcoin". TradingView will fix it at some point but wanted to give you the heads-up regardless
Enjoy and all the BEST ^^
--
Dave

Main Trend Alert v1.1*** New Version of Main Trend Alert ***
This is an indicator that shows the main trend of and chart (crypto, forex, stock and etc). Good for day trading.
- HOW TO USE: When you are on lower timeframe, set the "Main Timeframe" to a higher timeframe from settings.
For example: Set "Main Timeframe = 1 Hour" when you are trading on 5 minute chart.
* Never trade just based on alerts of this script. Always use it with a system you like. Keep in mind that his script doesn't determine the stop loss and exit point.
* NO REPAINTS *
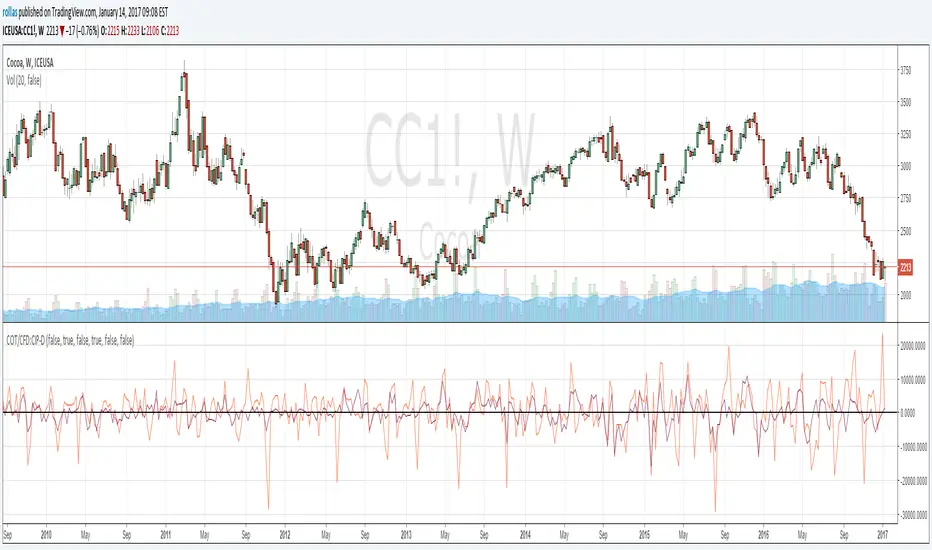
Good Luck,


COT/CFD:CIP-DThe Commitments of Traders (COT) reports provide traders positions at the close of Tuesday's trading session. Reports show how many long and how many short contracts do traders of each category hold. This version covers the change in positions (CIP) in disaggregated format for CFD's. Default is Futures only. You can include Options from the input menu. From the style menu you can turn on or off different trader groups data. As the original data is weekly, charts will only work at weekly and upper time frames.