Unentangle – Probability‑Based Trend Indicator using Chan TheoryUnentangle – Probability‑Based Trend Indicator using Chan Theory
**Overview:**
Unentangle is a custom TradingView indicator inspired by Chan Theory (Chanlun).
It automatically detects and visualizes market structures such as Bi (Trend Stroke), Xian (Line Segment), and Pivot.
By combining structural recognition with statistical analysis of historical patterns, the script provides traders with probability-based buy/sell signals.
This helps traders make more confident, data-driven decisions rather than relying solely on alerts.
Why "Unentangle"?
Market data often looks tangled and chaotic, making it hard to see clear structures and its trend.
This indicator is designed to "un-entangle" the data, revealing Chan Theory patterns and its trend probability so traders can view the market more clearly and make confident decisions.
**Key Features:**
- Automatic recognition of Chanlun structures Bi(Trend Stroke), Xian(Line Segment), Pivot
- Visual drawing of Chanlun elements directly on the chart
- Probability calculations for up and down trends based on historical Chanlun top and bottom patterns
**How It Works:**
The script analyzes price movements to identify Chanlun structures.
It then visually draws Chanlun elements, making it easier to follow Chan Theory without manual plotting.
Once structures are detected, it calculates the statistical probability of signals based on similar historical Chanlun top and bottom setups.
This allows traders to evaluate the confidence level of trades based on current price action.
**Usage:**
Apply the indicator to a clean chart.
The script will automatically display Chanlun structures and probability-based signals.
Traders can use these signals as part of their decision-making process, combining them with their own strategies and risk management rules.
On the chart, a green box indicates an uptrend and a red box indicates a downtrend.
The percentage inside the box shows how much of the current trend has progressed.
For example, “83%” in a green box means the uptrend has already advanced 83%, with only 17% potential space remaining for up trend.
**Notes:**
- This script is closed-source, but its logic is based on Chan Theory principles and statistical analysis of historical Chanlun top/bottom price patterns.
- It is intended for educational and analytical purposes, not as financial advice.
Unentangle – 基于缠论结构的趋势概率指标
**概述:**
Unentangle 是一个基于缠论的 TradingView 自定义指标。
它能够自动识别并可视化市场结构,包括笔、线段和中枢。
通过结合结构识别与历史数据的统计分析,该脚本可以生成基于概率的买卖信号,
帮助交易者在决策时更有依据,而不仅仅依赖提示。
为什么叫 “Unentangle”?
市场数据常常像一团乱麻,难以看清结构。
这个指标的目的就是“解缠”,让缠论的结构及其概率清晰呈现,
帮助交易者更直观地理解市场并做出更有依据的决策。
**功能亮点:**
- 自动识别缠论结构(笔、线段、中枢)
- 在图表上直观绘制缠论元素
- 基于历史顶底数据的趋势概率计算
- 提供信号可信度评估,辅助交易决策
**工作原理:**
脚本会分析价格走势以识别缠论结构。
识别完成后,它会自动绘制缠论元素,使得学习和应用缠论更加直观,无需手动绘制。
同时,脚本会基于历史顶底形态计算趋势的统计概率,
帮助交易者评估当前价格下的交易可信度。
**使用方法:**
将指标应用到干净的图表上。
脚本会自动显示缠论结构和基于概率的信号。
交易者可以将这些信号作为决策参考,并结合自己的策略与风险管理规则。
在图表中,绿色方框表示当前处于上升趋势,红色方框表示下降趋势。
方框中的百分比表示当前趋势的进展程度。
例如,绿色方框显示“83%”意味着当前上升趋势已经完成了 83%,仅剩 17% 的上涨空间。
**注意事项:**
- 本脚本为闭源,但逻辑基于缠论原理与历史数据的统计分析。
- 本脚本仅用于教育与分析目的,不构成任何投资建议。
Chanlun

Chanlun FBFD pen czsc Channel Chan Theory
🏆 Chan Zhong Shuo Chan FBFD Pure Segment Version Indicator - Flagship Edition
Background
A decade of craftsmanship, a significant upgrade
This Chanlun indicator has undergone nearly 10 years of meticulous refinement and continuous optimization. Since its initial design in 2015, it has been validated through actual trading. Now newly upgraded and launched on TradingView, it offers more comprehensive functions and superior performance.
It truly implements all core theories from the original Chanlun text, including a complete system of K-line inclusion, fractal recognition, pen and segment analysis, center theory, pure pen and segment division (classification of the first and second cases in the original text), divergence and reversal, providing professional and comprehensive technical analysis tools for Chanlun enthusiasts in the industry.
Chinese Translation for User Indicator Interface:
● 顶背离: Top Divergence
● 底背离: Bottom Divergence
● 顶背驰: Top Divergence Including Trend Structure
● 底背驰: Bottom Divergence Including Trend Structure
📦 Parameter Settings
● Number of K-lines to calculate: Up to 5000, which is the maximum data available even for free TradingView users
● Pen detail parameters: Old/new pens, sub-high/low pens, high/low pens, strict pens can be adjusted and selected according to the target numbers
● Segment detail parameters: Adjustable
● MA and Bollinger Bands display parameters: Check to display, uncheck to hide as needed
● Center price and pen/segment price display: Check to display, uncheck to hide as needed
● MACD parameters: Can be adjusted as needed, including fast, slow, and signal line period settings
● MA parameters: Default parameters can be manually adjusted
● Pen divergence, segment divergence, pen-segment reversal display: Check to display, uncheck to hide as needed
● Pen-segment divergence and reversal alerts: Disabled by default, can be enabled by checking. Then in TradingView's alert interface, select the indicator in conditions, set "Any alert() function call", set notification type, and create the alert to receive notifications
🔥 Integration of other commonly used indicators and reasons:
✅ Moving Averages: Since Chanlun uses MA overlay analysis, this makes it more convenient for users to analyze trends from different perspectives, so it's essential to add
✅ Bollinger Bands: Bollinger Bands channel, combined with Chanlun, can also provide more perspectives for trend analysis and improve accuracy, so it's also added
✅ MACD: This is an indispensable indicator for analyzing trend strength in Chanlun theory, so it must be integrated for convenient analysis
✅ Chanlun ZSLX pen czsc Channel Chan Theory and Chanlun FBFD pen czsc Channel Chan Theory scripts share some underlying source code and must be integrated because:
The underlying K-line inclusion, MACD divergence and reversal, K-line objects, and pen parts in the original Chanlun text are the same, but the top-level segment and trend recursion division principles, display effects, and functions are significantly different. Additionally, TradingView community has source code quantity restrictions, making it impossible to fully integrate the two versions into one. Therefore, the kxian object returned by the Start_kxian function, the bi object returned by the Start_bi function, the source code for drawing K-line centers in showKxianzsfunc, and the MACD divergence and reversal judgment code in this script will have integrated parts with the same source code.
🎯 Technical Principles
🔥 1. Comprehensive coverage of original Chanlun functions
✅ Multi-level center combination - pen centers, K-line centers, segment centers
● Chanlun K-line centers: The lowest level Chanlun centers
● Chanlun pen centers: Pen center division intervals from the original text, taking the lowest point of the overlapping part as the high point and the highest point of the overlapping part as the low point
● Chanlun segment centers: Segment center division intervals from the original text, taking the lowest point of the segment overlapping part as the high point and the highest point of the segment overlapping part as the low point
✅ Divergence and reversal warning - divergence and reversal algorithm
● Principle: Adopts MACD strength statistics from the original Chanlun text, distinguishes between divergence/reversal in pen structures and segment structures, marks specific values on the graph, differentiates MACD strength between pens and segments. This will be further upgraded with more complex statistics in the future, but currently serves as a reference for the current cycle. Specific analysis still requires multi-cycle strength analysis.
✅ Original two-level pure segmentation - exclusive algorithm
● Principle: Strictly follows segment division from the original text, distinguishing between the first and second cases, as well as special fractal inclusion processing for the second case, and segment rules. Some segments may not end at the highest or lowest points.
✅ Real-time K-line inclusion processing - intelligent recognition of inclusion relationships
● In rising K-lines, take the higher high and higher low values (take the higher among highs)
● In falling K-lines, take the lower high and lower low values (take the lower among lows)
✅ Accurate fractal marking - automatic recognition of top and bottom fractals
● By setting the old/new pen parameter to 2, the high and low points of each top and bottom fractal will be drawn
● Top fractal: Among three K-lines, the middle K-line has a higher high and a higher low than both sides
● Bottom fractal: Among three K-lines, the middle K-line has a lower low and a lower high than both sides
✅ Multi-dimensional pen and segment analysis - complete system of pens and segments
● Old pens: Traditional strict pen definition in Chanlun, consistent with the original text
● New pens: Traditional new pen definition in Chanlun, meeting the relaxed pen conditions in the original text
● Fractal pens: Pens formed by top and bottom fractals, with sensitive price response (many peers mark fractal pens of this cycle as sub-level)
● Segments: This version adopts a recursive approach, treating some pens as segments in certain places. Most places are the same as pure segmentation, but with different line-drawing principles
✅ Multi-level center combination - K-line centers, pen centers, segment centers
● K-line centers: The smallest level Chanlun centers
● Pen centers: Adopt pen center division intervals from the original text, taking the lowest point of the overlapping part as the high point and the highest point of the overlapping part as the low point
● Segment centers: Adopt segment center division intervals from the original text, taking the lowest point of the segment overlapping part as the high point and the highest point of the segment overlapping part as the low point
⚙️ Indicator Features
⚙️ 1. Diversified pen and segment algorithm engine
🎨 Three pen algorithms: "Chanlun old pen", "Chanlun new pen", "top-bottom fractal pen", with more custom pen types to be added later
🔧 Common parameter adjustments: Equal high/low points, highest/lowest point pens, sub-high/low pens, fractal interval judgment, and other refined controls
📊 Dual segment division: Original pure segmentation + large-level segmentation
🎯 Multiple personalized parameter adjustments: Many other different parameters to meet different Chanlun enthusiasts' understanding needs and trading styles
🌟 2. Multi-level intelligent combination system
📈 Synchronous calculation and display: K-line centers, pens, pen centers, segments, large-level segments, segment center linkage analysis
🏗️ Exclusive pure segmentation algorithm: Accurately identifies first and second case segment divisions
🎪 Multi-level center system: Complete coverage of three center levels
📊 Panoramic market analysis: Provides comprehensive market dynamic insights
🎨 3. Professional visual customization
🌈 Custom color schemes - perfectly matching personal chart styles
💰 Price label display - marking of key price levels for pens, segments, and centers
📐 Professional auxiliary tools - practical functions such as moving averages and Bollinger Bands
🎁 MACD - supporting indicator in the sub-chart
⏰ 4. Perfect K-line replay support
🔄 Historical data review - perfectly supports TradingView replay function
📚 Market research tool - enhances historical trend analysis capabilities
🧠 Decision-making ability enhancement - deepens market insight and judgment level
📦 Product Versions
🥇 Version 1: Professional Segmentation Edition
Suitable for: Traditional Chanlun enthusiasts pursuing classic segmentation algorithms
Core functions:
🔸 Multiple pen algorithms: Fractal pens, new pens, old pens, sub-high/low pens, highest/lowest pens
🔸 Pen and segment detail adjustments: Massive parameters supporting various pen division schemes
🔸 Complete center system: K-line centers, pen centers, segment centers
🔸 Intelligent warning system: Divergence and reversal prompts and alarm functions
🔸 Recursive large levels: Current level and large-level segmentation analysis
**📊
💡 Peer comparison: The "professional version" functions of other platforms are just basic configurations here
🎊 Experience now and start your professional Chanlun analysis journey!
Pre-sales note: The Chan Zhong Shuo Chan theory is relatively complex. The software tries its best to implement the functions described in the original text, but there may still be some flaws that cannot be handled perfectly. These will be gradually improved in the future. Customers who are concerned about this can try it for a few days first, purchase it if they find it suitable, or treat it as a test if not. We welcome everyone to feedback problems and bugs, and the shopkeeper will update, modify, and optimize in the future when available.
1. K-line inclusion from the original text
2. Pen and segment multi-level divergence and reversal prompts
3. More than three types of pens that can be adjusted
4. Including pen and segment area strength statistics + center high and low price display
5. Three-level center (K-line center, pen center, segment center) detailed analysis
6. Multiple moving averages display
7. Commonly used superimposed Bollinger Bands
8. Original text segment division rules with 2-level segments
9. Some alarm functions designed, including divergence and reversal, with more to be added in the future
10. A total of dozens of optional parameter settings
11. Free trial
🏆 缠中说禅FBFD 纯分段版指标 - 旗舰版
背景
十年匠心,重磅升级
这套缠中说禅指标历经近10年的精心打磨与持续优化,从2015年初版设计至今,已经过实战验证。现全新升级登陆TradingView,功能更加完善,性能更加卓越。
真正实现了缠论原文中的所有核心理论,包括K线包含、分型识别、笔段分析、中枢理论、 纯分笔分段(原文第一种和第二种情况分类)、背离背驰等完整体系,为缠论爱好者提供业界专业、全面的技术分析工具。
📦参数设置
- 计算K线数量:最多计算5000根,免费tradingview用户也只能这么多数据
- 笔细节参数:新旧笔、次高低点笔、最高低点笔、严格笔 可以调整可按标的数字选
● - 线段细节参数: 调整
- 显示均线和布林线参数:根据需要设置打钩就是显示,取消打钩就是隐藏
- 显示中枢价格和笔段价格:根据需要设置打钩就是显示,取消打钩就是隐藏
- macd参数:可以根据自己需要调整参数 快 慢 信号线周期设置
- 均线参数:默认参数可以自己手动调整
- 显示笔背离、段背离、笔段背驰:根据需要设置打钩就是显示,取消打钩就是隐藏
- 笔段背离背驰报警:默认关闭可以设置打钩开启,然后在tradingview的警报界面,条件里选择指标,设置:任何alert()函数调用,再设置通知类型,然后创建报警就可以收到报警
🔥整合其他常用指标和原因:
✅均线:因为缠论里是有使用均线叠加分析,这种更方便用户从不同视角分析走势,所以必须增加
✅布林线:布林线通道,结合缠论,也可以更多的视角分析走势,提高准确度,所以也增加了
✅macd:这个是缠论分析理论里必不可少的分析走势力度的指标,所以也必须整合进来方便分析
✅Chanlun ZSLX pen czsc Channel Chan Theory这个脚本和Chanlun FBFD pen czsc Channel Chan Theory这个脚本有些底层的源码是一样的必须整合原因:
因为缠论原文底层的K线包含、macd背离背驰、K线对象和笔部分都是一样的,但是顶层的线段和走势递归两种划分原理和显示效果和功能是有很大区别,并且tradingview社区的源码量有限制,导致也无法两个版本划线完全整合成一个,所以,这个脚本里的Start_kxian函数返回的kxian对象、 Start_bi函数返回的bi 对象 、showKxianzsfunc画K线中枢部分的源码、macd背离背驰判断部分代码,会有一样的整合部分源码
🎯 技术原理
🔥 1. 全方位缠论原文功能覆盖
● ✅ 多级中枢联立 - 笔中枢、K线中枢、线段中枢
○ - 缠论K线中枢:最低级别的缠论中枢
- 缠论笔中枢:原文的笔中枢划分区间,高点取重叠部分的最低点,低点取重叠部分最高点
- 缠论线段中枢:原文的线段中枢划分区间,高点取线段重叠部分的最低点,低点取线段重叠部分最高点
● ✅ 背离背驰预警 - 背离背驰算法
○ - 原理:采用缠论原文的macd力度统计,区分笔结构的背离背驰和段结构的背离背驰,并且在图形上标上具体数值,区分笔和段的macd力度,后期这个还要继续升级更复杂的统计,仅做本周期的参考,具体也是要多周期力度分析
● ✅ 原文两级别纯分段 - 独家算法
- 原理:严格按原文的线段划分,区分第一种情况和第二种情况,以及特殊的第二种情况分型包含处理,线段规则,有的地方可能不是结束在最高最低点
● ✅ 实时K线包含处理 - 智能识别包含关系
○ - 上涨K线中取高点高值、低点高值,高高取高
- 下跌K线中取高点低值、低点低值,低低取低
● ✅ 精准分型标记 - 顶底分型自动识别
○ - 通过新旧笔参数设置2,会画出每个顶底分型高低点
○ - 顶分型:三根k线中,中间K线高点高于两侧K线,低点也高于两侧
- 底分型:三根k线中,中间K线低点低于两侧K线,高点也低于两侧
● ✅ 多维笔段分析 - 笔、线段完整体系
○ - 老笔:传统缠论严格笔定义,符合原文
- 新笔:传统缠论新笔定义,符合原文宽松笔条件
- 分型笔:顶底分型就成笔,价格反应比较敏锐(同行很多人把本周期分型笔标成次级别)
○ - 线段:这个版本采用递归思路,有的地方一笔处理成段,大部分地方跟纯分段一样,但是划线原理不同
● ✅ 多级中枢联立 - K线中枢、笔中枢、线段中枢
○ - K线中枢:最小级别的缠论中枢
- 笔中枢:采用原文的笔中枢划分区间,高点取重叠部分的最低点,低点取重叠部分最高点
- 线段中枢:采用原文的线段中枢划分区间,高点取线段重叠部分的最低点,低点取线段重叠部分最高点
⚙️ 指标特点
⚙️ 1. 多样化笔段算法引擎
● 🎨 三种笔算法: "缠论旧笔"、"缠论新笔"、"顶底分型笔",以及后面会增加更多自定义类型笔选择
● 🔧 常见参数调节: 等高低点、最高低点笔、次高低笔、分型区间判断等精细化控制
● 📊 双重段划分: 原文纯分段 +大级别分段
● 🎯 超多个性化参数调整: 还有很多其他不同参数,满足不同缠友的理解需求与交易风格
🌟 2. 多级别智能联立系统
● 📈 同步计算显示: K线中枢、笔、笔中枢、线段、大级别线段、线段中枢联动分析
● 🏗️ 独家纯分段算法: 精确识别第一种、第二种情况线段划分
● 🎪 多级中枢体系: 三重中枢级别完整覆盖
● 📊 全景市场分析: 提供全面的市场动态洞察
🎨 3. 专业视觉定制
● 🌈 自定义配色方案 - 完美匹配个人图表风格
● 💰 价格标识显示 - 笔、段、中枢关键价位标注
● 📐 专业辅助工具 - 均线、布林线等实用功能
● 🎁 MACD - 配套附图指标
⏰ 4. 完美K线回放支持
● 🔄 历史数据回顾 - 完美支持TradingView回放功能
● 📚 市场研究利器 - 提升历史走势分析能力
● 🧠 决策能力增强 - 深化市场洞察与判断水平
📦 产品版本
🥇 版本一:专业分段版
适合:传统缠论爱好者,追求经典分段算法
核心功能:
● 🔸 多种笔算法: 分型笔、新笔、旧笔、次高低点笔、最高低点
● 🔸 笔段细节调整: 海量参数支持各种笔划分方案
● 🔸 完整中枢体系: K线中枢、笔中枢、段中枢
● 🔸 智能预警系统: 背离背驰提示及报警功能
● 🔸 递归大级别: 本级别、大级别分段分析
**📊
💡 同行对比: 其他平台的"专业版"功能,在我们这里只是基础配置
🎊 立即体验,开启专业缠论分析之旅!
售前说明:缠中说禅理论,相对比较复杂,软件尽量实现原文的功能,但是也难免有些瑕疵地方,无法处理到位,这边后期会陆续完善,介意的客户可以先试用几天,觉得合适再买,不合适就当测试下,欢迎大家反馈问题和bug,掌柜有空会后期更新修改和优化
1.原文的K线包含
2.笔段多级别背离背驰提示
3.超过三种笔可以调整
4.包含笔段面积力度统计+中枢高低点价格显示
5.三级别中枢(K线中枢 笔中枢 段中枢)精细分析
6.多个均线显示
7.常用叠加布林
8.原文线段划分规则,并且做2级别段
9.设计了一些报警功能,背离背驰等,后期还会陆续完善
10.总共几十个可选参数设置
11.免费试用

Chanlun ZSLX pen czsc Channel Chan Theory🏆 Chanzhongshuochan (CZSC) ZSLX Recursive Version Indicator - Flagship Edition
Background
A Decade of Craftsmanship, a Major Upgrade
This Chanzhongshuochan (Chan Theory) indicator has undergone nearly 10 years of meticulous refinement and continuous optimization. Since its initial design in 2015, it has been validated through real trading practice. Now, it makes its debut on TradingView with a brand-new upgrade, featuring more comprehensive functions and superior performance.
It truly implements all core theories from the original Chan Theory texts, including a complete system covering candlestick containment processing, fractal identification, pen-segment analysis, pivot zone theory, trading signal (buy/sell point) positioning, and divergence analysis. It serves as a professional and all-encompassing technical analysis tool for Chan Theory enthusiasts in the industry.
🎯 Chinese Translation for User Indicator Interface:
● 顶背离: Top Divergence
● 底背离: Bottom Divergence
● 顶背驰: Top Divergence Including Trend Structure
● 底背驰: Bottom Divergence Including Trend Structure
● 趋势: Trend
● 盘整: Consolidation
● 扩张: Expansion
● 大级别盘整: Higher-Timeframe Consolidation
● 一买: First Buy Signal
● 二买: Second Buy Signal
● 类二买:Quasi-Second Buy Signal
● 三买: Third Buy Signal
● 一卖: First Sell Signal
● 二卖: Second Sell Signal
● 类二卖:Quasi-Second Sell Signal
● 三卖: Third Sell Signal
📦 Parameter Settings
● Number of Candlesticks for Calculation: Up to 5,000 candlesticks. Even free TradingView users are limited to this data volume.
● Pen Detail Parameters: Adjustable options include "Old Pen", "New Pen", "Pen Based on Secondary High/Low", "Pen Based on Absolute High/Low", and "Strict Pen". Select via numerical options corresponding to each type.
● MA (Moving Average) and Bollinger Bands Display Parameters: Check the box to enable display; uncheck to hide (configure as needed).
● Pivot Zone Price & Pen-Segment Price Display: Check the box to enable display; uncheck to hide (configure as needed).
● MACD Parameters: Adjustable according to personal needs (set the periods for fast EMA, slow EMA, and signal line).
● MA Parameters: Default values can be manually adjusted.
● Pen Divergence, Segment Divergence, & Pen-Segment Divergence Display: Check the box to enable display; uncheck to hide (configure as needed).
● Pen-Segment Divergence Alert: Disabled by default. Enable by checking the box. To set up alerts:
a. Go to TradingView’s "Alerts" interface.
b. Under "Condition", select this indicator.
c. Choose "Any alert() function call".
d. Set the notification type, then create the alert to receive notifications.
🔥 Integration of Other Common Indicators & Rationale
● ✅ Moving Average (MA): Chan Theory inherently uses MA overlay for analysis. Adding MA here allows users to analyze price trends from multiple perspectives, making it an essential inclusion.
● ✅ Bollinger Bands: Combining Bollinger Bands (a price channel tool) with Chan Theory provides additional perspectives for trend analysis and improves accuracy, hence its integration.
● ✅ MACD: A 不可或缺 (indispensable) indicator for analyzing trend strength in Chan Theory. It is integrated to facilitate seamless analysis.
● ✅ Rationale for Integrating Shared Core Code between Two Scripts:
The scripts Chanlun ZSLX pen czsc Channel Chan Theory and Chanlun FBFD pen czsc Channel Chan Theory share some underlying code. Here’s why integration is necessary:
○ The core logics of the original Chan Theory — including candlestick containment processing, MACD divergence analysis, candlestick objects, and pen-related calculations — are identical in both scripts.
○ However, significant differences exist in the top-level logics for segment division, trend recursion, display effects, and functions.
○ Additionally, TradingView imposes limits on script code size, making it impossible to fully integrate the two versions’ line-drawing features into one.
○ Therefore, this indicator reuses shared code components, including:
■ The Start_kxian() function (returns candlestick objects),
■ The Start_bi() function (returns pen objects),
■ The showKxianzsfunc() function (draws candlestick-based pivot zones),
■ MACD divergence judgment code.
🎯 Technical Principles
🔥 1. Comprehensive Coverage of Original Chan Theory Functions
● ✅ Real-Time Candlestick Containment Processing – Intelligent Recognition of Containment Relationships
○ In uptrends: Select the higher high and higher low values (prioritize higher extremes).
○ In downtrends: Select the lower high and lower low values (prioritize lower extremes).
● ✅ Accurate Fractal Marking – Automatic Identification of Top/Bottom Fractals
○ When the "Old/New Pen" parameter is set to 2, the high/low points of each top/bottom fractal are plotted.
○ Top Fractal: Among three consecutive candlesticks, the middle candlestick has a higher high and a higher low than the adjacent two.
○ Bottom Fractal: Among three consecutive candlesticks, the middle candlestick has a lower low and a lower high than the adjacent two.
● ✅ Multi-Dimensional Pen-Segment Analysis – Complete System for Pens & Segments
○ Pens:
■ Old Pen: Strictly follows the traditional Chan Theory definition of "pen".
■ New Pen: Adheres to the more flexible "new pen" definition from the original Chan Theory.
■ Fractal Pen: Forms a pen directly from top/bottom fractals (responds to price changes; many peers misclassify this as a "sub-timeframe pen").
○ Segments: This version adopts a recursive logic. While some single pens are treated as segments (differing from pure segment division), most segment-drawing results align with standard methods — the core difference lies in the line-drawing logic.
● ✅ Multi-Level Pivot Zone Integration – Candlestick-, Pen-, & Segment-Based Pivot Zones
○ Candlestick Pivot Zone: The smallest-level pivot zone in Chan Theory.
○ Pen Pivot Zone: Follows the original Chan Theory for division — the zone’s high is the lowest high of overlapping pens; the zone’s low is the highest low of overlapping pens.
○ Segment Pivot Zone: Follows the original Chan Theory for division — the zone’s high is the lowest high of overlapping segments; the zone’s low is the highest low of overlapping segments.
● ✅ Intelligent Trading Signals – Accurate Positioning of Three Types of Buy/Sell Points
○ Type 1 Buy/Sell Signal
■ Principle: Based on Chan Theory’s "trend divergence" — momentum weakens when a trend structure forms.
■ Analysis Method: Identify bottom divergence (for buys) or top divergence (for sells) in the final pivot zone of a trend structure.
■ Application: For reference only. Comprehensive analysis requires combining momentum decay across multiple timeframes.
○ Type 2 Buy/Sell Signal
■ Principle: The first pullback low (for buys) or rebound high (for sells) after a Type 1 signal concludes.
■ Analysis Method: After a Type 1 structure forms, prices may occasionally break previous lows/highs.
■ Application: For reference only. Comprehensive analysis requires combining momentum decay across multiple timeframes.
○ Type 3 Buy/Sell Signal
■ Principle: A standard Type 3 buy signal occurs when prices break above the first pivot zone after a Type 1 buy, then pull back to test the zone. For ease of monitoring, all "breakout + pullback" patterns are marked as Type 3 signals here.
■ Identification Method: Beginners are advised to trade standard Type 3 structures (post-Type 1 signals), though such structures are relatively rare.
■ Application: For reference only. Comprehensive analysis requires combining momentum decay across multiple timeframes.
● ✅ Divergence Alert – Exclusive Divergence Algorithm
○ Principle: Uses MACD momentum statistics from the original Chan Theory to distinguish between "pen-structure divergence" and "segment-structure divergence". Specific values are labeled on the chart to differentiate MACD momentum for pens vs. segments. More complex statistical features will be added in future updates. For reference on the current timeframe only — multi-timeframe momentum analysis is still required.
● ✅ Trend Structure Recursion – Exclusive Trend Recursion Function
○ Principle: This is a "same-timeframe decomposition" version of trend types. Trends end as close to absolute highs/lows as possible. Some single pens may be treated as segments, resulting in more natural-looking trend structures.
⚙️ Indicator Features
🌟 1. Diverse Pen-Segment Algorithm Engines
● 🎨 Three Pen Algorithms: "Traditional Old Pen", "New Pen", "Top/Bottom Fractal Pen".
● 🔧 Extensive Parameter Adjustments: Fine-grained control over "secondary high/low pens", "fractal range judgment", etc.
● 📊 Dual Recursive Division: Recursion starting from pens + higher-timeframe recursion.
● 🎯 Customizable Parameters: Adapts to different Chan Theory interpretations and trading styles.
🌟 2. Multi-Level Intelligent Integration System
● 📈 Synchronized Calculation & Display: Linked analysis of pens, segments, and advanced recursive segments.
● 🏗️ Exclusive Recursion Algorithm: Accurate identification of advanced recursive segments.
● 🎪 Multi-Level Pivot Zone System: Full coverage of three pivot zone levels (candlestick, pen, segment).
● 📊 Holistic Market Analysis: Provides comprehensive insights into real-time market dynamics.
🎨 3. Professional Visual Customization
● 🌈 Custom Color Schemes: Perfectly matches personal chart styles.
● 💰 Price Label Display: Marks key prices for pens, segments, and pivot zones.
● 📐 Professional Auxiliary Tools: Practical features like MA and Bollinger Bands.
● 🎁 Included MACD: A supporting indicator for the sub-chart.
⏰ 4. Seamless Candlestick Replay Support
● 🔄 Historical Data Review: Fully compatible with TradingView’s replay function.
● 📚 Powerful Market Research Tool: Enhances the ability to analyze historical price trends.
● 🧠 Improved Decision-Making: Deepens market insights and judgment.
📦 Feature & Interface Showcase by Product Version
Advanced Recursive Version ⭐ Exclusive Algorithm
Suitable for: Advanced Chan Theory users seeking precise trend analysis.
Exclusive Features:
● 🚀 Rare Algorithm: A pure recursive version (most competitors only reach segment-level analysis, which is their limit).
● 🎯 Optimized High/Low Points: Trend endpoints are accurately positioned at absolute highs/lows.
● 🏆 Natural Trend Structures: More natural and rational distribution of high/low points.
● 💎 Complete Chan Theory Elements: Covers all core components of Chan Theory.
● ⚡ Rich Pen Details: Extremely detailed processing of pen structures.
User Feedback: The preferred version among many senior Chan Theory users, with excellent real-trading performance.
Screenshot:
---
🎊 Experience Now & Start Your Professional Chan Theory Analysis Journey!
Pre-Purchase Notes
Chanzhongshuochan (Chan Theory) is relatively complex. While this software strives to implement all functions from the original texts, minor imperfections or unaddressed details may exist — these will be gradually improved in future updates.
● Users with concerns are advised to test the indicator for a few days first. Purchase only if it meets your needs; otherwise, treat the test as a trial.
● Feedback on issues or bugs is welcome. The developer will update, modify, and optimize the indicator in their spare time.
Key Function Screenshots
1. Multi-Level Recursion
2. Candlestick Containment Processing
3. Area Statistics + Pivot Zone High/Low Price Display
4. Multi-Level Consolidation Divergence
5. Overlaid Practical Moving Averages
6. Fractal Pens
7. Candlestick-Based Pivot Zones
8. Dozens of Adjustable Parameters
9. Optional Alert Functions (More to be Added in Future Updates)
10. Trend Structure Markers
🏆 缠中说禅ZSLX 递归版指标 - 旗舰版
背景
十年匠心,重磅升级
这套缠中说禅指标历经近10年的精心打磨与持续优化,从2015年初版设计至今,已经过实战验证。现全新升级登陆TradingView,功能更加完善,性能更加卓越。
真正实现了缠论原文中的所有核心理论,包括K线包含、分型识别、笔段分析、中枢理论、买卖点定位、背离背驰等完整体系,为缠论爱好者提供业界专业、全面的技术分析工具。
📦参数设置
- 计算K线数量:最多计算5000根,免费tradingview用户也只能这么多数据
- 笔细节参数:新旧笔、次高低点笔、最高低点笔、严格笔 可以调整可按标的数字选
- 显示均线和布林线参数:根据需要设置打钩就是显示,取消打钩就是隐藏
- 显示中枢价格和笔段价格:根据需要设置打钩就是显示,取消打钩就是隐藏
- macd参数:可以根据自己需要调整参数 快 慢 信号线周期设置
- 均线参数:默认参数可以自己手动调整
- 显示笔背离、段背离、笔段背驰:根据需要设置打钩就是显示,取消打钩就是隐藏
- 笔段背离背驰报警:默认关闭可以设置打钩开启,然后在tradingview的警报界面,条件里选择指标,设置:任何alert()函数调用,再设置通知类型,然后创建报警就可以收到报警
🔥整合其他常用指标和原因:
✅均线:因为缠论里是有使用均线叠加分析,这种更方便用户从不同视角分析走势,所以必须增加
✅布林线:布林线通道,结合缠论,也可以更多的视角分析走势,提高准确度,所以也增加了
✅macd:这个是缠论分析理论里必不可少的分析走势力度的指标,所以也必须整合进来方便分析
✅Chanlun ZSLX pen czsc Channel Chan Theory这个脚本和Chanlun FBFD pen czsc Channel Chan Theory这个脚本有些底层的源码是一样的必须整合原因:
因为缠论原文底层的K线包含、macd背离背驰、K线对象和笔部分都是一样的,但是顶层的线段和走势递归两种划分原理和显示效果和功能是有很大区别,并且tradingview社区的源码量有限制,导致也无法两个版本划线完全整合成一个,所以,这个脚本里的Start_kxian函数返回的kxian对象、 Start_bi函数返回的bi 对象 、showKxianzsfunc画K线中枢部分的源码、macd背离背驰判断部分代码,会有一样的整合部分源码
🎯 技术原理
🔥 1. 全方位缠论原文功能覆盖
● ✅ 实时K线包含处理 - 智能识别包含关系
○ - 上涨K线中取高点高值、低点高值,高高取高
- 下跌K线中取高点低值、低点低值,低低取低
● ✅ 精准分型标记 - 顶底分型自动识别
○ - 通过新旧笔参数设置2,会画出每个顶底分型高低点
○ - 顶分型:三根k线中,中间K线高点高于两侧K线,低点也高于两侧
- 底分型:三根k线中,中间K线低点低于两侧K线,高点也低于两侧
● ✅ 多维笔段分析 - 笔、线段完整体系
○ - 老笔:传统缠论严格笔定义,符合原文
- 新笔:传统缠论新笔定义,符合原文宽松笔条件
- 分型笔:顶底分型就成笔,价格反应比较敏锐(同行很多人把本周期分型笔标成次级别)
○ - 线段:这个版本采用递归思路,有的地方一笔处理成段,大部分地方跟纯分段一样,但是划线原理不同
● ✅ 多级中枢联立 - K线中枢、笔中枢、线段中枢
○ - K线中枢:最小级别的缠论中枢
- 笔中枢:采用原文的笔中枢划分区间,高点取重叠部分的最低点,低点取重叠部分最高点
- 线段中枢:采用原文的线段中枢划分区间,高点取线段重叠部分的最低点,低点取线段重叠部分最高点
● ✅ 智能买卖点 - 三类买卖点精准定位
○ 1类买卖点
- 原理:基于缠论趋势背驰原理,形成趋势结构时候,力度减弱
- 分析方法:通过判断趋势结构中最后中枢形成底背驰
- 应用:只是参考,具体分析需要多周期力度衰减结合判断
2类买卖点
- 原理:基于1类买卖点结束后,第一个回调低点
- 分析方法:在形成一类结构后,有时候也会破低点
- 应用:只是参考,具体分析需要多周期力度衰减结合判断
3类买卖点
- 原理:标准的三买是在1买形成后,突破第一个中枢的第一个回踩,这边为了方便看盘,统一突破回踩就标三买
- 识别方法:新手建议选择一类买点后的标准三买结构操作,但是可能这种结构比较少
- 应用:只是参考,具体分析需要多周期力度衰减结合判断
● ✅ 背离背驰预警 - 独家背离背驰算法
○ - 原理:采用缠论原文的macd力度统计,区分笔结构的背离背驰和段结构的背离背驰,并且在图形上标上具体数值,区分笔和段的macd力度,后期这个还要继续升级更复杂的统计,仅做本周期的参考,具体也是要多周期力度分析
● ✅ 走势结构递归 - 独家走势递归功能
- 原理:走势类型版本,这个是同级别分解版本,走势尽量结束在最高最低点,有的地方可能一笔成段,· 走势更为自然
⚙️ 指标特点
🌟1. 多样化笔段算法引擎
○ 🎨 三大笔算法: "传统旧笔"、"新笔"、"顶底分型笔"
○ 🔧 海量参数调节: 次高低笔、分型区间判断等精细化控制
○ 📊 双重递归划分: 笔开始递归 + 大级别递归
○ 🎯 个性化参数调整: 满足不同缠友的理解需求与交易风格
🌟 2. 多级别智能联立系统
○ 📈 同步计算显示: 笔、线段、递归高级段联动分析
○ 🏗️ 独家递归算法: 高级递归段精准识别
○ 🎪 多级中枢体系: 三重中枢级别完整覆盖
○ 📊 全景市场分析: 提供全面的市场动态洞察
🎨 3. 专业视觉定制
○ 🌈 自定义配色方案 - 完美匹配个人图表风格
○ 💰 价格标识显示 - 笔、段、中枢关键价位标注
○ 📐 专业辅助工具 - 均线、布林线等实用功能
○ 🎁 附带MACD - 配套附图指标
⏰ 4. 完美K线回放支持
○ 🔄 历史数据回顾 - 完美支持TradingView回放功能
○ 📚 市场研究利器 - 提升历史走势分析能力
○ 🧠 决策能力增强 - 深化市场洞察与判断水平
📦 产品版本功能界面展示
高级递归版 ⭐ 独家算法
适合:高阶缠友,追求极致走势分析
独家特色:
● 🚀 全网罕见算法: 纯递归版本,其他家最多只能设计到分段级别就是极限了
● 🎯 优化高低点: 走势结束点精准定位最高最低点
● 🏆 自然走势结构: 高低点分布更加自然合理
● 💎 完整缠论元素: 涵盖所有缠论核心要素
● ⚡ 超丰富笔细节: 笔的处理细节极其丰富
🌟 客户反馈: 众多资深缠友首选版本,实战效果卓越
快照
---
🎊 立即体验,开启专业缠论分析之旅!
售前说明:缠中说禅理论,相对比较复杂,软件尽量实现原文的功能,但是也难免有些瑕疵地方,无法处理到位,这边后期会陆续完善,介意的客户可以先试用几天,觉得合适再买,不合适就当测试下,欢迎大家反馈问题和bug,掌柜有空会后期更新修改和优化
1.多级别递归
2.K线包含
3.面积统计+中枢高低点价格显示
4.多级别盘整背离背驰
5.叠加实用均线
6.分型笔
7。k线中枢
8.几十个可选参数调整
9,可选的一些报警功能,后期陆续完善,更丰富
10.走势结构标志

Chanlun clmacd MACDThe commonly used MACD version in China has default parameters of 12, 26, 9. It is slightly different from the built-in MACD on the official TradingView website but generally similar. This MACD version is tailored to the usage habits of domestic users and is mainly designed to be used in conjunction with my Chanlun Theory indicators.
国内常用的macd版本,默认参数12,26,9,跟tradingview官网自带的有些不同,总体差不多,适合国内用户习惯的版本的macd,主要是配套我这边缠论指标使用

Zen ProThe Trading Theory of Entanglement (缠论), developed by a Chinese trading Master in 2006, is the single most complete and comprehensive trading theory known today. Although the theory remains ‘mysterious’ among traders outside China, millions and millions of Chinese traders study this theory everyday, and the theory has been proven to provide the closest description of market behaviors for all types of market including forex, stocks, derivatives, commodity, and cryptocurrency etc., and for all time frames no matter monthly, daily, 30m, 1m or even in seconds. The theory’s philosophy is based on human greed, hatred, delusion, arrogance and doubt, which reveal the most fundamental aspects of any market. For this reason, other trading theories or techniques such as the Dow theory, the Elliott Wave theory, and the Gann theory etc. can all find their explanations as well as their limitations from the Theory of Entanglement.
Fractals, strokes, line segments and pivots are basic elements in the Theory of Entanglement, and only by accurately drawing them on a chart can one find the most accurate buying and selling points. However, manually drawing these elements on an ever-changing chart is both challenging and time consuming, and may lead to incorrect interpretation of the market trend. Our Zen Pro indicator aims to provide the most accurate drawings of strokes, line segments, and pivots, as well as to automate the drawing process for three consecutive levels such as 1m, 5m, and 30m (similar to time frames but not necessarily the same). Buying and selling points are also labeled on the chart to provide users with appropriate trading guidance.
Note that different from the ZigZag indicator or its related ones which mainly connect high and low points on a chart, our developed Zen Pro is a highly structured and well organized technical indicator, and the elements defined in the theory are constructed step by step in the following manner: a pair of top and bottom fractals form a stroke, a minimum of three consecutive strokes form a line segment, and the overlapping area of three consecutive line segments defines a pivot (indicated by the rectangular area). The pivot is the key component to help identify trend continuation or reversal, based on the so-called trend divergence. More importantly, distinguished from other similar indicators implementing the Theory of Entanglement, our Zen Pro perfectly realizes recursions of multiple levels (time frames). For example, a stroke at a higher timeframe of 30m coincides with a line segment in a lower timeframe of 5m, and also coincides with a ‘trend type’ (see below definition) at an even lower timeframe of 1m. This feature is essential for multi-timeframe trading and provides confluence of buying and selling signals at multiple timeframes.
It is important to emphasize that users are strongly recommended to apply the Theory of Entanglement to analyze the current trend (whether it will continue or reverse) based on the drawings provided by the indicator, rather than blindly follow the labels of buying and selling points as signals. For acquiring more information on our Zen Pro, getting tips on how to use it more effectively in trading, as well as learning the Theory of Entanglement from basic concepts, interested users are encouraged to contact the author directly.
Zen Pro缠论指标应用了一套严格的数学递归运算逻辑,能够自动处理k线包含关系,识别顶、底分型,实现自动画笔、笔中枢、线段、线段中枢、走势类型等完美缠论走势图中的基础组成元素。
本指标的强大之处在于其可以做到走势结构的选择性递归生长,做到完美的区间套定位,高级别笔与低级别线段、走势类型的表里关系对应,以及接近做到高级别的任意标准笔、任意标准线段在低级别均具有内部结构和有理由地成立!
本指标用强大的数学递归运算逻辑,解决了千人千缠的难点,对走势进行清晰地逻辑划分,并可自动识别本级别与次级别背驰和盘整背驰,从而准确地标注本级别1、2、3类买卖点,为使用缠论交易的用户在交易上提供了最有效的帮助,让缠论不再高不可攀!
注:自前期的Zen指标发布一年多以来,我们收到了很多用户的良好反馈,但同时也深知其所存在的不足,因此我们听取了用户的宝贵意见,经过上万次的编译、调试与修改,现已在新发布的Zen Pro指标中解决了Zen指标的所有问题,例如需要手动设置单笔成线段的比例,以及手动设置成笔条件等等。Zen Pro无需用户自行设置,实现了根据当前条件完全自动划分走势。其对于走势的分析更加精确,展现出更加清晰的走势结构,从而使用户可以更有效和准确地判断当前走势的延续与转折。目前Zen Pro已达到我们对缠论指标用于准确描述市场行为的所有预期。
另:当前市场上有很多缠论指标供用户选择,而判断一个指标是否有效的标准不仅仅是该指标能否在大周期(≥ 4小时)或某个时间阶段对走势划分准确,而更是其能否清晰展现小周期(< 30分)的走势结构,以及更加重要的一点,是否能够实现多级别联立(即递归)。目前几乎所有其他的指标均未能实现对于走势结构的递归,从而仅适合于单一周期的操作。
而我们开发的Zen Pro以实现级别递归为基础,但又不仅仅局限于严格递归(若严格递归则可达到 > 99%),而是为更好地适应走势,依据走势的多义性对线段及走势类型进行调整,从而使生成的走势图更加利于分析,大大增加了用户对未来走势判断的准确程度,也同时极大程度上增强了用户的交易信心。
Relations between fractal, stroke, line segment, pivot, and some important definitions:
• Stroke: Connecting two adjacent top and bottom fractals with at least one candlestick in between.
• Line segment: Consists of an odd number of strokes, at least three strokes are required, and the first three strokes must have overlapping portions.
• Level: Levels generally correspond to time frames of the chart, such as 1w, 1d, 4h, 30m, 5m, 1m etc. Sub-level: The above levels are respectively the sub-levels of the previous level.
• Pivot: The part of a trend type at a certain level that is overlapped by at least three consecutive sub-level trend types.
• Trend type: There are two trend types: trend and range. In trend, there are also two types: rising trend and falling trend.
• Range: At any level, a completed trend type contains only one pivot.
• Trend: At any level, a completed trend type contains at least two pivots in the same direction in sequence, which is called a trend at this level.
List of drawings on the chart (for default color settings):
1. Thick blue lines: Strokes at the current level.
2. Thick orange lines: Strokes at a higher level, also line segments at the current level.
3. White dotted lines: Line segments at a higher level, also strokes at two levels higher from the current one.
4. Blue shaded rectangles: Pivots at the sub-level in a trend or a range.
5. Green shaded rectangles: Pivots at the current level in a rising trend or a range.
6. Orange shaded rectangles: Pivots at the current level in a falling trend or a range.
List of labels on the chart (above the candle: sell signal, below the candle: buy signal)
1. Small "1" label below the candle: The lower-level 1st buying point due to the bottom trend divergence or range divergence calculated from MACD: Buy signal
2. Small "1" label above the candle: The lower-level 1st selling point due to the top trend divergence or range divergence calculated from MACD: Sell signal
3. Large "1", "2", "3" labels below the candle: The current-level 1st, 2nd, and 3rd buying points due to the bottom trend divergence or range divergence calculated from MACD: Buy signal
4. Large "1", "2", "3" labels above the candle: The current-level 1st, 2nd, and 3rd selling points due to the top trend divergence or range divergence calculated from MACD: Sell signal
ChanLun ProChanLun, also known as Entanglement Theory or "缠论", is a highly regarded technical analysis methodology that originated in China. Since its introduction in 2006, ChanLun has rapidly gained significant attention and a strong following within the Chinese trader community due to its exceptional ability to navigate complex market dynamics.
ChanLun places great emphasis on market structure, price action, momentum, and the intricate interplay between market forces. It recognizes that the market operates in cyclical patterns and aims to capture the underlying structure and rhythm of price movements. Through meticulous analysis of the intricate relationships between price and time, it provides traders with a unique perspective on market trends, potential reversals, and critical turning points.
This indicator offers a meticulous and comprehensive implementation of the ChanLun theory. It facilitates in-depth analysis and visual representation of all essential components, encompassing “Candlestick Conversion”, "Candlestick Standardization", "Fractal", "Stroke", "Segment", "Pivot", and "Buying/Selling Point".
🟠 Algorithm
🔵 Step 1: Candlestick Conversion
In ChanLun, candlestick analysis focuses less on the opening/closing prices and wicks, but rather emphasizes the price range at which the stock price has reached. As a result, the initial step in ChanLun involves converting each candlestick to contain solely the high and low prices, disregarding other elements.
🔵 Step 2: Candlestick Standardization
In the second step, the converted candlesticks are standardized to ensure strict directional consistency and eliminate the presence of inner bars or outer bars. For any adjacent two candlesticks A and B where one’s price range completely encompasses another, A and B are merged into a new candlestick C. If A is trending up from its previous candle, then C will be defined such that high(C) = max(high(A), high(B)) and low(C) = max(low(A), low(B)). If A is trending down from its previous candle, then C will be defined such that high(C) = min(high(A), high(B)) and low(C) = min(low(A), low(B)).
After completing these steps, when considering any adjacent candlesticks A and B, we can always observe either of the following conditions:
1. high(A) > high(B) and low(A) > low(B)
2. high(A) < high(B) and low(A) < low(B)
The chart below illustrates how the candlesticks would appear after this step.
🔵 Step 3: Fractals
A "Fractal" refers to the pattern formed by three consecutive "standardized" candlesticks, where the middle candlestick shows a clear higher or lower value compared to the surrounding candlesticks. When considering three adjacent candlesticks, A, B, and C, we have either of the two conditions:
1. high(B) > high(A) and high(B) > high(C) and low(B) > low(A) and low(B) > low(C)
2. high(B) < low(A) and high(B) < low(C) and low(B) < low(A) and low(B) < low(C)
For #1 above, we refer to the combination of A, B, and C as a “Top Fractal”, whereas for #2 we designate it as a “Bottom Fractal”.
The chart below illustrates all the fractals, with the red triangles indicating the Top Fractals and the green triangles indicating the Bottom Fractals.
🔵 Step 4: Strokes
A “Stroke” is a line connecting a top fractal and a bottom fractal, subject to the following rules:
1. There must be at least one "free" candlestick positioned between these fractals, meaning it is not part of either the top or bottom fractal. This guarantees that a stroke encompasses a minimum range of five candlesticks from beginning to end.
2. The top fractal must have a higher price compared to the bottom fractal.
3. The endpoint fractals should represent the highest or lowest point throughout the entire span of the stroke. (There is an option within this indicator to enable or disable this rule.)
Strokes enable traders to identify and visualize significant price swings or trends while effectively filtering out minor fluctuations.
🔵 Step 5: Segments
A "Segment" is a higher-level line that connects the starting and ending points of at least three consecutive strokes, reflecting the current trend of the market structure. It continues to extend as new strokes emerge, until there is a break in the market structure. The break occurs when an uptrend forms a lower high and lower low, or when a downtrend forms a higher high and higher low. It's worth noting that during trading ranges, it is common for strokes to exhibit a higher high and lower low or a higher low and lower high pattern (similar to inner bars and outer bars). In such cases, the strokes will be merged in a similar manner as described earlier for candlesticks, until there is a distinct break in the market structure. Segments provide a relatively stable depiction of the market trend in a higher timeframe, as opposed to strokes.
It is important to note that the algorithm used to calculate segments from strokes can be recursively applied to the generated segments again, forming higher-level segments that represent the market trend on a even larger timeframe.
🔵 Step 6: Pivots
In ChanLun, the term "Pivot" does not indicate a price reversal point. Instead, it represents a trading range where the price of a security tends to fluctuate. Within a given "Segment," the pivot is determined by the overlap of two consecutive strokes moving in the opposite direction of the segment. When two downtrend strokes A and B form a pivot P within an uptrend segment S, the upper and lower bounds of the pivot are defined as follows:
1. upper(P) = min(high(A), high(B)
2. lower(P) = max(low(A), low(B))
The pivot range is typically where consolidation occurs and where there is a high trading volume.
If a future stroke, moving in the opposite direction of the current segment, overlaps with the upper and lower bounds of the pivot, it is merged into the existing pivot and extends the pivot along the x-axis. A new pivot is formed when two consecutive strokes moving in the opposite direction of the current segment, intersect with each other without overlapping the previous pivot.
Likewise, pivots can also be recursively identified within the higher-level segments. The blue boxes below represent the "Segment Pivots" that are identified within the context of higher-level segments.
🔵 Step 7: Buying/Selling Points
There are three types of buying/selling points defined in ChanLun.
1. Type 1 Buying and Selling Points: Also known as trend reversal points. These points are where the old segments terminate and new segments are generated.
2. Type 2 Buying and Selling Points: Also known as trend continuation points. These points occur while the price is in the midst of a trend and signify the continuation of the trend. In an uptrend, the Type 2 buying point is the rebound point after the price retraces to a previous low or support level, indicating that the price may continue to rise. In a downtrend, the Type 2 selling point is the pullback point after the price rallies to a previous high or resistance level, indicating that the price may continue to decline.
3. Type 3 Buying and Selling Points: These points indicate the retests of breakouts from pivot ranges. The presence of these retest points suggests that the price has the potential to continue its upward/downward movement above/below the pivot levels.
A discerning reader may notice that these buying/selling points are lagging indicators. For example, by the time a new segment is confirmed, multiple candlesticks have already occurred since the type 1 buying/selling point of that segment.
Indeed, it is true that the buying/selling points lag behind the actual market movements. However, ChanLun addresses this issue through the utilization of multi-timeframe analysis. By examining the confirmed buying/selling points in a lower timeframe, one can gather additional confidence in determining the overall trend of the higher timeframe.
🔵 Step 8: Divergence
Another core technique in ChanLun is the application of divergence to anticipate the emergence of type 1 buying/selling points. While MACD is the most commonly employed indicator for detecting divergence, other indicators such as RSI can also be utilized for this purpose.
🟠 Summary
In essence, ChanLun is a robust approach to technical analysis that integrates the careful examination and interpretation of price charts, the application of technical indicators and quantitative tools, and a keen attention to multiple timeframes. Its objective is to identify prevailing market trends and uncover potential trading prospects. What sets ChanLun apart is its holistic methodology, which blends both qualitative and quantitative analysis to facilitate informed and successful trading decisions.
🟠 NOTE
The freely available "ChanLun | AlgoTrader" script, published by the same account, incorporates only a limited set of fundamental concepts from ChanLun.
In contrast, this script is a premium invite-only version that represents a comprehensive implementation of the complete ChanLun methodology, specifically tailored for more experienced and professional traders.
________________________________________________________________________________
该指标严格按照缠论原文实现了包括“K线标准化”、“分型”、“笔”、“线段”、“中枢”和“买卖点”在内的所有关键元素。它旨在为缠友们提供一个准确可靠的缠论实现,以便快速而精准地分析市场,从而获得更优秀的交易业绩。
该指标的主要特点如下:
1. 实时标记所有缠论元素:该指标具备实时识别和标记分型、笔、线段、中枢和买卖点的功能,提供清晰的信号和准确的趋势判断。
2. 多种笔段算法选择:提供三种不同的笔算法(“老笔”、“新笔”和“4K”)以及两种线段算法(“特征序列”和“1+1终结”),满足不同交易者个性化需求,可根据偏好和策略选择最适合的算法。
3. 三级别联立:指标同步计算并显示笔、线段和递归高级段,提供更全面的市场动态分析。
4. 自定义颜色:用户可以根据个人喜好和需求自定义指标的颜色方案,与图表风格和视觉需求完美匹配。
5. 完美实现K线回放功能:指标充分利用了K线回放功能,让交易者能够回顾和分析历史市场数据,提高对市场趋势的研究和理解,增强市场洞察力和决策能力。

ChanLun [AlgoTrader]ChanLun, also known as Entanglement Theory or "缠论," is a highly regarded technical analysis methodology that originated in China. Since its introduction in 2006, ChanLun has rapidly gained significant attention and a strong following within the Chinese trader community due to its exceptional ability to navigate complex market dynamics.
ChanLun places great emphasis on market structure, price action, momentum, and the intricate interplay between market forces. It recognizes that the market operates in cyclical patterns and aims to capture the underlying structure and rhythm of price movements. Through meticulous analysis of the intricate relationships between price and time, it provides traders with a unique perspective on market trends, potential reversals, and critical turning points.
This indicator incorporates three fundamental components of the ChanLun methodology, namely "Candle Standardization," "Fractal," and "Stroke."
- "Candle Standardization" is a process in which the candles are standardized to ensure strict directional consistency and eliminate the presence of inner bars or outer bars.
- "Fractal" refers to the formation of three consecutive "standardized" bars, with the middle bar demonstrating a definitive higher or lower value compared to the bars surrounding it.
- "Stroke" is a line connecting a top fractal and a bottom fractal, subject to the strict condition that there is a minimum of one free bar positioned between them. This requirement ensures that a stroke encompasses a minimum span of five bars from end to end. It is crucial to emphasize that the top fractal consistently maintains a higher value than the bottom fractal.
Within the ChanLun algorithm, these components are processed meticulously and sequentially. The initial step involves candle standardization, where the candles are harmonized to adhere to strict criteria. Subsequently, the identification of fractals takes place by examining the standardized candles. Finally, the stroke component is applied, establishing connections between top and bottom fractals while ensuring the defined conditions are met.
The final component, stroke, enables traders to identify and visualize significant price swings or trends while effectively filtering out minor fluctuations. This functionality proves particularly valuable in recognizing major support and resistance levels, trend reversals, and chart patterns, enhancing the overall analysis process.
__________________________________________________________________________________________________________
本指标严格按照缠论原理实现了三个核心要素,分别为“K线标准化”、“分型”和“笔”。它旨在为缠友们提供准确而可靠的市场分析工具,以在交易中获得更好的表现。
该指标的特色如下:
1. 实时标记分型和笔:本指标具备实时识别和标记分型和笔的功能,以提供清晰的信号和准确的趋势判断。
2. 多种笔算法选择:本指标提供三种不同的笔算法,包括“老笔”、“新笔”和“4K”。这样的设计能够满足不同缠友的个性化需求,让大家根据自己的偏好和策略选择最适合的算法。
3. 自定义颜色:缠友们可以根据自己的喜好和需求,自定义指标的颜色方案。这样的灵活性使得指标能够与图表风格和视觉需求完美匹配。
4. 完美实现K线回放功能:本指标充分利用了K线回放功能,使缠友们能够回顾和分析历史市场数据,从而可以更好地研究和理解市场趋势,提高对市场的洞察力和决策能力。

Chan Theory - CHANLUN | CZSCChan Theory (CHANLUN) is a technical analysis theory created by Chinese analyst CZSC, primarily applied in the analysis and decision-making of financial markets such as stocks, futures, forex, and crypto.
It is a technical analysis method based on price and time, including candlestick patterns, fractal theory, box theory, trend theory, divergence theory, multiple time frame analysis, and more.
"Chan" means zen, indicating that the fluctuations in the market are rooted in human nature, such as greed, anger, ignorance, slowness, and suspicion.
"Chan" is also the pinyin of the Chinese character '缠', which means entanglement or entwining. as the fluctuations in the stock market were intertwined like a spiral.
Concepts
Fractal - fractal is formed by three candlesticks, with the middle one being the highest for a top fractal and the lowest for a bottom fractal. In Chan Theory, the first step is to traverse all candlesticks to find all valid fractals.
Stroke - stroke is usually composed of multiple fractals, with a top fractal and a bottom fractal at both ends, and the connection between them forms a stroke with clear high and low points. This is the smallest unit of composition in Chan Theory, similar to the zigzag algorithm.
Segment - segment is generated from strokes based on the feature sequence algorithm, and a segment contains at least three strokes. a segment is a higher level of period, indicating the trend of the market at a higher level,similar to period 5M to period 30M.
Box - box is the overlapping area of multiple segments, and a box contains at least three segments. A box represents a densely traded area and a temporary consensus price range,the bull-bear battle has not produced a clear outcome, it means that the market is in a state of uncertainty and that the direction of the trend is unclear.
Trend - In Chan Theory, two or more boxes in the same direction form a trend,If the box position are gradually rising, it is defined as an uptrend,conversely, it is a downtrend.
Differences with ZigZag
Both the Chan Theory Stroke and the ZigZag are formed by connecting the high and low points to create a line. But in Chan Theory, there are strict additional requirements:
There must be at least five candlesticks between the high and low points, Otherwise it does not form a Stroke.
The high and low fractal cannot share the same candlestick,Otherwise it does not form a Stroke.
There must be at least three candlesticks between the high and low fractal,these three candlesticks must move in the same direction.
There may be complex situations where there are multiple top or bottom patterns in a single Stroke, requiring special handling to determine the connection rules for the lines.
Chan Theory is a complex theory that includes not only Stroke, but also other theories such as Box、Recursion and Divergence.
Recursion
The processing flow of the Chan Theory is similar to a ternary algorithm, It organizes chaotic candlestick into an orderly system (Fractal -> Stroke -> Segment -> Box -> Trend),levels gradually increase from small to large. We can let the levels develop continuously to obtain the appropriate level for analysis and trading, In Chan Theory, it is called "recursion". This method allows us to observe the structure of smaller levels to make trading decisions at the current level,and it allows us to combine multiple levels to determine specific trading points.
Divergence
Chan Theory uses MACD to infer the strength of the trend as momentum analysis. Chan Theory calculates the MACD area of the K-line to quantify the strength of a trend, and compares the areas of the front and back two sections of the same level box to determine whether the trend is exhausted,it is called "divergence". this is one of the important part to determine trading points.
缠论是一种技术分析理论,由中国分析师 "缠中说禅"所创立,主要应用于股票、期货、外汇、加密货币等金融市场的分析和决策。
市场哲学和禅
以股市为基础。缠者,价格重叠区间也,买卖双方阵地战之区域也;禅者,破解之道也。以阵地战为
中心,比较前后两段之力度大小,大者,留之,小者,去之。
以现实存在为基础。缠者,人性之纠结,贪嗔疾慢疑也;禅者,觉悟、超脱者也。以禅破缠,上善若
水,尤如空筒,随波而走,方入空门。
技术分析简解
以走势中枢为中间点的力度比较,尤如拔河,力大者,持有原仓位,力小者,反向操作。
把走势全部同级别分解,关注新的走势之形成,以前一走势段为中间点与再前一走势段比大小,大者,
留之,小者,去之。
进行多重赋格性的同级别分解操作,尤如行船、尤如开车,以不同档位适应不同情况
技术分析量化组件
形态学 - 笔、线段、走势中枢、走势类型
动力学 - 背驰、走势中枢、走势的能量结构
壹缠脚本是以缠论为核心理论,实现的技术分析指标系统
功能说明
基于缠论分析 实时笔段走势画线、自动中枢标识、多级别K线递归走势、实时标注缠论三类买卖点
支持配置多种笔、段、走势规则 满足交易者的笔段习惯和风格
支持TradingView警报机制 实时推送各级别买卖点通知到邮箱或Webhook
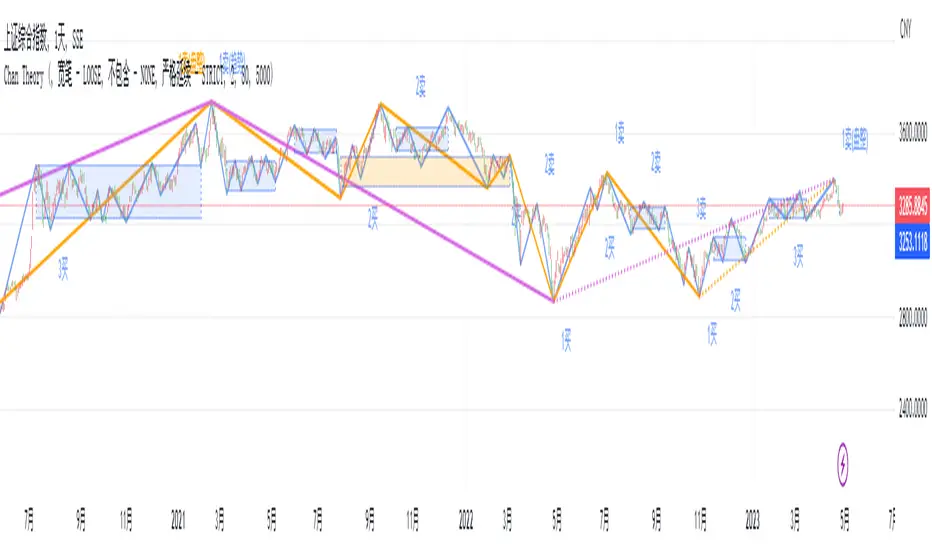
脚本图例说明
笔段走势 - 蓝线为当前级别K线构成的笔,紫色线为基于笔级别特征序列处理生成的段,紫线为基于当前级别段生成的走势
中枢级别 - 各级别画线、中枢、买卖点提示信息采用同一颜色。即笔级别中枢同为浅蓝色、段级别中枢为橙色。
MACD面积 - 笔段走势的末端数字为对应笔段的MACD面积, 蓝色为笔MACD面积,橙色为段MACD面积,紫色为走势MACD面积。
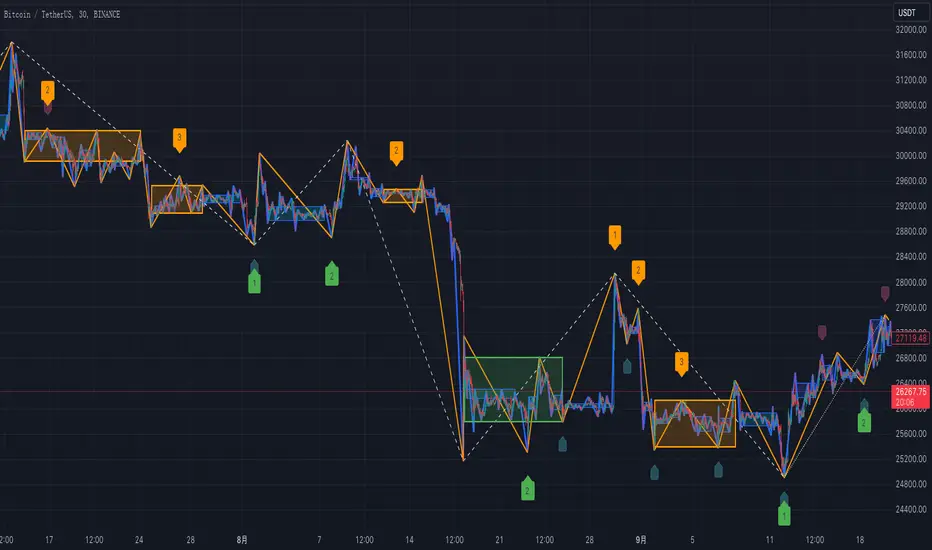
chanlunGenerate a small line according to the pattern of the K-line, where green represents long and red represents short; (we call it pen)
then according to the small line segment, a large line(we call it line) is generated according to the new high or new low rule; (we call it line)
finally, a rectangle is generated according to the overlap interval of the large line.(we call it zhongshu)

Chanlun ChannelThe black line is the current real price, and it's middle of the channel. when close price is in the channel,it means that the market is in balance.
the market need a lot of energy to leave the channel,if the price can leave the channel,the channel will become support or pressure.
缠论中枢(简化版),没有行情时价格围绕黑色线上下波动,价格离开中枢需要较大的量能,一旦成功离开中枢,这个中枢将会变成支撑(压力).
同时他可以用作横盘位置识别

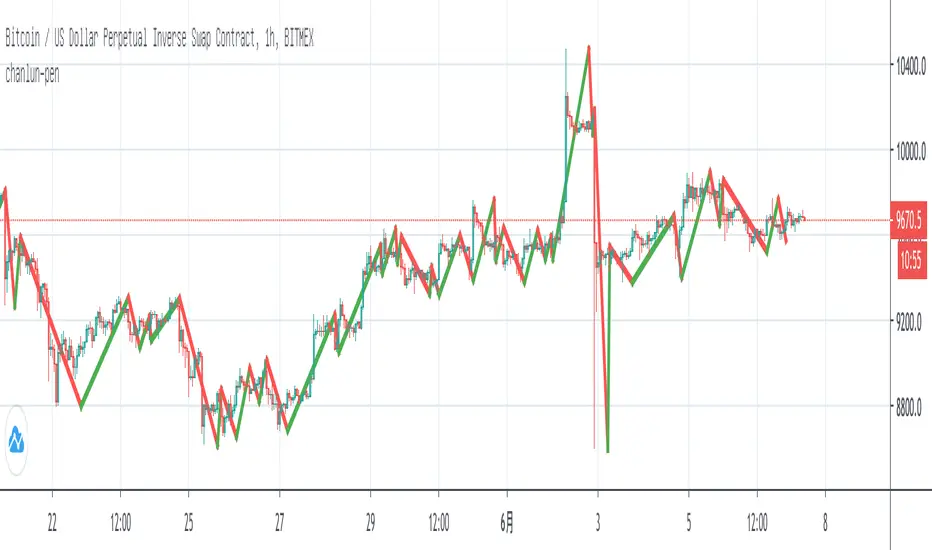
chanlun_penthe strong line call 'pen' in chanlun.it is build from the thin line,and the thin line is about kline trend. when you see the red line(strong or thin) ,that's mean down trend has been complete,at the same time,up trend has start.
缠论分笔.当你看到红色线段时,说明下跌的一笔已经完成(下跌趋势结束),同时是上涨的一笔开始(上涨趋势开始)
chanlun can Identify charpatterns,and not only that
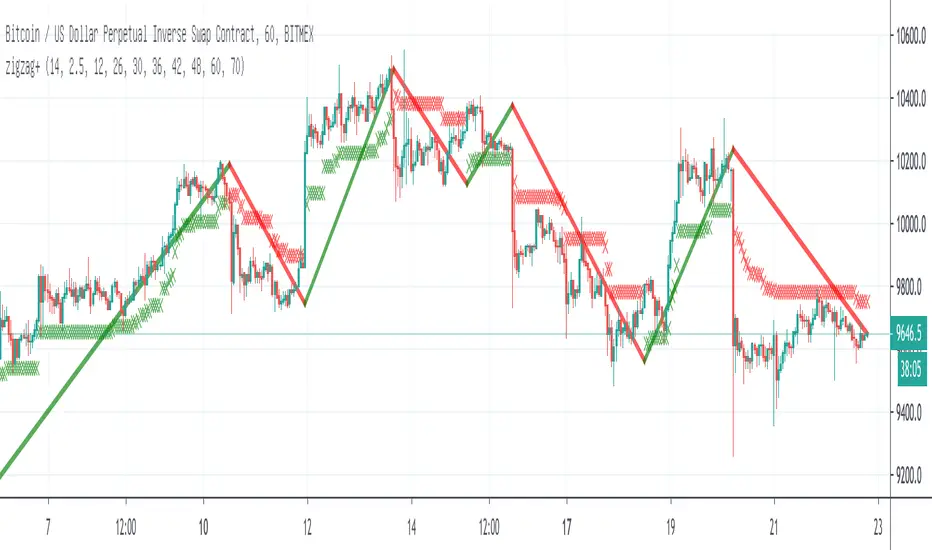
zigzag+When the k-line is at the red line, it is a short trend, and the price breaking through the red cross pressure with a large volume is reversed, and vice versa