Omega Correlation [OmegaTools]Omega Correlation (Ω CRR) is a cross-asset analytics tool designed to quantify both the strength of the relationship between two instruments and the tendency of one to move ahead of the other. It is intended for traders who work with indices, futures, FX, commodities, equities and ETFs, and who require something more robust than a simple linear correlation line.
The indicator operates in two distinct modes, selected via the “Show” parameter: Correlation and Anticipation. In Correlation mode, the script focuses on how tightly the current chart and the chosen second asset move together. In Anticipation mode, it shifts to a lead–lag perspective and estimates whether the second asset tends to behave as a leader or a follower relative to the symbol on the chart.
In both modes, the core inputs are the chart symbol and a user-selected second symbol. Internally, both assets are transformed into normalized log-returns: the script computes logarithmic returns, removes short-term mean and scales by realized volatility, then clips extreme values. This normalisation allows the tool to compare behaviour across assets with different price levels and volatility profiles.
In Correlation mode, the indicator computes a composite correlation score that typically ranges between –1 and +1. Values near +1 indicate strong and persistent positive co-movement, values near zero indicate an unstable or weak link, and values near –1 indicate a stable anti-correlation regime. The composite score is constructed from three components.
The first component is a normalized return co-movement measure. After transforming both instruments into normalized returns, the script evaluates how similar those returns are bar by bar. When the two assets consistently deliver returns of similar sign and magnitude, this component is high and positive. When they frequently diverge or move in opposite directions, it becomes negative. This captures short-term co-movement in a volatility-adjusted way.
The second component focuses on high–low swing alignment. Rather than looking only at closes, it examines the direction of changes in highs and lows for each bar. If both instruments are printing higher highs and higher lows together, or lower highs and lower lows together, the swing structure is considered aligned. Persistent alignment contributes positively to the correlation score, while repeated mismatches between the swing directions reduce it. This helps differentiate between superficial price noise and structural similarity in trend behaviour.
The third component is a classical Pearson correlation on closing prices, computed over a longer lookback. This serves as a stabilising backbone that summarises general co-movement over a broader window. By combining normalized return co-movement, swing alignment and standard price correlation with calibrated weights, the Correlation mode provides a richer view than a single linear measure, capturing both short-term dynamic interaction and longer-term structural linkage.
In Anticipation mode, Omega Correlation estimates whether the second asset tends to lead or lag the current chart. The output is again a continuous score around the range. Positive values suggest that the second asset is acting more as a leader, with its past moves bearing informative value for subsequent moves of the chart symbol. Negative values indicate that the second asset behaves more like a laggard or follower. Values near zero suggest that no stable lead–lag structure can be identified.
The anticipation score is built from four elements inspired by quantitative lead–lag and price discovery analysis. The first element is a residual lead correlation, conceptually similar to Granger-style logic. The script first measures how much of the chart symbol’s normalized returns can be explained by its own lagged values. It then removes that component and studies the correlation between the residuals and lagged returns of the second asset. If the second asset’s past returns consistently explain what the chart symbol does beyond its own autoregressive behaviour, this residual correlation becomes significantly positive.
The second element is an asymmetric lead–lag structure measure. It compares the strength of relationships in both directions across multiple lags: the correlation of the current symbol with lagged versions of the second asset (candidate leader) versus the correlation of lagged values of the current symbol with the present values of the second asset. If the forward direction (second asset leading the first) is systematically stronger than the backward direction, the structure is skewed toward genuine leadership of the second asset.
The third element is a relative price discovery score, constructed by building a dynamic hedge ratio between the two prices and defining a spread. The indicator looks at how changes in each asset contribute to correcting deviations in this spread over time. When the chart symbol tends to do most of the adjustment while the second asset remains relatively stable, it suggests that the second asset is taking a greater role in determining the equilibrium price and the chart symbol is adjusting to it. The difference in adjustment intensity between the two instruments is summarised into a single score.
The fourth element is a breakout follow-through causality component. The script scans for breakout events on the second asset, where its price breaks out of a recent high or low range while the chart symbol has not yet done so. It then evaluates whether the chart symbol subsequently confirms the breakout direction, remains neutral, or moves against it. Events where the second asset breaks and the first asset later follows in the same direction add positive contribution, while failed or contrarian follow-through reduce this component. The contribution is also lightly modulated by the strength of the breakout, via the underlying normalized return.
The four elements of the Anticipation mode are combined into a single leading correlation score, providing a compact and interpretable measure of whether the second asset currently behaves as an effective early signal for the symbol you trade.
To aid interpretation, Omega Correlation builds dynamic bands around the active series (correlation or anticipation). It estimates a long-term central tendency and a typical deviation around it, plotting upper and lower bands that highlight unusually high or low values relative to recent history. These bands can be used to distinguish routine fluctuations from genuinely extreme regimes.
The script also computes percentile-based levels for the correlation series and uses them to track two special price levels on the main chart: lost correlation levels and gained correlation levels. When the correlation drops below an upper percentile threshold, the current price is stored as a lost correlation level and plotted as a horizontal line. When the correlation rises above a lower percentile threshold, the current price is stored as a gained correlation level. These levels mark zones where a historically strong relationship between the two markets broke down or re-emerged, and can be used to frame divergence, convergence and spread opportunities.
An information panel summarises, in real time, whether the second asset is behaving more as a leading, lagging or independent instrument according to the anticipation score, and suggests whether the current environment is more conducive to de-alignment, re-alignment or classic spread behaviour based on the correlation regime. This makes the tool directly interpretable even for users who are not familiar with all the underlying statistical details.
Typical applications for Omega Correlation include intermarket analysis (for example, index vs index, commodity vs related equity sector, FX vs bonds), dynamic hedge sizing, regime detection for algorithmic strategies, and the identification of lead–lag structures where a macro driver or benchmark can be monitored as an early signal for the instrument actually traded. The indicator can be applied across intraday and higher timeframes, with the understanding that the strength and nature of relationships will differ across horizons.
Omega Correlation is designed as an advanced analytical framework, not as a standalone trading system. Correlation and lead–lag relationships are statistical in nature and can change abruptly, especially around macro events, regime shifts or liquidity shocks. A positive anticipation reading does not guarantee that the second asset will always move first, and a high correlation regime can break without warning. All outputs of this tool should be combined with independent analysis, sound risk management and, when appropriate, backtesting or forward testing on the user’s specific instruments and timeframes.
The intention behind Omega Correlation is to bring techniques inspired by quantitative research, such as normalized return analysis, residual correlation, asymmetric lead–lag structure, price discovery logic and breakout event studies, into an accessible TradingView indicator. It is intended for traders who want a structured, professional way to understand how markets interact and to incorporate that information into their discretionary or systematic decision-making processes.
Cointegration

Pair Cointegration & Static Beta Analyzer (v6)Pair Cointegration & Static Beta Analyzer (v6)
This indicator evaluates whether two instruments exhibit statistical properties consistent with cointegration and tradable mean reversion.
It uses long-term beta estimation, spread standardization, AR(1) dynamics, drift stability, tail distribution analysis, and a multi-factor scoring model.
1. Static Beta and Spread Construction
A long-horizon static beta is estimated using covariance and variance of log-returns.
This beta does not update on every bar and is used throughout the entire model.
Beta = Cov(r1, r2) / Var(r2)
Spread = PriceA - Beta * PriceB
This “frozen” beta provides structural stability and avoids rolling noise in spread construction.
2. Correlation Check
Log-price correlation ensures the instruments move together over time.
Correlation ≥ 0.85 is required before deeper cointegration diagnostics are considered meaningful.
3. Z-Score Normalization and Distribution Behavior
The spread is standardized:
Z = (Spread - MA(Spread)) / Std(Spread)
The following statistical properties are examined:
Z-Mean: Should be close to zero in a stationary process
Z-Variance: Measures amplitude of deviations
Tail Probability: Frequency of |Z| being larger than a threshold (e.g. 2)
These metrics reveal whether the spread behaves like a mean-reverting equilibrium.
4. Mean Drift Stability
A rolling mean of the spread is examined.
If the rolling mean drifts excessively, the spread may not represent a stable long-term equilibrium.
A normalized drift ratio is used:
Mean Drift Ratio = Range( RollingMean(Spread) ) / Std(Spread)
Low drift indicates stable long-run equilibrium behavior.
5. AR(1) Dynamics and Half-Life
An AR(1) model approximates mean reversion:
Spread(t) = Phi * Spread(t-1) + error
Mean reversion requires:
0 < Phi < 1
Half-life of reversion:
Half-life = -ln(2) / ln(Phi)
Valid half-life for 10-minute bars typically falls between 3 and 80 bars.
6. Composite Scoring Model (0–100)
A multi-factor weighted scoring system is applied:
Component Score
Correlation 0–20
Z-Mean 0–15
Z-Variance 0–10
Tail Probability 0–10
Mean Drift 0–15
AR(1) Phi 0–15
Half-Life 0–15
Score interpretation:
70–100: Strong Cointegration Quality
40–70: Moderate
0–40: Weak
A pair is classified as cointegrated when:
Total Score ≥ Threshold (default = 70)
7. Main Cointegration Panel
Displays:
Static beta
Log-price correlation
Z-Mean, Z-Variance, Tail Probability
Drift Ratio
AR(1) Phi and Half-life
Composite score
Overall cointegration assessment
8. Beta Hedge Position Sizing (Average-Price Based)
To provide a more stable hedge ratio, hedge sizing is computed using average prices, not instantaneous prices:
AvgPriceA = SMA(PriceA, N)
AvgPriceB = SMA(PriceB, N)
Required B per 1 A = Beta * (AvgPriceA / AvgPriceB)
Using averaged prices results in a smoother, more reliable hedge ratio, reducing noise from bar-to-bar volatility.
The panel displays:
Required B security for 1 A security (average)
This represents the beta-neutral quantity of B required to hedge one unit of A.
Overview of Classical Stationarity & Cointegration Methods
The principal econometric tools commonly used in assessing stationarity and cointegration include:
Augmented Dickey–Fuller (ADF) Test
Phillips–Perron (PP) Test
KPSS Test
Engle–Granger Cointegration Test
Phillips–Ouliaris Cointegration Test
Johansen Cointegration Test
Since these procedures rely on regression residuals, matrix operations, and distribution-based critical values that are not supported in TradingView Pine Script, a practical multi-criteria scoring approach is employed instead. This framework leverages metrics that are fully computable in Pine and offers an operational proxy for evaluating cointegration-like behavior under platform constraints.
References
Engle & Granger (1987), Co-integration and Error Correction
Poterba & Summers (1988), Mean Reversion in Stock Prices
Vidyamurthy (2004), Pairs Trading
Explanation structured with assistance from OpenAI’s ChatGPT
Regards.

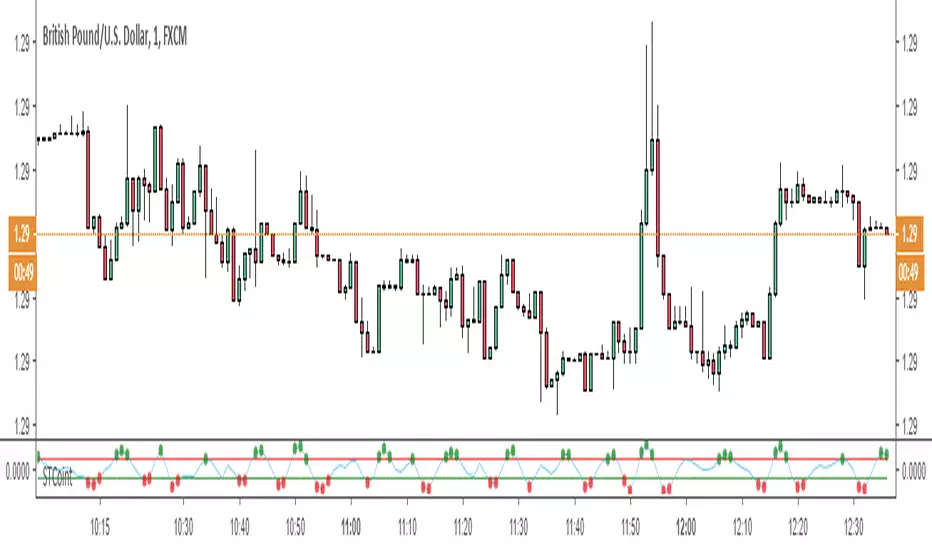
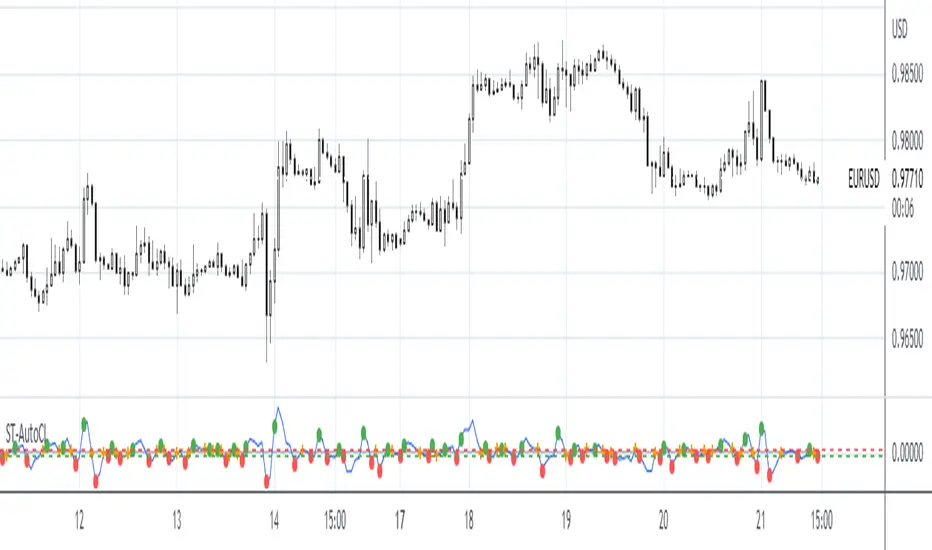
Statistical Pairs Trading IndicatorZ-Score Stat Trading — Statistical Pairs Trading Indicator
📊🔗
---
What is it?
Z-Score Stat Trading is a powerful indicator for statistical pairs trading and quantitative analysis of two correlated assets.
It calculates the Z-Score of the log-price spread between any two symbols you choose, providing both long-term and short-term Z-Score signals.
You’ll also see real-time correlation, volatility, spread, and the number of long/short signals in a handy on-chart table!
---
How to Use 🛠️
1. Add the indicator to your chart.
2. Select two assets (symbols) to analyze in the settings.
3. Watch the Z-Score plots (blue and orange lines) and threshold levels (+2, -2 by default).
4. Check the info table for:
- Correlation
- Volatility
- Spread
- Number of long (NL) and short (NS) signals in the last 1000 bars
5. Set up alerts for signal generation or threshold crossings if you want to be notified automatically.
---
Trading Strategy 💡
- This indicator is designed for statistical arbitrage (mean reversion) strategies.
- Long Signal (🟢):
When both Z-Scores drop below the negative threshold (e.g., -2), a long signal is generated.
→ Buy Symbol A, Sell Symbol B, expecting the spread to revert to the mean.
- Short Signal (🔴):
When both Z-Scores rise above the positive threshold (e.g., +2), a short signal is generated.
→ Sell Symbol A, Buy Symbol B, again expecting mean reversion.
- The info table helps you quickly assess the frequency of signals and the current statistical relationship between your chosen assets.
---
Best Practices & Warnings 🚦
- Avoid high leverage! Pairs trading can be risky, especially during periods of divergence. Use conservative position sizing.
- Check for cointegration: Before using this indicator, make sure both assets are cointegrated or have a strong historical relationship. This increases the reliability of mean reversion signals.
- Check correlation: Only use asset pairs with a high correlation (preferably 0.8–0.9 or higher) for best results. The correlation value is shown in the info table.
- Scale in and out gradually: When entering or exiting positions, consider doing so in parts rather than all at once. This helps manage slippage and risk, especially in volatile markets.
---
⚠️ Note on Performance:
This indicator may work a bit slowly, especially on large timeframes or long chart histories, because the calculation of NL and NS (number of long/short signals) is computationally intensive.
---
Disclaimer ⚠️
This script is provided for educational and informational purposes only .
It is not financial advice or a recommendation to buy or sell any asset.
Use at your own risk. The author assumes no responsibility for any trading decisions or losses.
Cointegration Heatmap & Spread Table [EdgeTerminal]The Cointegration Heatmap is a powerful visual and quantitative tool designed to uncover deep, statistically meaningful relationships between assets.
Unlike traditional indicators that react to price movement, this tool analyzes the underlying statistical relationship between two time series and tracks when they diverge from their long-term equilibrium — offering actionable signals for mean-reversion trades .
What Is Cointegration?
Most traders are familiar with correlation, which measures how two assets move together in the short term. But correlation is shallow — it doesn’t imply a stable or predictable relationship over time.
Cointegration, however, is a deeper statistical concept: Two assets are cointegrated if a linear combination of their prices or returns is stationary , even if the individual series themselves are non-stationary.
Cointegration is a foundational concept in time series analysis, widely used by hedge funds, proprietary trading firms, and quantitative researchers. This indicator brings that institutional-grade concept into an easy-to-use and fully visual TradingView indicator.
This tool helps answer key questions like:
“Which stocks tend to move in sync over the long term?”
“When are two assets diverging beyond statistical norms?”
“Is now the right time to short one and long the other?”
Using a combination of regression analysis, residual modeling, and Z-score evaluation, this indicator surfaces opportunities where price relationships are stretched and likely to snap back — making it ideal for building low-risk, high-probability trade setups.
In simple terms:
Cointegrated assets drift apart temporarily, but always come back together over time. This behavior is the foundation of successful pairs trading.
How the Indicator Works
Cointegration Heatmap indicator works across any market supported on TradingView — from stocks and ETFs to cryptocurrencies and forex pairs.
You enter your list of symbols, choose a timeframe, and the indicator updates every bar with live cointegration scores, spread signals, and trade-ready insights.
Indicator Settings:
Symbol list: a customizable list of symbols separated by commas
Returns timeframe: time frame selection for return sampling (Weekly or Monthly)
Max periods: max periods to limit the data to a certain time and to control indicator performance
This indicator accomplishes three major goals in one streamlined package:
Identifies stable long-term relationships (cointegration) between assets, using a heatmap visualization.
Tracks the spread — the difference between actual prices and the predicted linear relationship — between each pair.
Generates trade signals based on Z-score deviations from the mean spread, helping traders know when a pair is statistically overextended and likely to mean revert.
The math:
Returns are calculated using spread tickers to ensure alignment in time and adjust for dividends, splits, and other inconsistencies.
For each unique pair of symbols, we perform a linear regression
Yt=α+βXt+ε
Then we compute the residuals (errors from the regression):
Spreadt=Yt−(α+βXt)
Calculate the standard deviation of the spread over a moving window (default: 100 samples) and finally, define the Cointegration Score:
S=1/Standard Deviation of Residuals
This means, the lower the deviation, the tighter the relationship, so higher scores indicate stronger cointegration.
Always remember that cointegration can break down so monitor the asset over time and over multiple different timeframes before making a decision.
How to use the indicator
The heatmap table:
The indicator displays 2 very important tables, one in the middle and one on the right side. After entering your symbols, the first table to pay attention to is the middle heatmap table.
Any assets with a cointegration value of 25% is something to pay attention to and have a strong and stable relationship. Anything below is weak and not tradable.
Additionally, the 40% level is another important line to cross. Assets that have a cointegration score of over 40% will most likely have an extremely strong relationship.
Think about it this way, the higher the percentage, the tighter and more statistically reliable the relationship is.
The spread table:
After finding a good asset pair using heatmap, locate the same pair in the spread table (right side).
Here’s what you’ll see on the table:
Spread: Current difference between the two symbols based on the regression fit
Mean: Historical average of that spread
Z-score: How far current spread is from the mean in standard deviations
Signal: Trade suggestion: Short, Long, or Neutral
Since you’re expecting mean reversion, the idea is that the spread will return to the average. You want to take a trade when the z-score is either over +2 or below -2 and exit when z-score returns to near 0.
You will usually see the trade suggestion on the spread chart but you can make your own decision based on your risk level.
Keep in mind that the Z-score for each pair refers to how off the first asset is from the mean compared to the second one, so for example if you see STOCKA vs STOCKB with a Z-score of -1.55, we are regressing STOCKB (Y) on STOCKA (X).
In this case, STOCKB is the quoted asset and STOCKA is the base asset.
In this case, this means that STOCKB is much lower than expected relative to STOCKA, so the trade would be a long position on stock B and short position on stock A.

Cointegration Buy and Sell Signals [EdgeTerminal]The Cointegration Buy And Sell Signals is a sophisticated technical analysis tool to spot high-probability market turning points — before they fully develop on price charts.
Most reversal indicators rely on raw price action, visual patterns, or basic and common indicator logic — which often suffer in noisy or trending markets. In most cases, they lag behind the actual change in trend and provide useless and late signals.
This indicator is rooted in advanced concepts from statistical arbitrage, mean reversion theory, and quantitative finance, and it packages these ideas in a user-friendly visual format that works on any timeframe and asset class.
It does this by analyzing how the short-term and long-term EMAs behave relative to each other — and uses statistical filters like Z-score, correlation, volatility normalization, and stationarity tests to issue highly selective Buy and Sell signals.
This tool provides statistical confirmation of trend exhaustion, allowing you to trade mean-reverting setups. It fades overextended moves and uses signal stacking to reduce false entries. The entire indicator is based on a very interesting mathematically grounded model which I will get into down below.
Here’s how the indicator works at a high level:
EMAs as Anchors: It starts with two Exponential Moving Averages (EMAs) — one short-term and one long-term — to track market direction.
Statistical Spread (Regression Residuals): It performs a rolling linear regression between the short and long EMA. Instead of using the raw difference (short - long), it calculates the regression residual, which better models their natural relationship.
Normalize the Spread: The spread is divided by historical price volatility (ATR) to make it scale-invariant. This ensures the indicator works on low-priced stocks, high-priced indices, and crypto alike.
Z-Score: It computes a Z-score of the normalized spread to measure how “extreme” the current deviation is from its historical average.
Dynamic Thresholds: Unlike most tools that use fixed thresholds (like Z = ±2), this one calculates dynamic thresholds using historical percentiles (e.g., top 10% and bottom 10%) so that it adapts to the asset's current behavior to reduce false signals based on market’s extreme volatility at a certain time.
Z-Score Momentum: It tracks the direction of the Z-score — if Z is extreme but still moving away from zero, it's too early. It waits for reversion to start (Z momentum flips).
Correlation Check: Uses a rolling Pearson correlation to confirm the two EMAs are still statistically related. If they diverge (low correlation), no signal is shown.
Stationarity Filter (ADF-like): Uses the volatility of the regression residual to determine if the spread is stationary (mean-reverting) — a key concept in cointegration and statistical arbitrage. It’s not possible to build an exact ADF filter in Pine Script so we used the next best thing.
Signal Control: Prevents noisy charts and overtrading by ensuring no back-to-back buy or sell signals. Each signal must alternate and respect a cooldown period so you won’t be overwhelmed and won’t get a messy chart.
Important Notes to Remember:
The whole idea behind this indicator is to try to use some stat arb models to detect shifting patterns faster than they appear on common indicators, so in some cases, some assumptions are made based on historic values.
This means that in some cases, the indicator can “jump” into the conclusion too quickly. Although we try to eliminate this by using stationary filters, correlation checks, and Z-score momentum detection, there is still a chance some signals that are generated can be too early, in the stock market, that's the same as being incorrect. So make sure to use this with other indicators to confirm the movement.
How To Use The Indicator:
You can use the indicator as a standalone reversal system, as a filter for overbought and oversold setups, in combination with other trend indicators and as a part of a signal stack with other common indicators for divergence spotting and fade trades.
The indicator produces simple buy and sell signals when all criteria is met. Based on our own testing, we recommend treating these signals as standalone and independent from each other . Meaning that if you take position after a buy signal, don’t wait for a sell signal to appear to exit the trade and vice versa.
This is why we recommend using this indicator with other advanced or even simple indicators as an early confirmation tool.
The Display Table:
The floating diagnostic table in the top-right corner of the chart is a key part of this indicator. It's a live statistical dashboard that helps you understand why a signal is (or isn’t) being triggered, and whether the market conditions are lining up for a potential reversal.
1. Z-Score
What it shows: The current Z-score value of the volatility-normalized spread between the short EMA and the regression line of the long EMA.
Why it matters: Z-score tells you how statistically extreme the current relationship is. A Z-score of:
0 = perfectly average
> +2 = very overbought
< -2 = very oversold
How to use it: Look for Z-score reaching extreme highs or lows (beyond dynamic thresholds). Watch for it to start reversing direction, especially when paired with green table rows (see below)
2. Z-Score Momentum
What it shows: The rate of change (ROC) of the Z-score:
Zmomentum=Zt − Zt − 1
Why it matters: This tells you if the Z-score is still stretching out (e.g., getting more overbought/oversold), or reverting back toward the mean.
How to use it: A positive Z-momentum after a very low Z-score = potential bullish reversal A negative Z-momentum after a very high Z-score = potential bearish reversal. Avoid signals when momentum is still pushing deeper into extremes
3. Correlation
What it shows: The rolling Pearson correlation coefficient between the short EMA and long EMA.
Why it matters: High correlation (closer to +1) means the EMAs are still statistically connected — a key requirement for cointegration or mean reversion to be valid.
How to use it: Look for correlation > 0.7 for reliable signals. If correlation drops below 0.5, ignore the Z-score — the EMAs aren’t moving together anymore
4. Stationary
What it shows: A simplified "Yes" or "No" answer to the question:
“Is the spread statistically stable (stationary) and mean-reverting right now?”
Why it matters: Mean reversion strategies only work when the spread is stationary — that is, when the distance between EMAs behaves like a rubber band, not a drifting cloud.
How to use it: A "Yes" means the indicator sees a consistent, stable spread — good for trading. "No" means the market is too volatile, disjointed, or chaotic for reliable mean reversion. Wait for this to flip to "Yes" before trusting signals
5. Last Signal
What it shows: The last signal issued by the system — either "Buy", "Sell", or "None"
Why it matters: Helps avoid confusion and repeated entries. Signals only alternate — you won’t get another Buy until a Sell happens, and vice versa.
How to use it: If the last signal was a "Buy", and you’re watching for a Sell, don’t act on more bullish signals. Great for systems where you only want one position open at a time
6. Bars Since Signal
What it shows: How many bars (candles) have passed since the last Buy or Sell signal.
Why it matters: Gives you context for how long the current condition has persisted
How to use it: If it says 1 or 2, a signal just happened — avoid jumping in late. If it’s been 10+ bars, a new opportunity might be brewing soon. You can use this to time exits if you want to fade a recent signal manually
Indicator Settings:
Short EMA: Sets the short-term EMA period. The smaller the number, the more reactive and more signals you get.
Long EMA: Sets the slow EMA period. The larger this number is, the smoother baseline, and more reliable trend bases are generated.
Z-Score Lookback: The period or bars used for mean & std deviation of spread between short and long EMAs. Larger values result in smoother signals with fewer false positives.
Volatility Window: This value normalizes the spread by historical volatility. This allows you to prevent scale distortion, showing you a cleaner and better chart.
Correlation Lookback: How many periods or how far back to test correlation between slow and long EMAs. This filters out false positives when EMAs lose alignment.
Hurst Lookback: The multiplier to approximate stationarity. Lower leads to more sensitivity to regime change, higher produces a more stricter filtering.
Z Threshold Percentile: This value sets how extreme Z-score must be to trigger a signal. For example, 90 equals only top/bottom 10% of extremes, 80 = more frequent.
Min Bars Between Signals: This hard stop prevents back-to-back signals. The idea is to avoid over-trading or whipsaws in volatile markets even when Hurst lookback and volatility window values are not enough to filter signals.
Some More Recommendations:
We recommend trying different EMA pairs (10/50, 21/100, 5/20) for different asset behaviors. You can set percentile to 85 or 80 if you want more frequent but looser signals. You can also use the Z-score reversion monitor for powerful confirmation.

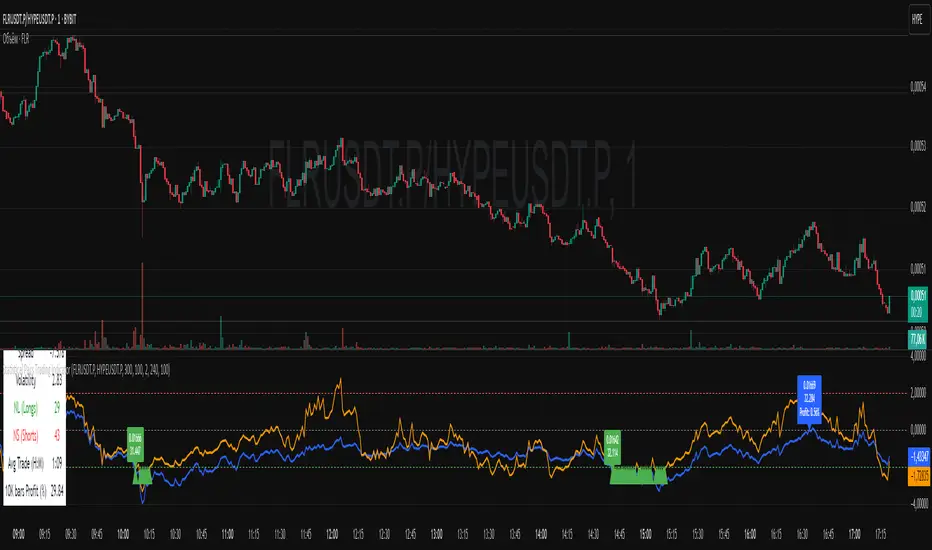
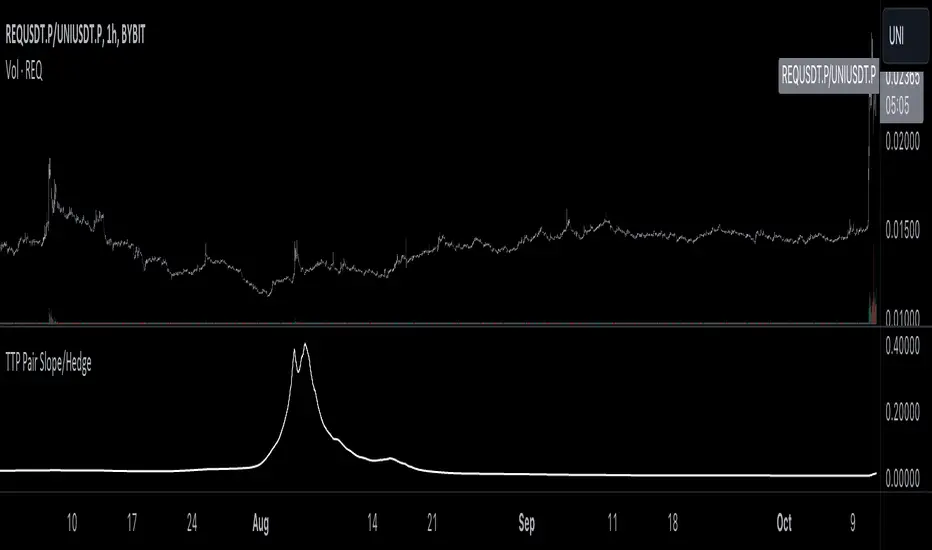
TTP Pair Slope/HedgePair slope/hedge uses linear regression to calculate the hedge ratio (slope) between the two assets within a period.
It allows you to specify a "from" and a "to" candle.
Example:
"A regression from 1000 candles back in time and ignore the last 100 candles. This would result in making a regression of 900 candles in total."
The formula used to perform the regression with the assts X and Y is:
Hedge =
mean( (X-mean(X))^2 )
——————————————————
mean( (X-mean(X)) * (Y-mean(Y)) )
You can later use the hedge in a chart of X - Hedge * Y
(Confirm with 1 / hedge )
If the plot is stationary the period tested should look like stationary.
If you cross an imaginary horizontal line across all the values in the period used it should look like a flat channel with values crossing above and below the line.
The purpose of this indicator is to help finding the linear regression test used for conintegration analysis. Conintegration assets is one of the requirements to consider assets for pair and hedge trading.
SpreadTrade - Auto-Cointegration (ps5)Decsription: Auto-Cointegration-Based Pair Trading Strategy (revised version)
To review, there are three popular styles of Pair trading: distance-based pair trading, correlation-based pair trading and cointegration-based pair trading. Typically, they require preliminary statistical estimation of the viability of the corresponding strategy.
Basically a pair trade strategy boils down to shorting the outperforming instrument and going long on the underperforming instrument whenever the temporary correlation weakens which means one instrument is going up and another is going down. Apart from the typical cointegration strategy which employs two cointegrated instruments, this script uses just one instrument, in base timeframe and in lagged timeframe, actually making it an auto-cointegration, or better still, an auto-correlation strategy.
Notice that each moving average function may require different Threshold settings.The orange cross symbol indicates the exit points. To filter out the signals use higher values for the LongWindow and the Threshold parameters. Also pay attention that in some cases with some moving averages the color of the signals has to be inverted.
SpreadTrade - CointegrationThe Cointegration strategy is to short the outperforming instrument and go long on the underperforming instrument
whenever the temporary correlation weakens which means one instrument going up and another going down.
Here, instead of two different instruments two timeframes of the same instrument are used, lower and higher.