Volumetric Tensegrity🧮 Volumetric Tensegrity unifies two of the Leading Indicator suite's critical engines — ZVOL ( volume anomaly detection ) and OBVX ( directional conviction ). Originally designed as a structural economizer for traders navigating strict indicator limits (e.g. < 10 slots per chart), it was forced to evolve beyond that constraint simply to fulfill it, albeit with a difference. The fatal flaw of traditional fusion, where two metrics are blended mathematically, is that they lose scale integrity (i.e. meaning). VTense encodes optical tensegrity to scale the amplitude of the ZVOL histogram and the slope of the OBVX spread independently, so that expansion and direction may coexist without either dominating the frame.
🧬 Tensegrity , by definition, is an intelligent design principle where elements in compression are suspended within a network of continuous tension, forming a stable, self-supporting structure . Originally conceived in esoteric biomorphology (c.f. Da Vinci, Snelson, Casteneda), tensegrity balances force through opposition, not rigidity. Applied to financial markets, Volumetric Tensegrity captures this same principle: price compresses, volume expands, conviction builds or fades — yet structure holds through the interplay. The result is not a prediction engine, but a pressure field — one that visualizes where structure might bend, break, or rebound based on how volume breathes.
🗜️ Rather than layering multiple indicators and consuming precious chart space, VTense frees up room for complementary overlays like momentum mapping, liquidity tiers, or volatility phase detection — making it ideal for modular traders operating in tight technical real estate.
🧠 Core Logic - VTense separates and preserves two essential structural forces:
• ZVOL Histogram : A Z-score-based expansion map that measures current volume deviation from its historical average. It reveals buildup zones, dormant stretches, and breakout pressure — regardless of price behavior.
• OBVX Spread : A directional conviction curve that tracks the difference between On-Balance Volume and its volume-weighted fast trend. It shows whether the crowd is leaning in (accumulation/distribution) or backing off.
🔊 ZVOL controls the amplitude of the histogram, while OBVX controls the curvature and slope of the spread. Without sacrificing breathing behavior or analytical depth, VTense provides a compact yet dynamic lens to track both expansion pressure and directional bias within a single footprint.
🌊 Volumetric Tensegrity forecasts breakout readiness, trend fatigue, and compression zones by measuring the volatility within volume . Unlike traditional tools that track volatility of price, this indicator reveals when effort becomes unstable — signaling inflection points before price reacts. Designed to decode rhythm shifts at the volume level, it operates as a pre-ignition scanner that thrives on low-timeframe charts (15m and under) while scaling effectively to 1H for validation.
🪖 From Generals to Scouts
👀 When used jointly, ZVOL + OBVX act as the general : deep-field analysts confirming stress, commitment, or exhaustion. VTense , by contrast, functions as a scout — capturing subtle buildup and alignment before structure fully reveals itself. The indicator aims to be a literal vanguard, establishing a position that can be confirmed or flexibly abandoned when the higher authority arrives to evaluate.
🥂 Use the ZVOL + OBVX pair when :
• You need independent axis control and manual dissection
• You’re building long-form confluence setups
• You have more indicator slots than you need
🔎 Use VTense when :
• You need compact clarity across multiple instruments
• You’re prioritizing confluence _detection_ over granular separation
• You’re building efficient multi-layered systems under slot constraints
🏗️ Structural Behavior and Interpretation
🫁 Z VOL Respiration Histogram : Structural Effort vs Baseline
🔵 Compression Coil – volume volatility is low and stable; the market is coiling
🟢 Steady Rhythm – volume is healthy but unremarkable; balanced participation
🟡 Passive/Absorbed Effort – expansion failing to manifest; watch for reversal
🟠 Clean Expansion – actionable volatility rise backed by structure
🔴 Volatile Blowout – chaos, climax; likely end-phase or fakeout
⚖️ ZVOL Respiration measures how hard the crowd is pressing — not just that volume is rising, but how statistically abnormal the surge is. Because it is rescaled proportionally to OBVX, the amplitude of the histogram reflects structural urgency without overwhelming the visual field.
🖐️ OBVX Spread : Real-Time Directional Conviction Behind Price Moves
🔑 The curvature of the spread reveals not just directional bias but crowd temp o: sharp slopes = urgent transitions; gradual slopes = building structural shifts. Curvature is key: sharp OBVX slope = urgency; gentle arcs = controlled drift or indecision.
• Green Rising : Accumulation — upward pressure from real buyers
• Red Falling : Distribution — sell pressure, downward slope
• Flat Curves : Transitional → uncertainty, microstructure digestion
🎭 Synchronized vs Divergent Behavior
⏱️ Synchronized (high-confluence) : often precedes structural breakouts, with internal conviction clearly visible before price resolves.
• ZVOL expands (yellow/orange/red) and OBVX climbs steeply green = strong bullish pressure
• ZVOL expands while OBVX steepens red = growing sell-side intent
🪤 Divergent (conflict tension) : flags potential traps, fakeouts, and liquidity sweeps.
• ZVOL expands sharply, but OBVX flattens or opposes → reactive expansion without crowd commitment
⛔️ Latent Drift + Structural Holding Patterns : tensegrity in action — the market holds tension without directional release.
• ZVOL compresses (blue) + OBVX meanders near zero → structure is resting, building up energy
• After prolonged drift, expect violent asymmetry when balance finally breaks
📚 Phase Interpretation: Dynamic Structural Read
• 1️⃣ Quiet Coil : Histogram flat, OBVX flat → no urgency
• 2️⃣ Initial Pulse : Yellow bars, OBVX slope builds → actionable tension
• 3️⃣ Structural Breath : Synchronized expansion and slope → directional commitment
• 4️⃣ Disagreement : Spike in ZVOL, flattening OBVX → exhaustion risk or false signal
💡 Suggested Use
• Run on 15m charts for breakout anticipation and 1H for validation
• Pair with ZVOL + OBVX to confirm crowd conviction behind the tension phase
• Use as a rhythm filter for the suite's trend indicators (e.g., RDI , SUPeR TReND 2.718 , et. al.)
• Ideal during low-volume regimes to detect pressure buildup before triggers
🧏🏻 Volumetric Tensegrity doesn’t signal. It breathes , and listens to pressure shifts before they speak in price. As a scout, it lets you see structural posture before signals align — helping you front-run resolution with clarity, not prediction.
Commitment

ICT Commitment of Traders° by toodegreesDescription:
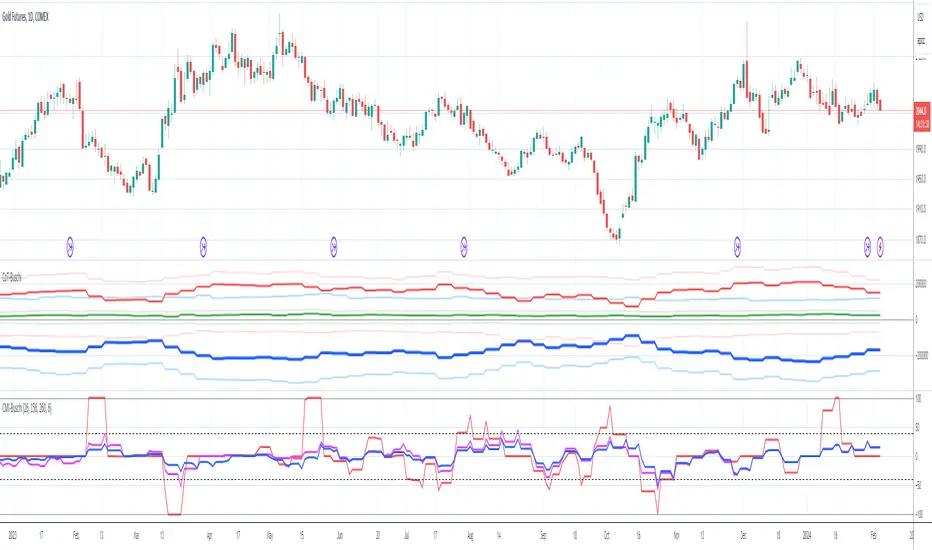
The Commitment of Traders (COT) is a valuable raw data report released weekly by the Commodity Futures Trading Commission (CFTC). This report offers insights into the current long and short positions of three key market entities:
Commercial Traders ( usually represented in red )
Large Traders ( typically depicted in green )
Small Speculator Traders ( commonly shown in blue )
The concept of utilizing the COT data as a strategic trading tool was first introduced by Larry Williams, who emphasized the importance of monitoring Commercial Speculators – large corporate producers or consumers of commodities.
The Inner Circle Trader (ICT) prompts us to delve deeper into this data. While we can easily determine their Net Position (also referred to as the Main Program) by subtracting Commercial Short Positions from the Commercial Long Positions, this calculation doesn't reveal their ongoing Hedge Program .
Merely following the Main Program won't provide a trading edge. Aligning with the Hedge Program can be an invaluable weapon in your trading arsenal.
The Commercial Speculators' Hedge Program can be unveiled by examining the highest and lowest reading of their Net Position over a chosen time period and setting a new "zero line" between these extremes. This process generates a novel "COT Graph" providing a detailed understanding of the Commercial Speculators' current market activity.
When the Hedge Program, Seasonality, and Open Interest are cross-referenced with Institutional Orderflow, a trader can construct a very clear medium-to-long-term market narrative.
Features:
Access COT Data for the Commercial Speculators via Tradingview's reliable data source
Automate calculations and display the 3-month, 6-month, 12-month, 2-year, and 3-year Hedge Program
Define your own Custom Time Range for the Hedge Program
Display the Main Program and all Hedge Programs in an easy-to-understand table format
Additionally, by following the included instructions, you can augment your table with COT data from multiple markets. This extra information can help monitor correlated markets and develop a more robust market narrative:

CoT Absolute Percent-Buschi
English
I'm often asked to provide an alternate view on the CoT data. For example, the indicator "Commercial index" is an oscillator from 0 to 100, but oftentimes it can be helpful to look at the absolute position. So, here the absolute position of certain parts of the CoT report are given, alongside with the percentage of a given time frame to put them in place.
The inputs are:
CoT Part Number ('1' for Commercials Short, '2' for Commercials Long, '3' for Commercials Netto, '4' for Large Speculators Short, '5' for Large Speculators Long, '6' for Large Speculators Netto, '7' for Small Speculators Short, '8' for Small Speculators Long, '9' for Small Speculators Netto, '10' for Open Interest)
Review Period (in years, just used for the percentage)
Percent Line 1, 2, 3, 4 (just to provide some lines which can be altered as required)
DISCLAIMER: I'm aware of Pine Script's ability to provide options as inputs (which would be much nicer for the CoT Parts). Alas, it is only available since version 3, and I noticed that for some reason the CoT data is not correctly adjusted to last Tuesday when using higher versions than 1. If someone knows a solution, please contact me.
Deutsch
Ich werde oft gefragt, eine alternative Sicht auf die CoT-Daten zu geben. Der Indikator "Commercial Index" zum Beispiel schwankt als Oszillator zwischen 0 und 100, aber oft kann der Blick auf die absolute Positionierung hilfreich sein. Also werden hier die Absolutpositionen verschiedene CoT-Bestandteile wiedergegeben, zusammen mit einer prozentualen Einteilung über eine vorgegebene Zeitspanne, um sie einordnen zu können.
The Eingaben lauten:
CoT Part Number ('1' Commercials Short, '2' Commercials Long, '3' Commercials Netto, '4' Large Speculators Short, '5' Large Speculators Long, '6' Large Speculators Netto, '7' Snall Speculators Short, '8' Small Speculators Long, '9' Small Speculators Netto, '10' Open Interest)
Review Period (Zeitintervall in Jahren, um die Prozentlinien zeichnen zu können)
Percent Line 1, 2, 3, 4 (um die Prozentlinien zur Verfügung zu stellen, die dann beliebig geändert werden können)
DISCLAIMER: Ich weiß über die Möglichkeit Bescheid, ab Pine Script Version 3 Optionen als Eingaben benutzen zu können (was deutlich angenehmer für die CoT-Bestandteile wäre). Leider habe ich gemerkt, dass die CoT-Daten bei Versionen über 1 leider nicht korrekt auf letzten Dienstag adjustiert werden, keine Ahnung warum. Falls jemand eine Lösung kennt, bitte kontaktieren.

Commercial Movement Index-BuschiEnglish
Inspired by the book "The Commitments of Traders Bible" by Stephen Briese, this indicator is a follow-up of my already published "Commercial Index-Buschi".
Here, the Commercial Index isn't shown in values from 0 to 100, but in how far the value changed from a given timeframe (default Movement Reference: 6 weeks). Therefore it ranges from 100 (bullish move from the Commercials during the last weeks) to -100 (bearish move).
Deutsch
Inspiriert durch das Buch "The Commitments of Traders Bible" by Stephen Briese, ist dieser Indikator eine Weiterentwicklung meines bereits veröffentlichten Skriptes "Commercial Index-Buschi".
Hier wird der Commercial Index nicht in Werten von 0 bis 100 angezeigt, sondern in wieweit er sich innerhalb eines vorgegebenen Zeitfensters (Standard: Movement Reference: 6 Wochen) verändert hat. Daher schwankt er zwischen 100 (bullishe Bewegung der Commercials innerhalb der letzten Wochen) und -100 (bearishe Bewegung).
Range Force Impulse The "Range Force Impulse" indicator combines 4 useful indicators into one, freeing up chart real-estate and giving the trader insight into trend health, bull/bear commitment, range and volatility all at a glance.
The indicator consists of the following:
Direction - True Range and Average True Range columns shown above and below 0 depending on direction of the period's price
-- TR (gray) shows the current period's trading volatility
-- ATR (Impulse colors, see below) shows an EMA of TR over a specified length
-- Can be used to determine stops and targets (Example: Stop loss at prev close - ATR, Target at 2x ATR)
Index - Alexander Elder's EMA of (change(close) * volume), shows crosses above 0 (green) and below 0 (red), and intermediate signals
-- Shows bull vs. bear interest/commitment/dominance
-- Elder recommends EMA length of 2 for daily chart buy/sell signals, and 13 for weekly chart bull/bear dominance & trend direction signals
-- Intermediate signals are shown above 0 when falling (salmon), or below 0 when rising (pale yellow)
System - Range columns are colored using Alexander Elder's censorship system (green: do not short, red: do not long, blue: is up to you)
-- Shows overall trend health (Macd histogram and EMA up/down changes)

Open Interest Rank-BuschiEnglish:
One part of the "Commitment of Traders-Report" is the Open Interest which is shown in this indicator (source: Quandl database).
Unlike my also published indicator "Open Interest-Buschi", the values here are not absolute but in a ranking system from 0 to 100 with individual time frames-
The following futures are included:
30-year Bonds (ZB)
10-year Notes ( ZN )
Soybeans (ZS)
Soybean Meal (ZM)
Soybean Oil (ZL)
Corn ( ZC )
Soft Red Winter Wheat (ZW)
Hard Red Winter Wheat (KE)
Lean Hogs (HE)
Live Cattle ( LE )
Gold ( GC )
Silver (SI)
Copper (HG)
Crude Oil ( CL )
Heating Oil (HO)
RBOB Gasoline ( RB )
Natural Gas ( NG )
Australian Dollar (A6)
British Pound (B6)
Canadian Dollar (D6)
Euro (E6)
Japanese Yen (J6)
Swiss Franc (S6)
Sugar ( SB )
Coffee (KC)
Cocoa ( CC )
Cotton ( CT )
S&P 500 E-Mini (ES)
Russell 2000 E-Mini (RTY)
Dow Jones Industrial Mini (YM)
Nasdaq 100 E-Mini (NQ)
Platin (PL)
Palladium (PA)
Aluminium (AUP)
Steel ( HRC )
Ethanol (AEZ)
Brent Crude Oil (J26)
Rice (ZR)
Oat (ZO)
Milk (DL)
Orange Juice (JO)
Lumber (LS)
Feeder Cattle (GF)
S&P 500 ( SP )
Dow Jones Industrial Average Index (DJIA)
New Zealand Dollar (N6)
Deutsch:
Ein Bestandteil des "Commitment of Traders-Report" ist das Open Interest, das in diesem Indikator dargestellt wird (Quelle: Quandl Datenbank).
Anders als in meinem ebenfalls veröffentlichten Indikator "Open Interest-Buschi" werden hier nicht die absoluten Werte dargestellt, sondern in einem Ranking-System von 0 bis 100 mit individuellen Zeitrahmen.
Folgende Futures sind enthalten:
30-jährige US-Staatsanleihen (ZB)
10-jährige US-Staatsanleihen ( ZN )
Sojabohnen(ZS)
Sojabohnen-Mehl (ZM)
Sojabohnen-Öl (ZL)
Mais( ZC )
Soft Red Winter-Weizen (ZW)
Hard Red Winter-Weizen (KE)
Magerschweine (HE)
Lebendrinder ( LE )
Gold ( GC )
Silber (SI)
Kupfer(HG)
Rohöl ( CL )
Heizöl (HO)
Benzin ( RB )
Erdgas ( NG )
Australischer Dollar (A6)
Britisches Pfund (B6)
Kanadischer Dollar (D6)
Euro (E6)
Japanischer Yen (J6)
Schweizer Franken (S6)
Zucker ( SB )
Kaffee (KC)
Kakao ( CC )
Baumwolle ( CT )
S&P 500 E-Mini (ES)
Russell 2000 E-Mini (RTY)
Dow Jones Industrial Mini (YM)
Nasdaq 100 E-Mini (NQ)
Platin (PL)
Palladium (PA)
Aluminium (AUP)
Stahl ( HRC )
Ethanol (AEZ)
Brent Rohöl (J26)
Reis (ZR)
Hafer (ZO)
Milch (DL)
Orangensaft (JO)
Holz (LS)
Mastrinder (GF)
S&P 500 ( SP )
Dow Jones Industrial Average Index (DJIA)
Neuseeland Dollar (N6)

Open Interest-Buschi
English:
One part of the "Commitment of Traders-Report" is the Open Interest which is shown in this indicator (source: Quandl database).
The following futures are included:
30-year Bonds (ZB)
10-year Notes (ZN)
Soybeans (ZS)
Soybean Meal (ZM)
Soybean Oil (ZL)
Corn (ZC)
Soft Red Winter Wheat (ZW)
Hard Red Winter Wheat(KE)
Lean Hogs (HE)
Live Cattle (LE)
Gold (GC)
Silver (SI)
Copper (HG)
Crude Oil (CL)
Heating Oil (HO)
RBOB Gasoline (RB)
Natural Gas (NG)
Australian Dollar (A6)
British Pound (B6)
Canadian Dollar (D6)
Euro (E6)
Japanese Yen (J6)
Swiss Franc (S6)
Sugar (SB)
Coffee (KC)
Cocoa (CC)
Cotton (CT)
S&P 500 E-Mini (ES)
Russell 2000 E-Mini (RTY)
Dow Jones Industrial Mini (YM)
Nasdaq 100 E-Mini (NQ)
Platin (PL)
Palladium (PA)
Aluminium (AUP)
Steel (HRC)
Ethanol (AEZ)
Brent Crude Oil (J26)
Rice (ZR)
Oat (ZO)
Milk (DL)
Orange Juice (JO)
Lumber (LS)
Feeder Cattle (GF)
S&P 500 (SP)
Dow Jones Industrial Average Index (DJIA)
New Zealand Dollar (N6)
Deutsch:
Ein Bestandteil des "Commitment of Traders-Report" ist das Open Interest, das in diesem Indikator dargestellt wird (Quelle: Quandl Datenbank).
Folgende Futures sind enthalten:
30-jährige US-Staatsanleihen (ZB)
10-jährige US-Staatsanleihen (ZN)
Sojabohnen(ZS)
Sojabohnen-Mehl (ZM)
Sojabohnen-Öl (ZL)
Mais(ZC)
Soft Red Winter-Weizen (ZW)
Hard Red Winter-Weizen (KE)
Magerschweine (HE)
Lebendrinder (LE)
Gold (GC)
Silber (SI)
Kupfer(HG)
Rohöl (CL)
Heizöl (HO)
Benzin (RB)
Erdgas (NG)
Australischer Dollar (A6)
Britisches Pfund (B6)
Kanadischer Dollar (D6)
Euro (E6)
Japanischer Yen (J6)
Schweizer Franken (S6)
Zucker (SB)
Kaffee (KC)
Kakao (CC)
Baumwolle (CT)
S&P 500 E-Mini (ES)
Russell 2000 E-Mini (RTY)
Dow Jones Industrial Mini (YM)
Nasdaq 100 E-Mini (NQ)
Platin (PL)
Palladium (PA)
Aluminium (AUP)
Stahl (HRC)
Ethanol (AEZ)
Brent Rohöl (J26)
Reis (ZR)
Hafer (ZO)
Milch (DL)
Orangensaft (JO)
Holz (LS)
Mastrinder (GF)
S&P 500 (SP)
Dow Jones Industrial Average Index (DJIA)
Neuseeland Dollar (N6)

Commercial / Open Interest-Buschi
English:
Another view the Commitment of Traders (CoT) data
Since the Commercials are often a good indicator for future market movements, I tampered a little bit with their positioning (long or short) in relation to the open interest to visualize some kind of "commercial buying (long) or selling (short) power". It's definitely nothing more than work in progress, but I decided to publish it anyway. Critical comments are mostly welcome.
Deutsch:
Ein weiterer Blick auf die Commitment of Traders (CoT) Daten
Da die Commercials häufig ein guter Indikator für zukünftige Marktbewegungen sind, habe ich ein wenig mit ihrer Positionierung (long oder short) im Verhältnis zum Open Interest herumgebastelt, um eine Art von "kommerzieller Kauf- (long) oder Verkaufs-Kraft" abzubilden. Es ist momentan noch im absoluten Teststadium, aber ich habe mich dazu entschlossen, es trotzdem zu veröffentlichen. Kritische Anmerkungen sind sehr willkommen.

Commercial Index-BuschiThis simple script takes a closer look at the Commercial part of the CoT (Commitment of Traders) Data. It shows thier percentual level on given time frames (default: during the last 6 months, 3 years and 5 years).
This relative perspective is often more useful than the absolute contract numbers.

