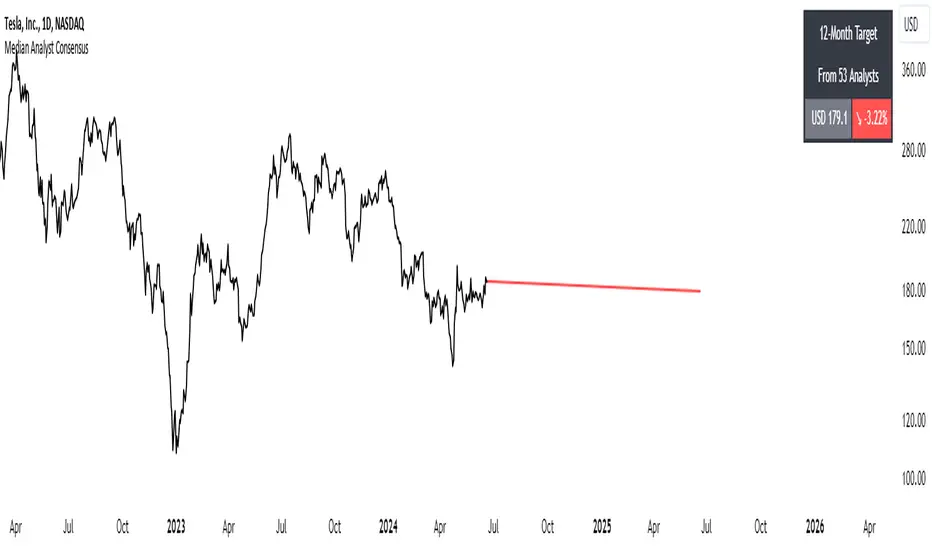
Median Analyst ConsensusThe Median Analyst Consensus Indicator provides an unbiased, easy-to-interpret view of market sentiment by leveraging TradingView's comprehensive financial data library. This tool displays the median 12-month price target and the percentage difference from the current price directly on your charts.
Key Features
1. Accurate Market Sentiment: By consolidating analyst ratings and price targets from multiple reputable sources like Bloomberg, Refinitiv (formerly Thomson Reuters), S&P Capital IQ, and Morningstar, this indicator displays the median analyst consensus. Using the median ensures outlier ratings don't skew the overall sentiment, providing a more robust representation.
2. Simplicity at a Glance: View the median 12-month price target and percentage difference from the current price directly on your chart. No need to juggle multiple reports - key insights are surfaced within your normal trading workflow.
3. Data-Driven Transparency: If no analyst data is available for a particular asset, the indicator will not display, ensuring you only see reliable information. The number of contributing analysts is also shown for context.
Why the Median?
The median is favored over the mean to minimize the impact of outlier ratings that could distort the consensus view. By taking the middle value across all analyst projections, the median provides a more stable, outlier-resistant measure of market sentiment.
Powered by TradingView Data
This indicator taps into TradingView's financial data library, which aggregates analyst ratings, estimates, and recommendations from leading institutional data providers. TradingView sources this data from firms like FactSet, Bloomberg, Refinitiv, S&P Capital IQ, and Morningstar, ensuring a comprehensive and trusted view of analyst sentiment.
The library provides variables like:
syminfo.recommendations_buy
syminfo.recommendations_sell
syminfo.target_price_median
syminfo.recommendations_buy_strong
syminfo.recommendations_sell_strong
The indicator calculates and displays the median of these analyst inputs.
Usage
The indicator displays:
The median 12-month price target across analysts
The percentage difference between the price target and current price
The number of contributing analyst estimates
If no analyst data is available, the indicator does not display, ensuring full transparency.
The Median Analyst Consensus Indicator provides an unbiased, easy-to-interpret view of market sentiment by leveraging TradingView's comprehensive financial data library. This tool offers a new perspective on potential trade opportunities directly on your charts.
Disclaimer
While the data is sourced from reputable providers, analyst forecasts should not be construed as investment recommendations. This indicator aims to synthesize market opinions, but investment decisions are solely your responsibility. As with any analytical tool, you should conduct your own research and risk assessments before executing any trades.
Consensus
[blackcat] L1 Close Histogram OscillatorLevel: 1
Background
A histogram is a special chart that is applied to statistical data that is divided into numerically ordered groups. For example groups with close relationships in the vicinity like "Close-ref(Close ,1)", "Close-ref(Close,2)" and so on. A histogram provides a snapshot of all the data so that you can quickly get an overview of the historical data, especially its general shape.In a histogram, the bars are linked - in contrast to a bar chart for categorical data, in which the bars represent categories that are in no particular order and are separated. The height of each bar in a histogram indicates either the number of individuals (called the frequency) in each group or the percentage of individuals (the relative frequency) in each group. Each individual in the data set falls into exactly one bar.
Function
L2 Close Histogram Oscillator is a novel overbought and oversold indicator that estimate the trend state by counting a specific bar relationship nearby. Once nearby bars reach consensus, it may spread to global quickly. The reason why I got this inspiration is because I have been engaged in the research of blockchain consensus mechanism. The market is a complex system, and its consensus depends on the common human characteristics: greed and fear. The trend of the market often also conforms to sociological characteristics. Maybe it's a bit complicated for me to say that. However, if you understand the principle of the spread of rumors and viruses, you can understand the situation where some individuals in the market have local consensus and gradually spread to the overall situation. This is the process of trend formation.
Key Signal
fastcounter --> fast close histogram counters
slowcounter --> slow close histogram counters
attention --> bottom price appears, with height of 10 in white
readybuy --> a small position buy opportunity after first bottom detected, with height of 20 in yellow
buylow --> a small position buy at low price, with height of 30 in lime
longentry --> a confirmed long entry signal by close histogram counter, with height of 40 in green
risk --> oscillator top is reached and trend reversal may happen, with height drop from 100 to 80 in red
Pros and Cons
Pros:
1. since this is based on consensus formation principle, i think this is a leading indicator by spreading local consensus to global
2. it is an oscillator, overbought and oversold can be easily observed.
Cons:
1. the model is not complex enough to depict market behavior exactly.
2. sideways and chop market will make this indicator's output hard to read.
Remarks
This is rare! I combined my previous theory of developing cellular automata with the market to produce such a weird indicator. I hope to inspire everyone and study market behavior in a deeper level.
Readme
In real life, I am a prolific inventor. I have successfully applied for more than 60 international and regional patents in the past 12 years. But in the past two years or so, I have tried to transfer my creativity to the development of trading strategies. Tradingview is the ideal platform for me. I am selecting and contributing some of the hundreds of scripts to publish in Tradingview community. Welcome everyone to interact with me to discuss these interesting pine scripts.
The scripts posted are categorized into 5 levels according to my efforts or manhours put into these works.
Level 1 : interesting script snippets or distinctive improvement from classic indicators or strategy. Level 1 scripts can usually appear in more complex indicators as a function module or element.
Level 2 : composite indicator/strategy. By selecting or combining several independent or dependent functions or sub indicators in proper way, the composite script exhibits a resonance phenomenon which can filter out noise or fake trading signal to enhance trading confidence level.
Level 3 : comprehensive indicator/strategy. They are simple trading systems based on my strategies. They are commonly containing several or all of entry signal, close signal, stop loss, take profit, re-entry, risk management, and position sizing techniques. Even some interesting fundamental and mass psychological aspects are incorporated.
Level 4 : script snippets or functions that do not disclose source code. Interesting element that can reveal market laws and work as raw material for indicators and strategies. If you find Level 1~2 scripts are helpful, Level 4 is a private version that took me far more efforts to develop.
Level 5 : indicator/strategy that do not disclose source code. private version of Level 3 script with my accumulated script processing skills or a large number of custom functions. I had a private function library built in past two years. Level 5 scripts use many of them to achieve private trading strategy.
