Tristan's Three Line Strike PatternThree Line Strike Indicator (5-Minute Timeframe)
This indicator highlights Three Line Strike candlestick patterns on a 5-minute chart . The Three Line Strike is a rare four-candle formation that often signals trend continuation rather than reversal.
Bullish Three Line Strike (green “3LS long” above the candle):
Three strong bullish candles in a row are followed by a large bearish candle that completely engulfs the prior three. Despite looking bearish, this setup often indicates strength in the uptrend.
Bearish Three Line Strike (red “3LS sell” below the candle):
Three consecutive bearish candles are followed by a large bullish engulfing candle. Although it looks like a reversal, the downtrend commonly resumes.
How to use on the 5-min chart:
Watch for the labels marking the pattern.
A bullish signal suggests that the upward move is likely to continue after the engulfing candle.
A bearish signal suggests that the downtrend is likely to continue after the engulfing candle.
These signals are not entry/exit triggers on their own—I suggest you combine them with trend confirmation (e.g., moving averages, momentum indicators, or volume analysis) before acting.
Use good risk management, and don't buy / sell based on these indicators alone.
Continuationpatterns

Smart Wick AnalyzerSmart Wick Analyzer (SWA)
Purpose: Highlight potential liquidity‑grab candles (long wicks) and turn them into actionable, rule‑based buy/sell signals with trend, volume, and cooldown filters.
Type: Indicator (not a strategy). Educational tool to contextualize wick events.
🧠 What This Script Does
SWA looks for candles where the wick is large relative to its body—a common signature of liquidity sweeps / rejection. It then adds three confirmations before marking a trade signal:
1. Wick Event
• Upper‑wick event (possible rejection from above)
• Lower‑wick event (possible rejection from below)
• Condition: wick length > body × Wick‑to‑Body Ratio
2. Context Filters
• Trend filter : closing price vs. SMA of lookbackBars
• Volume filter : current volume vs. average volume × volumeThreshold
3. Signal Hygiene
• Cooldown : prevents clustering; a minimum number of bars must pass before a new signal is allowed.
If a candle passes these checks:
• Buy Signal (triangle up): long lower wick + price above SMA + relative‑high volume + cooldown passed
• Sell Signal (triangle down): long upper wick + price below SMA + relative‑high volume + cooldown passed
The signal candle is also bar‑colored black for quick visual focus.
⸻
✳️ What the Dotted Lines Mean (including the green one)
On every signal bar the script draws two dotted horizontal levels, extended to the right:
• Open line of the signal candle
• Close line of the signal candle
• They use the signal color: green for Buy, red for Sell.
How to interpret (example: green = Buy signal):
• The green dotted close line represents the momentum validation level. If subsequent candles close above this line, it indicates follow‑through after the wick rejection (buyers defended into the close).
• The green dotted open line is a risk context / invalidation reference. If price falls back below it soon after the signal, the wick event may have failed or devolved into chop.
In your annotated chart: the candle initially looked constructive (“closing above could be positive momentum”), but later price failed and rotated down—hence a sell signal interpreted when an upper‑wick event occurred under down‑trend conditions.
⸻
⚙️ Inputs & What They Control
• Wick‑to‑Body Ratio (wickThreshold): how “extreme” a wick must be to count as a liquidity‑grab.
• Lookback Period (lookbackBars):
• SMA period for trend context
• Volume MA for relative‑volume check
• Volume Multiplier (volumeThreshold): strengthens/loosens volume confirmation.
• Cooldown Bars (cooldownBars): minimum spacing between consecutive signals.
• Enable Alerts (showAlerts): turns on alert conditions.
⸻
🔔 Alerts (exact titles)
• “SWA Buy Alert” — potential reversal / Buy signal detected
• “SWA Sell Alert” — potential reversal / Sell signal detected
⸻
📌 How to Use (practical guide)
1. Scan for the black‑colored signal candle and its dotted lines.
2. For Buy signals (green): Prefer continuation if price closes above the green close line within the next few bars. Manage risk using the open line or your own level.
3. For Sell signals (red): Prefer continuation if price closes below the red close line.
4. Avoid chasing during low‑volume / counter‑trend signals; the filters help, but structure (HTF trend, S/R, session context) still matters.
5. Use the cooldown to reduce noise on fast time frames.
⸻
✅ Why This Isn’t Just “Another Wick Indicator”
• The script does not flag every long‑wick; it requires trend alignment and relative volume to suggest participation.
• The two reference lines (open/close) provide post‑signal state tracking—a simple, visual framework to judge follow‑through vs. failure without additional tools.
• Cooldown logic discourages clustered, low‑quality repeats around the same zone.
⸻
⚠️ Notes & Limitations
• Works across markets/time frames, but wick behavior varies by instrument and session. Parameters may need adjustment.
• Signals are contextual, not guarantees. Consolidation and news spikes can invalidate wick reads.
• This indicator is not a strategy; it does not backtest performance on its own.
⸻
📄 Disclaimer
This tool is for educational purposes only and should be combined with personal analysis and risk management. Markets are uncertain; past behavior does not guarantee future results.

70% rule strength/trend/reversalThis indicator tells you which candle closed strong for the day by identifying if the price closed above 70% of the candle's total height. this can help you identify reversals/new trends/ renewed strength in the current trend.
The indicator colors such candle green and if the candle closes with increase in price by 5% or higher then marks an asterisk under the candle.
HOPE THIS HELPS

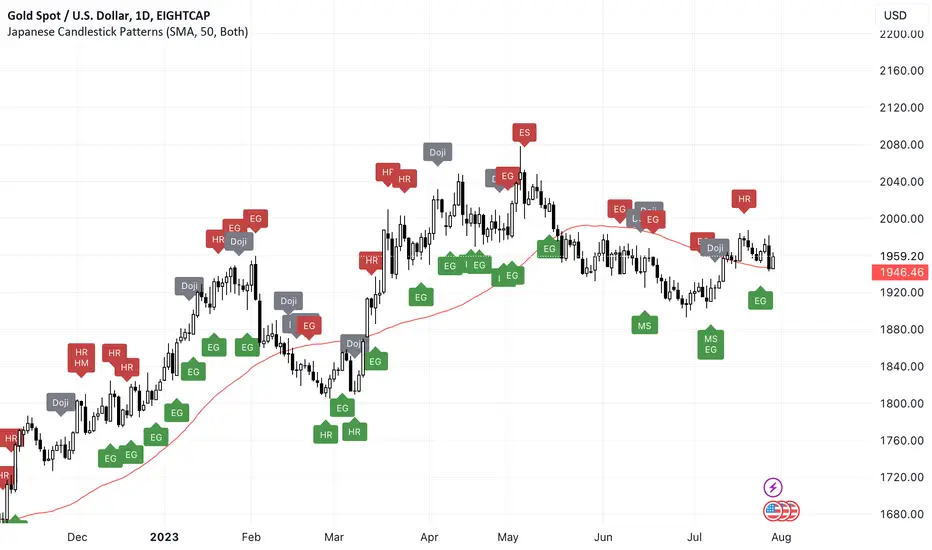
Japanese Candlestick Patterns💡 Japanese Candlesticks are a visual representation of price movements in financial markets. They were first developed by Japanese rice traders in the 18th century to analyze the price of rice contracts, and have since been adopted by traders across the world for a wide range of assets.
📌 A candlestick is composed of a rectangular body and two thin lines, known as wicks, that extend from the top and bottom of the body. The body represents the difference between the opening and closing prices of the asset during a specific time period, while the wicks indicate the high and low prices reached during that period.
📌 By using these and other candlestick patterns, traders can identify potential buying and selling opportunities and manage their risk accordingly. However, it's important to note that candlestick patterns should be used in conjunction with other technical and fundamental analysis tools to make well-informed trading decisions.
📌 Candlestick patterns are particularly useful because they are based on price action rather than external factors such as news or economic data. This makes them useful for traders who employ technical analysis, as they can use candlestick patterns to identify potential trading opportunities and manage their risk accordingly.
🚀 Candlesticks can be used to identify market trends, as well as potential buying and selling opportunities. By analyzing the patterns formed by multiple candlesticks, traders can gain insights into the behavior of the market and make informed trading decisions. Overall, Japanese Candlesticks are a powerful tool for technical analysis that can provide valuable insights into financial markets.
🔍 THE PATTERNS THAT ARE RECOGNIZED:
🔄 Reversal Patterns
* Counterattack Lines
* Dark-Cloud Cover
* Engulfing ( Bearish / Bullish )
* Hammer
* Hanging Man
* Harami ( Bearish / Bullish )
* In Neck
* On Neck
* Piercing
* Three Black Crows
* Thrusting
* Upside Gap Two Crows
⭐️ Stars
* Abandoned Baby
* Evening star
* Inverted Hammer
* Morning Star
* Shooting Star
🎯 Doji
* Doji
* Dragonfly Doji
* Evening Doji Star
* Gravestone Doji
* Long Legged Doji
* Morning Doji Star
🔥 Continuation Patterns
* Falling Three Methods
* Rising Three Methods
* Tasuki ( Upside / Downside )
🥊 Utility
* Long Lower Shadow
* Long Upper Shadow
❤️ Please, support the work with like & comment! ❤️
HTF Candlestick Patterns [TradingView] vX by DGTCandlesticks are graphical representations of price movements for a given period of time. They are commonly formed by the opening, high, low, and closing prices of a financial instrument. They have their origins in the centuries-old Japanese rice trade and have made their way into modern day price charting.
It’s important to note that candlestick patterns aren’t necessarily a buy or sell signal by themselves. They are instead a way to look at market structure and a potential indication of an upcoming opportunity. It is always useful to look at candlestick patterns in context like any other market analysis tool and candlestick patterns are most useful when used in combination with other techniques. There are countless candlestick patterns that traders can use to identify areas of interest on a chart, where some candlestick patterns may provide insights into the balance between buyers and sellers, others may indicate a reversal, continuation, or indecision.
Reversal patterns are quite useful when used in context. Reversal patterns should form at the bottom of a downtrend or at the top of an uptrend. Otherwise, they are not a reversal patterns, but continuation patterns. Most reversal patterns require confirmation such as price move in the direction of reversal accompanied by appropriate trading volume. The reversal patterns can further be confirmed through other means of traditional technical analysis—like trend lines, momentum, oscillators, or volume indicators—to reaffirm buying or selling pressure. The patterns themselves do not guarantee that the trend will reverse. Investors should always confirm reversal by the subsequent price action before initiating a trade.
This study implements some of the most commonly used candlestick patterns in a context with directional movement indicator. On request users can adjust the strong trend threshold from dialog box, eighter can disabled correlation with directional movement indicator. To add additional sight to analysis the simple moving averages of 20, 50, 100 and 200 periods are added (configurable)
You may add additional indicators of your choice. Colored DMI, BB Cloud or Price Distance to its MAs may help
Enjoy it!
Disclaimer: The script is for informational and educational purposes only. Use of the script does not constitutes professional and/or financial advice. You alone the sole responsibility of evaluating the script output and risks associated with the use of the script. In exchange for using the script, you agree not to hold dgtrd tradingview user liable for any possible claim for damages arising from any decision you make based on use of the script
