Market Crashes/Chart Timeframes HighlightThis extremely helpful indicator allows you to highlight 7 custom date-based timeframes on your charts.
The default dates selected are what I consider to be the most significant 7 most recent market declines, including and since the 87 flash crash.
Note: The default dates are approximate but good enough to highlight the key timeframes of these pullbacks/crashes/corrections.
It's simple to use and does exactly what it should.
I created this indicator to make it easier when looking at the overall story of a chart. I found it helpful to highlight these areas to see how a market or equity has responded during these significant market pullbacks.
The highlight alone I’ve found helpful, and it becomes more powerful if you combine it with your own trusted trade system.
Also, to get the most out of using the default dates it’s important to understand the narrative behind each pullback/crash. Here’s the list of what I consider significant pullbacks:
Black Monday - Oct 87
1990s Recession - Jul 90 to Mar 91
Dot Com Bubble - 2000 to 2002 or so
Real Estate 2008 Crisis - I choose 2007-2009 to cover full insider knowledge and aftermath
2016 - 2018 - This isn't seen as a pullback, but I have it as significant because in many markets and equities, this was an almost equal percentage pullback as 2008. See Notes below
2020 Crash - Covid-19 and related shenanigans pullback
April 2021 to August 2022 - I believe we are in a current SHORT cycle so I've highlighted April 2021 as the start of what might be the start of a major decline testing Dot Com or lower levels.
A few notes on the above.
You'll find on most of the pullbacks listed above most equities and related markets behave similarly or have similar patterns.
The 2016-18 pullback is the most difficult to track. For instance, GE in this timeframe had a -80% decline, whereas BA depending on how you want to measure it had a 50-110% gain.
Correctivewave

Waves CorrectionsWave theory tool for tracking waves relations and their corrections. It filters out a sets of formations and count how often correction from them are reaching characteristic correction levels marked on the chart as CL1, CL2, CL3.
It supports 2 rulesets/wave variants:
Low - Based on more sensitive trend detection.
Medium - Based on less sensitive trend detection.
Script settings:
| SCANNER |
Trend type - Trend used by scanner to detect sets of waves.
L - Low
M - Medium
<= W1/W2 * 100% <= - Tresholds describing proportions between 1 and 2 wave in the set.
<= W3/W1 * 100% <= - Tresholds describing proportions between 3 and 1 wave in the set.
<= W3/W2 * 100% <= - Tresholds describing proportions between 3 and 2 wave in the set.
Show potencial areas - Showing underway sets
Show Arrows - Showing arrows with possible correction on underway set.
Correction from trend UP - Background and border colors for found sets in up trends
Correction from trend Down - Bakcground and border colors for found sets in down trends.
History - Showing sets in historic data.
Stats - Type of statistic table shown on the screen:
H - Hide
% - Statistics with normal font
%s - Statistics with small font
Wn n= - Picking how many waves are taken into account when calculating statistics .
| TREND VISUALIZATION |
Type - Trend visualization types:
H - Hidden
L - Low
M - Medium
B - Both
Alfred - AI assistant that informs about wave confirmation or trend changes (With "Both" type Alfred will monit only Medium wave).
Shadow - Showing second reprezentation of the trend with drawing with the use of minimal and maximal values. It's usefull to determine the delay between the peak and a wave change signal.
Low/Med Line width/color - Width/color of drawn line. Separate setting for Low and Medium trend type.
| IMPULS VISUALIZATION |
Impuls - Drawing impuls modes:
H - Hidden
F - First
S - Second
A - Auto
Impuls color - Color of the first bullish arrow.
Draw arrow - Drawing arrow at the end of the first bullish arrow.
Troubleshooting:
In case of any problems, send error details to the author of the script.

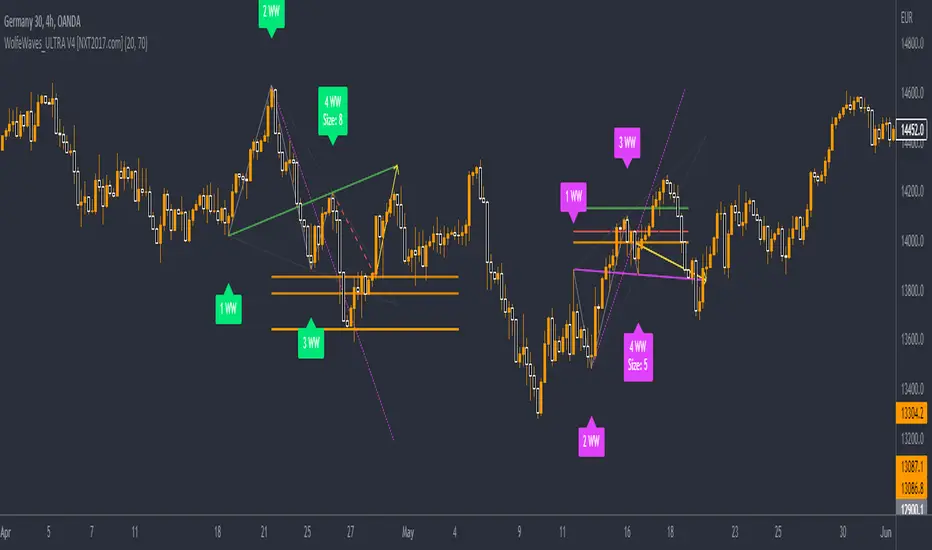
WolfeWaves_ULTRA V2 - Wolfe Wave auto lines drawing incl. SignalHI BIG PLAYERS AROUND THE WORLD,
this script allow to draw automatically lines of Wolfe Wave pattern.
Parallel to the automatic drawing, the indicator can give signals as soon as the 5 point of the Wolfe wave is immediately reached or has been reached. This allows the indicator WolfeWaves_ULTRA V2 to give early signals. In the default settings, the signals are displayed with a blue background on the chart.
WolfeWaves_ULTRA V2 is offered for sale. More information can be found below in the signature.
However, anyone can test this indicator for once without any registration in a 3 day trial. You can request access with a simple message to me.
Another trial of 7 days is included in the offer on my website - before the first payment will done.
In the settings it is possible to change the degree of details. This is sometimes necessary because TradingView limited only 55 lines per indicator in Pinescript Version 4.
In extreme cases it is therefore possible to change the settings that the Wolfe Wave pattern represent waves only from 3 lines. This allows the indicator to detect far more wolf waves on the same chart.
For more great indicators everyone is invited to follow me on TradingView.
Kind regards
NXT2017