GDP BreakdownProvides an easy way for viewing the sub sections that make up a country's total GDP. Not all countries provide data for each subsector (Agriculture, Construction, Manufacturing, Mining, Public Administration, Services, Utilities). Only countries that provide complete data are able to be selected in the settings. If I've missed any please let me know in the comment section so they can be added. This is much easier than having to individually selecting each ticker for each country when looking to compare how diversified an economy is.
Country

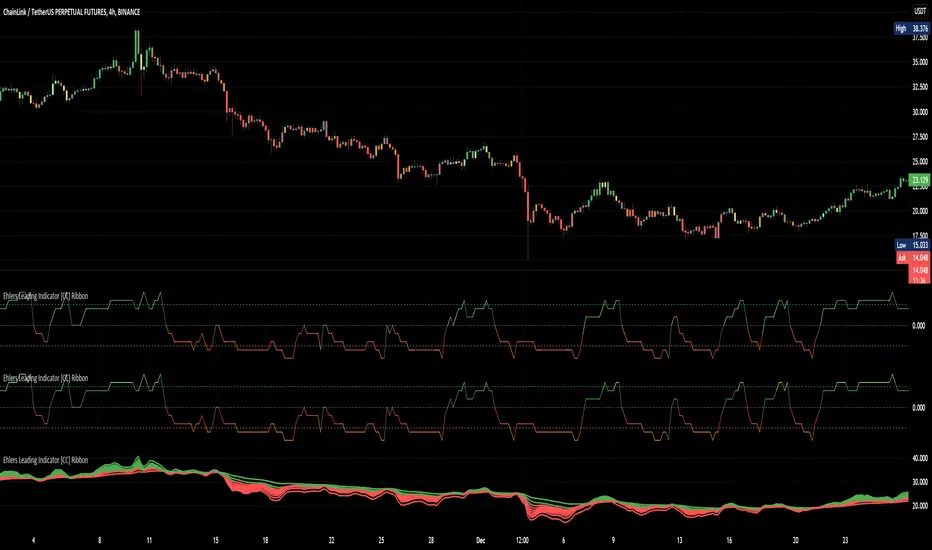
Ehlers Leading Indicator [CC] RibbonQuoted from Cheatcountry : “The Leading Indicator was created by John Ehlers (Cybernetic Analysis For Stocks And Futures pg 235) and as the name implies, this is a leading indicator that provides super early signals. Feel free to change the alpha values to adjust to your needs. Buy when the indicator line is green and sell when it is red.”
His original script:
This is a mod of Cheatcountrys script. I put it into a function and plotted several and implemented a tally of all.
Credit to him and John Ehler. Published with permission.
Terminal : USD Based Stock Markets Change (%)Hello.
This script is a simple USD Based Stock Markets Change (%) Data Terminal.
You can also set the period to look back manually in the menu.
In this way, an idea can be obtained about Countries' Stock Markets.
And you can observe the stock exchanges of relatively positive and negative countries from others.
Features
Value changes on a percentage basis (%)
Stock exchange values are calculated in dollar terms.
Due to the advantage of movement, future data were chosen instead of spot values on the required instruments.
Stock Markets
Usa : S&P 500 Futures
Japan: Nikkei 225 Futures
England: United Kingdom ( FTSE ) 100
Australia: Australia 200
Canada: S&P / TSX Composite
Switzerland: Swiss Market Index
New Zealand: NZX 50 Index
China: SSE Composite (000001)
Denmark: OMX Copenhagen 25 Index
Hong-Kong: Hang Seng Index Futures
India: Nifty 50
Norway: Oslo Bors All Share Index
Russia: MOEX Russia Index
Sweden: OMX Stockholm Index
Singapore: Singapore 30
Turkey: BIST 100
South Africa: South Africa Top 40 Index
Spain: IBEX 35
France: CAC 40
Italy: FTSE MIB Index
Netherlands: Netherlands 25
Germany : DAX
Regards.

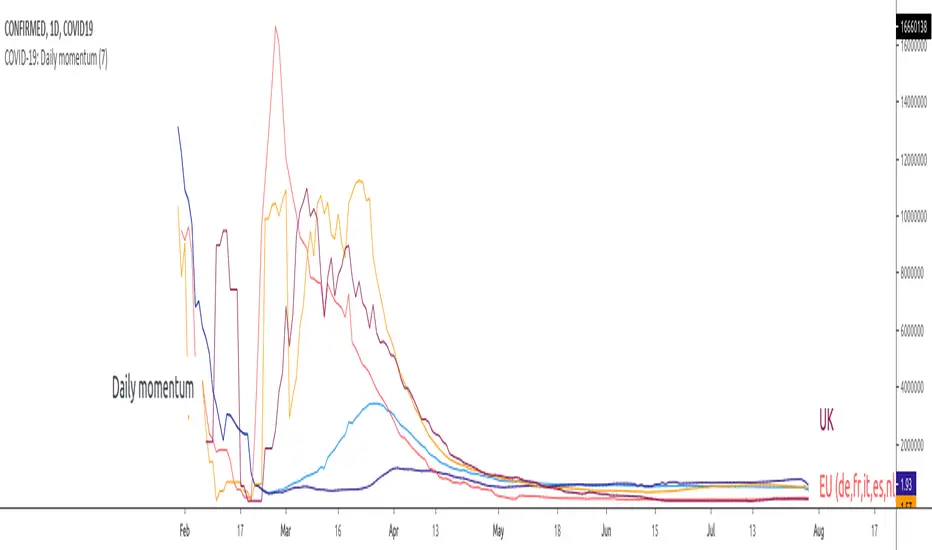
COVID-19: Daily momentumThis indicator shows 14-days moving average of daily rate of change (momentum, acceleration), in other words:
- up trends means that virus accelerates at the rate displayed on the right scale
- consolidation/horizontal movement - virus spreads at constant rate
- down trend - virus looses momentum IMPORTANT: the virus STILL accelerates but at a lower rate
By default the graphic displays World vs. EU vs. US vs. Asia while individual countries are available in Settings.
- EU includes the following countries (DE, FR, IT, ES, CH), all with more than 10k confirmed cases and more than 1k new daily infections.
- Asia includes CH and KR
To use the indicator it is important to disconnect main chart from the right scale, on main chart click on More (the 3 dots) -> Pin to scale -> Select "No Scale".