CRS by TQCRS by TradeQUO
Comparative Relative Strength Indicator
What it does
Computes the percentage difference in performance between your current chart symbol (e.g. GC1!) and a chosen benchmark (e.g. ES1!, DXY, NQ1!).
Smooths that “CRS” line with a configurable moving average (SMA, EMA, WMA) — default length is 63 bars.
Key Plots
CRS (%) (aqua) — how your symbol has held up relative to the benchmark since the chart loaded.
CRS MA (%) (fuchsia) — smoothed trend of that relative strength.
How to Interpret
Trend-Following
Long when CRS crosses above its MA and is above 0 → your symbol is outperforming.
Short (or reverse) when CRS crosses below its MA and is below 0 → underperformance.
Regime Filter
CRS > 0 → Risk-On environment for your symbol vs. benchmark.
CRS < 0 → Risk-Off relative to the benchmark.
Divergence Signals
Bearish Divergence: Price makes a higher high, but CRS makes a lower high → potential sell-off incoming.
Bullish Divergence: Price makes a lower low, but CRS makes a higher low → look for rebound opportunity.
Pairs Trading
Outperformance: Long your symbol + Short benchmark when CRS > MA.
Underperformance: Short your symbol + Long benchmark when CRS < MA.
Why it matters
Reveals relative market leadership early, not just absolute price moves.
Helps you allocate risk dynamically, spot rotations and catch reversals before they show in price alone.
CRS

Relative Strength Price Oscillator Indicator (RS PPO)Percentage Price Oscillator (PPO)
The Percentage Price Oscillator (PPO) is a momentum oscillator that measures the difference between two moving averages as a percentage of the larger moving average. As with its cousin, MACD, the Percentage Price Oscillator is shown with a signal line, a histogram and a centerline. Signals are generated with signal line crossovers, centerline crossovers, and divergences.
PPO readings are not subject to the price level of the security and the PPO values for different securities can be compared, regardless of the price of the security.
Relative Strength (RS)
Relative strength is a strategy used in momentum investing and focuses on investing in stocks or other securities that have performed well relative to the market as a whole or to a relevant benchmark.
Chart
In the chart, Microsoft stock (MSFT) is plotted against the VanEck Semiconductor ETF (SMH).
In the example on the left, from the negative values of the RS PPO it can be seen that MSFT, although trending upward, is losing out in negative terms to the SMH etf.
In the example on the right, during a correction phase with a downward price trend, Microsoft held up relatively well compared to the Van Eck Semiconductor etf.

Comparative Relative Strength(CRS), ARS,SRS,Beta,RocShows comparative relative strength(CRS) against any benchmark script , if CRS is above ARS line than ARS is Positive and if CRS turns green than SRS is positive and vice versa.

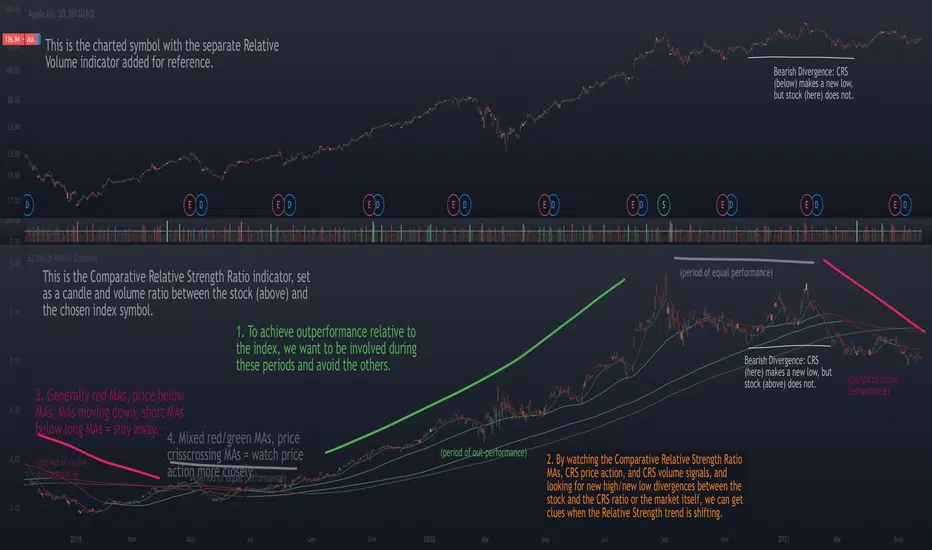
Relative Strength Ratio Chart + Relative Volume Gradient CandlesThe purpose of the Comparative Relative Strength Ratio indicator is to provide a way of looking at a relative strength ratio as a candle graph instead of only a closing price line, as well as to provide relative volume gradient coloration on the ratio-generated candles, and additionally to plot moving averages of the CRS ratio that can help display shifting trends in relative strength.
This is different from my Relative Volume Gradient Paintbars indicator, as well as my Comparison Chart with Relative Volume Gradient Paintbars indicator, in that the first looks at the charted symbol itself, the second looks at an alternate symbol, and this third indicator looks at a ratio between the charted symbol and the alternate symbol.
The idea behind this indicator is to provide additional means of evaluating relative strength, such as comparing the moving averages of the comparative relative strength ratio graph to the charted stock symbol's own MAs in order to gauge strength, comparing the price action of the ratio to that of the individual stock and its index, and comparing the volume gradient signal between the ratio, the stock, and the index.
The unique volume features allow comparing volume as a percent of the index volume, as well as stock's candle range as a percent of the range of the index. So when the volume as a percentage of the index's overall volume becomes high, this can be made to highlight the candles.
ElearnMarkets CRSHi Everyone,
How it works?
1. With this indicator you can compare any other symbol of index/security with selected symbol.
2. You can compare with three different Indices/symbols.
3. Also you can keep different timeframe to compare with the current symbol.
4. No need to add multiple indicators for same purpose.
Feel free to suggest any changes to the indicator.
I hope this indicatory could help you achieve what you expect.
Thanks,
Yogesh

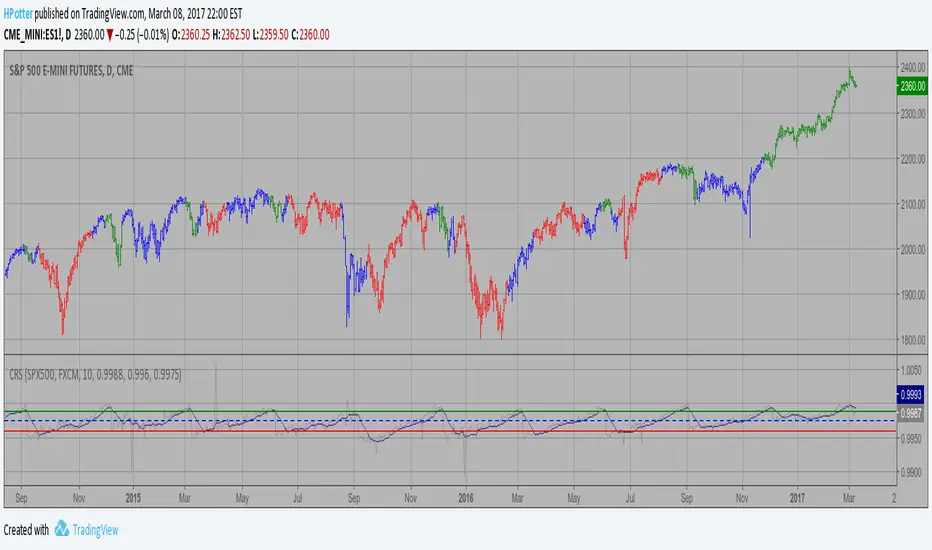
Combo Backtest 123 Reversal & Comparative Relative Strength This is combo strategies for get a cumulative signal.
First strategy
This System was created from the Book "How I Tripled My Money In The
Futures Market" by Ulf Jensen, Page 183. This is reverse type of strategies.
The strategy buys at market, if close price is higher than the previous close
during 2 days and the meaning of 9-days Stochastic Slow Oscillator is lower than 50.
The strategy sells at market, if close price is lower than the previous close price
during 2 days and the meaning of 9-days Stochastic Fast Oscillator is higher than 50.
Second strategy
Comparative Relative Strength Strategy for ES
WARNING:
- For purpose educate only
- This script to change bars colors.

Combo Strategy 123 Reversal & Comparative Relative Strength This is combo strategies for get a cumulative signal.
First strategy
This System was created from the Book "How I Tripled My Money In The
Futures Market" by Ulf Jensen, Page 183. This is reverse type of strategies.
The strategy buys at market, if close price is higher than the previous close
during 2 days and the meaning of 9-days Stochastic Slow Oscillator is lower than 50.
The strategy sells at market, if close price is lower than the previous close price
during 2 days and the meaning of 9-days Stochastic Fast Oscillator is higher than 50.
Second strategy
Comparative Relative Strength Strategy for ES
WARNING:
- For purpose educate only
- This script to change bars colors.

Comparative Relative Strength Strategy Backtest Comparative Relative Strength Strategy for ES
You can change long to short in the Input Settings
Please, use it only for learning or paper trading. Do not for real trading.