TrendaidTrendaid
is exactly what the name says
an Aid to Trend
Use this strategy to understand when the trend may shift and then use it to stay in the trends longer
simple strat
Buy when it says BULL in BLUE
Short when it says BEAR in RED
you may close your orders when it says to in PURPLE but unneeded if you want
You can adjust the stop which affects the scripts performance
You may also change from a Long to a Short line but the standard has proven to be the best overall
Let Trendaid guide you to riches
this was primarily designed for #forex but can be used in any market including #crypto
get access by joining the #CCV trading family by visiting the link below
- Cheers
SatoshiHeavy Market analyst for CCV Trading
www.cryptocurrentlyvip.com
Kripto
LOTUS BTC TRADERWelcome to the LOTUS BTC TRADER.
How to use:
This indicator only works on the BTC/USD or BTC/USDT 4 hour timeframe! Binance is recommended ( You don't have to trade on the binance chart but it it works best with this indicator).
Bull means the trend is moving up and Bear means the trend is moving down!
Alerts script is separate.

Ema BacktesterA simple, but useful script for backtesting purposes. Find the optimal Settings for your strategy.
tips are always welcome at: 38uGQJDDZDL6wX48x4gYTccPeQ3ZHVYmY4 (btc)
I hope you enjoy the script :)

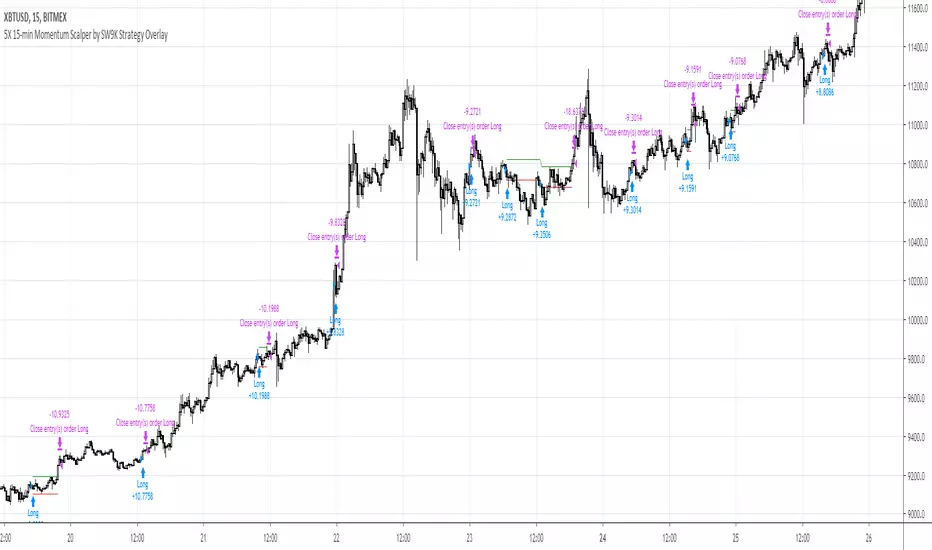
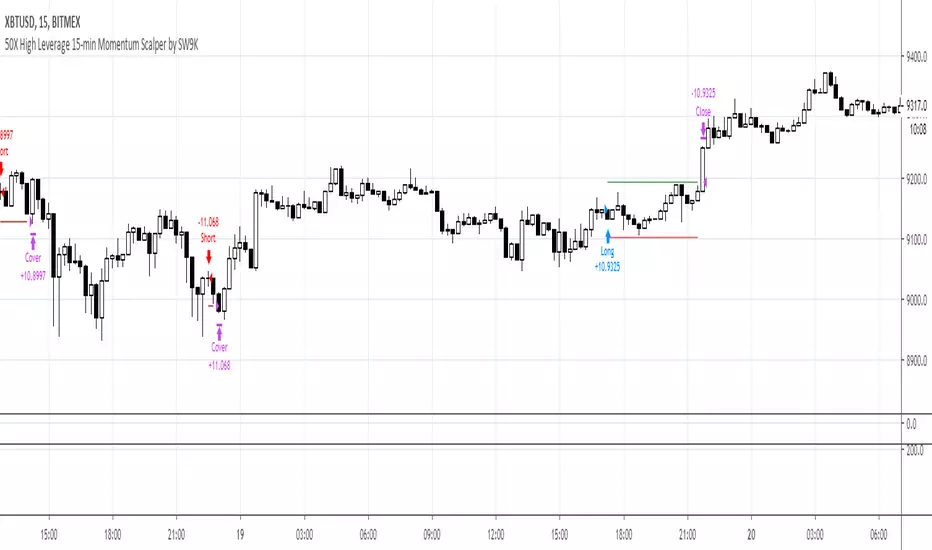
15MEX Momentum Scalper (5X)Working prototype to accurately scalp on the 15 min chart for $XBTUSD pair on BitMex. Designed to let winners run a bit, without any pre-set stop loss. Model is optimized to allow 5X leveraged underwater positions to recover into profitability. Do NOT overleverage with this strategy or you will be liquidated.
Simulated with trades since March 1, 2019, with 100k contract size entries.
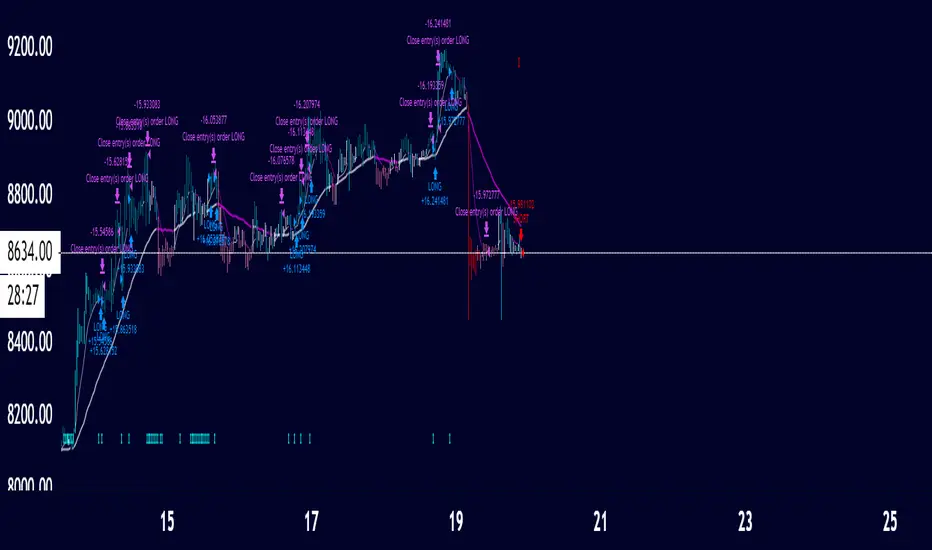
15MEX Momentum ScalperAlpha product project in development. Uses a combination of MACD and T3-CCI with tweaked settings to catch directional momentum and scalp a small move. Strategy is quantity of trades over quality of trades to build profits.
Use this strategy for 15-min Bitmex scalping on XBT contracts only. Recommend 100k contract size or less; backtested with 100k contracts.
Market enter, then use post-only limit exits and stop losses.
Setting is pre-optimized for 0.5% tp target and 0.5% sl of entry price. Recommend default 3 bars as basis for confirming recent MACD crossover as well as default 0.618 Fibonacci ratio as the T3-CCI basis.
Default risk level setting is approximately 2-3 trades a day. You can double the amount to 4-5 trades a day by enabling Aggressive mode. This may lead to larger profits and more entries, but with more frequent stop losses.
Future version will include trailing TPs/stops. Still undergoing optimization and refinement.
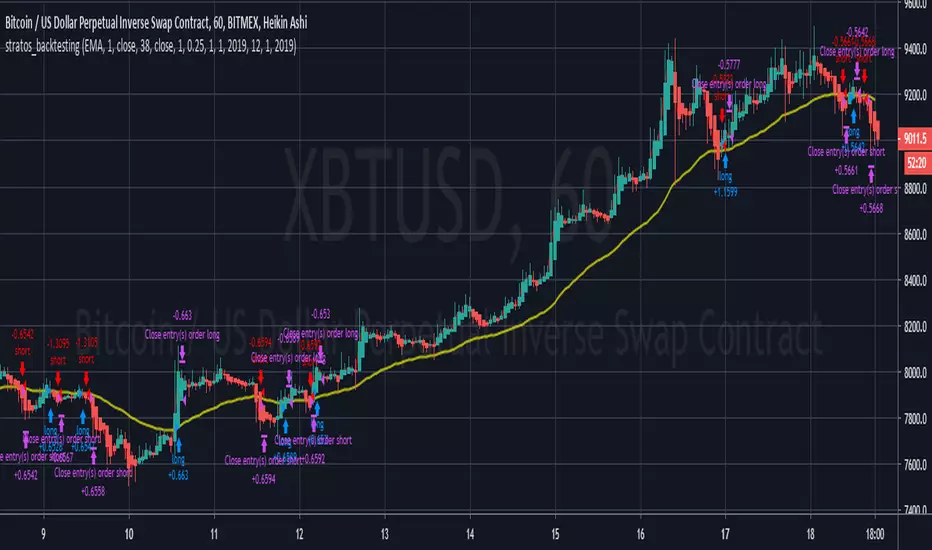
Stratos - Backtesting - Final Version - CryptoFoudid.comHi all,
Here you have the backtesting script based on Moving Average.
We trade automatically for our customers on the bitmex platform. For more information, contact me directly.
Cheers
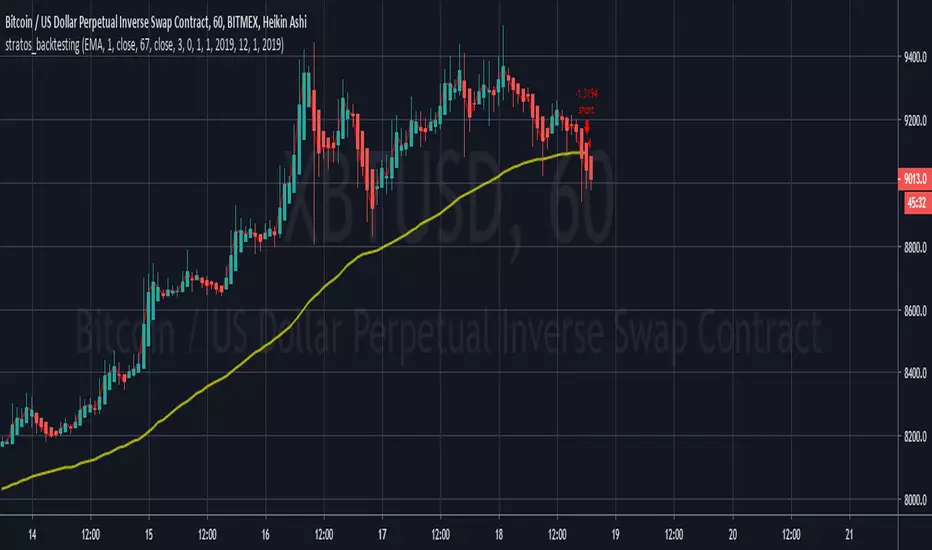
Stratos - Backtesting - Final Version - CryptoFoudid.comHi all !
Here a script based on moving averages with take profit and Stop loss configuration.
You can backtest on every timeframe and choose from when you want to backtest.
We work with our customers with automatic trading on bitmex platfform.
If you want to subscribe, you can dm me directly or on comments below
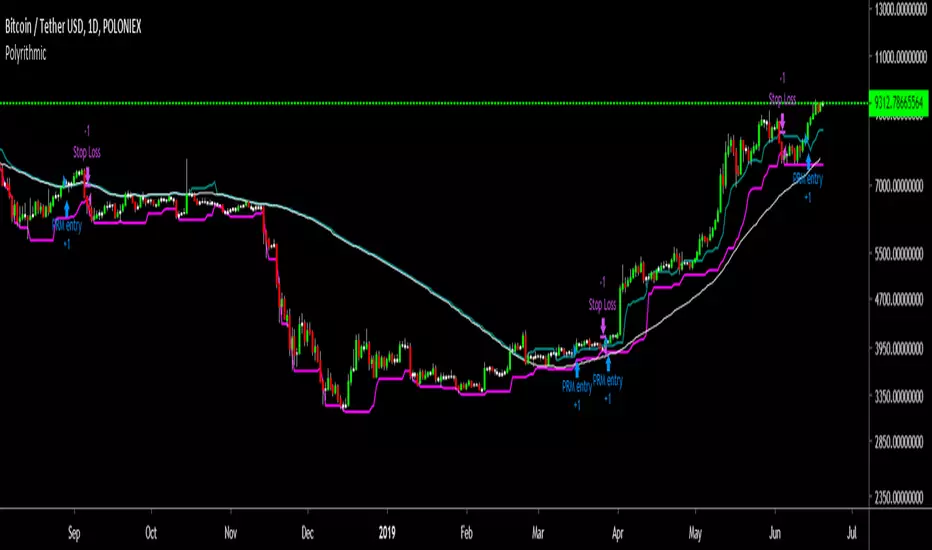
Polyrithmic Trend 2This script is designed to work on cryptocurrency.
This idea is to capture large amounts of the trend but to be able to get out when the support begins to break.
To use this script:
Buy signal:
- When the price is above the white moving average
- When the price goes over the buy line (higher / blue)
- When trading view says buy
Sell signal
- Move a stop up with the pink line and wait to be stopped out

PpSignal Wyckoff Wave Strategybased on wyckoff market analysis wave, we did the indicator and now the strategy.
for more information visit this link
stockcharts.com

Bitcoin FREE BACKTEST Version BTCUSD 5m BITFINEXA strategy for trading BTC/USD in 5m timeframe.
The strategy includes long and short trades.
You can find the Alert Setup version below.

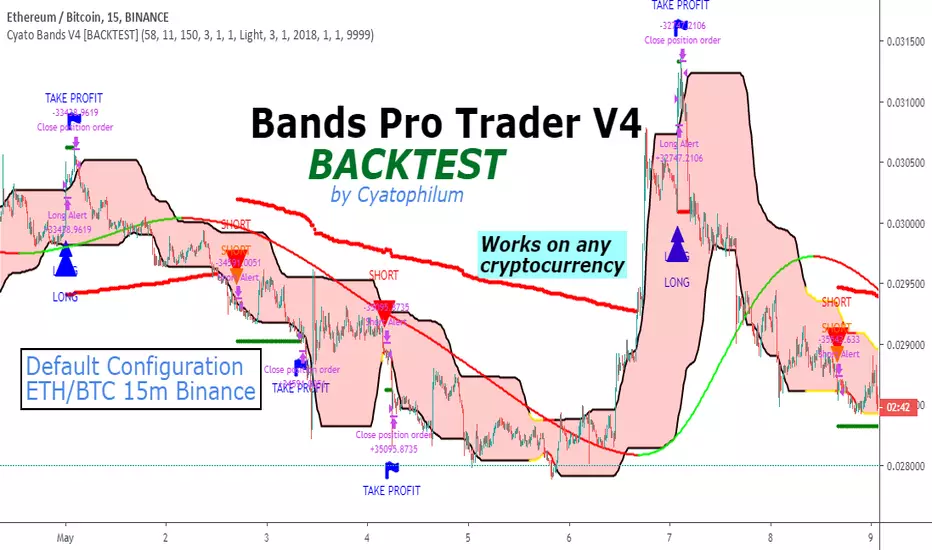
Cyatophilum Bands Pro Trader V4 [BACKTEST]This version includes a new feature, engineered to increase profitability.
About the backtest below:
Short + Long Strategy
0.05% Commission
10% of 10 000% equity per trade. Net Profit can be increased with a bigger % of equity.
Strategy data from 01/11/2019 to 30/04/2019
The Cyatophilum Bands, Trailing Stop Loss and Take Profit System are explained in the last version:
The access to this indicator and its Alert Setup version are included in the Cyatophilum Indicators pack available on my website blockchainfiesta.com
To get a free trial, leave a comment, thank you.
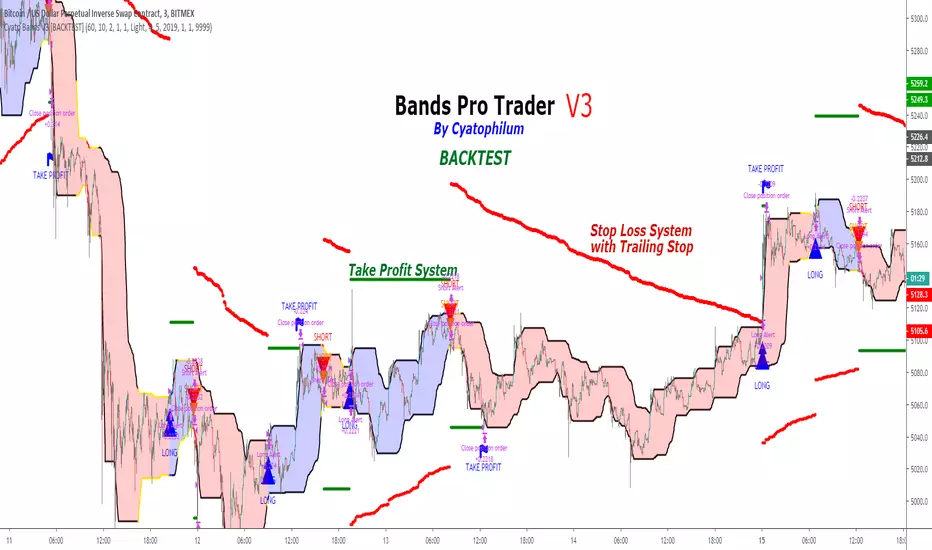
Cyatophilum Bands Pro Trader V3 [BACKTEST]An Original Automated Strategy that can be used for Manual or Bot Trading, on any timeframe and market.
>> Presentation <<
How it works
No, these are NOT Bollinger Bands..
The Cyatophilum Bands are an original formula that I created. You will probably never find it anywhere else.
Their behavior is the following:
When they are horizontal it means the trend is going sideways and they represent supports (lower band) and resistances (upper band).
When they are climbing or falling it means the trend is either bullish or bearish and they represent Trend Lines.
The strategy enters Long on a Bull Breakout and enters Short on a Bear Breakout.
The exits are triggered either on a Trend Reversal, a Stop Loss or a Take Profit.
FEATURES
Take Profit System
Stop Loss System
Show Net profit Line
More features here
Finding a profitable configuration is GUARANTEED
0. Choose your symbol and timeframe. Then add the Backtest version to your chart. If at any time you decide to change your timeframe, go back to step 1.
1. Open the strategy tester and look at the buy & hold line.
If it is mostly climbing (last value greater than 0) then it means we are in a bull market. You should then opt or a long only strategy.
If it is mostly dropping (last value lower than 0) then it means we are in a bear market. You should then opt or a short only strategy.
Note : This first step is really important. Trading against the market has very little chances to succeed.
2. Go into the Strategy Input Parameters:
check "Enable Long Results" and uncheck "Enable Short Results" if you are in a long only strategy.
check "Enable Short Results" and uncheck "Enable Long Results" if you are in a short only strategy.
3. Open the Strategy Tester and open the Strategy Properties.
We are going to find the base parameters for the Bands.
The "Bands Lookback" is the main parameter to configure for any strategy. It corresponds to how strong of a support and resistance the bands will behave. The lower the timeframe, the higher lookback you will need. It can move from 10 to 60. For example 60 is a good value for a 3 minute timeframe. Try different values, and look at the "net profit" value in the Overview tab of the Strategy Tester. Keep the Lookback value that shows the best net profit value.
Then play with the "Bands Smoothing" from 2 to 20 and keep the best net profit value.
The "Band Smoothing" is used to reduce noise.
Usually, the default value (10) is what gives the best results.
From this point you should already be able to have a profitable strategy (net profit>0), but we can improve it using the Stop Loss and the Take Profit feature.
4. To activate the Stop Loss feature, click on the "SECURITY" checkbox
You should see horizontal red lines appear.
A Long/short exit alert will be triggered if the price were to cross this line. (A red Xcross will appear)
Choose the Stop Loss percentage.
On top of that, you can enable the feature "Trailing Stop". It will make the red line follow the price, at a speed that you can configure with the "Trailing Speed" parameter.
Now, sometimes a stop is triggered and it was just a fakeout. You can enable "Re-entries after a stop" to avoid missing additional opportunities.
5. To activate the Take Profit feature, click on the "TAKE PROFIT" checkbox
You should see horizontal green lines appear.
A Long/short exit alert will be triggered if the price were to cross this line. (A flag will appear)
Choose the Take Profit percentage.
A low takeprofit will provide a safer strategy but can reduce potential profits.
A higher takeprofit will increase risk but can provide higher potential profits.
6. Money Management
You can configure the backtest according to your own money management.
Let's say you have 10 000 $ as initial capital and want to trade only 5%, set the Order Size to 5% of Equity.
You can increase net profit by increasing the order size but this is at your own risk.
How to create alerts explained here
Sample Uses Cases
Use it literally anywhere
This indicator can be used on any timeframe and market (not only cryptocurrencies).
About the Backtest below
The Net Profit (Gross profit - Gross loss) is calculated with a commission of 0.05% on each order.
No leverage used. This is a long strategy.
Each trade is made with 10 % of equity from an inital capital of 10 000$. The net profit can be bigger by increasing the % of equity but this a trader's rule to minimise the risk.
I am selling access to all my indicators on my website : blockchainfiesta.com
To get a 2 days free trial, just leave a comment , thanks !
Join my Discord for help, configurations, requests, etc. discord.gg
Cyatophilum Bands Pro Trader V2 [BACKTEST]An Original Automated Strategy that can be used for Manual or Bot Trading, on any timeframe and market.
Presentation Page with video
How it works
If you haven't yet please check the ALERT SETUP description.
How to use
Use the specific Backtest options to:
Choose a time period
Enable/Disable Long and Short results
Show the Netprofit Line on chart (green line)
About the Backtest
The Net Profit (Gross profit - Gross loss) is calculated with a commission of 0.05% on each order.
Each trade is made with 100 % of equity from an inital capital of 4000$
No leverage used. Shorts and Longs results are enabled.
Note: You can use this backtest version for finding the best configuration for your favorite market/timeframe. I will also be there to help you.
Find more backtests and configurations on my Discord : discord.gg
Can be easily automated with Autoview.
Get the indicator today!

PerPro V7 V3 Crypto ScalperIn this version of PERPRO Crypto you will be able to trade btcusd in 5 minutes and 1h, according to the recommendation enclosed. You can also look for other configurations at other times.
Money management for 1h
Take Profit = 12000
Stop Loss = 0
Trailing Stop Loss = 8000
Trailing Stop Loss Offset = 8000

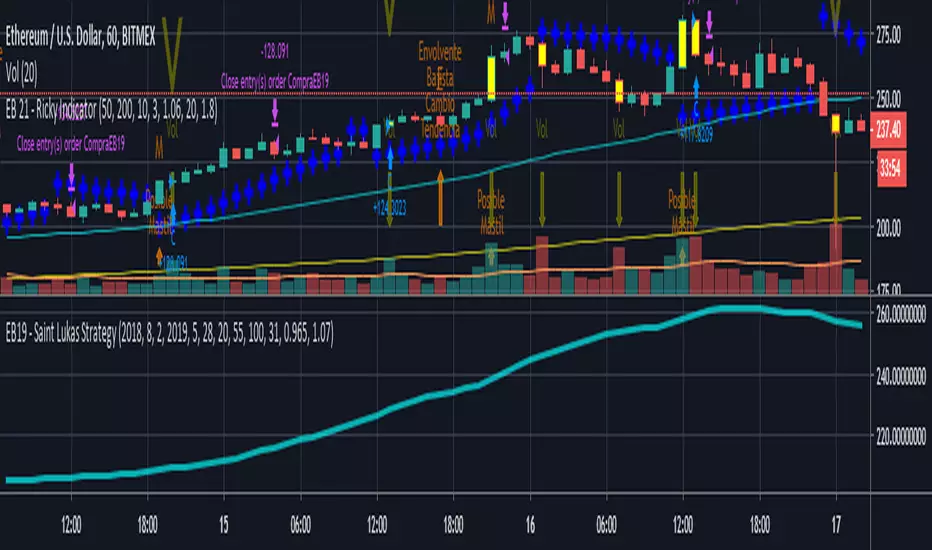
EB19 - Saint Lukas StrategySaint Lukas Strategy can be used for Long buy and sell signal.
It is used for backtesting and analyze results with differents entry parameters.
Has different entry parameters to adjust the best combination for each Crypto concurrency, Forex Pairs and Stocks.
It is not an indicator, to use in real time with real trades.
If you make a backtesting and get good results, you can contact me to analyze if I can program an indicator for you.
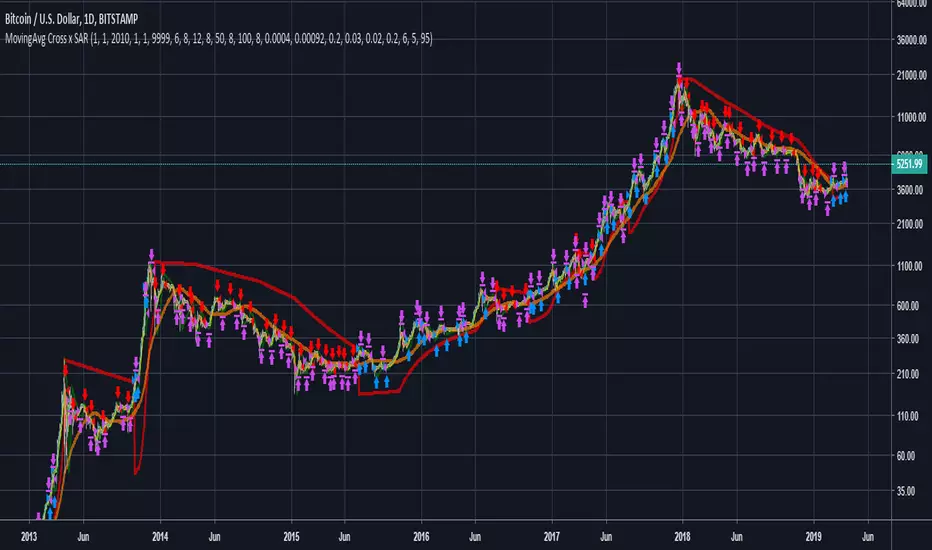
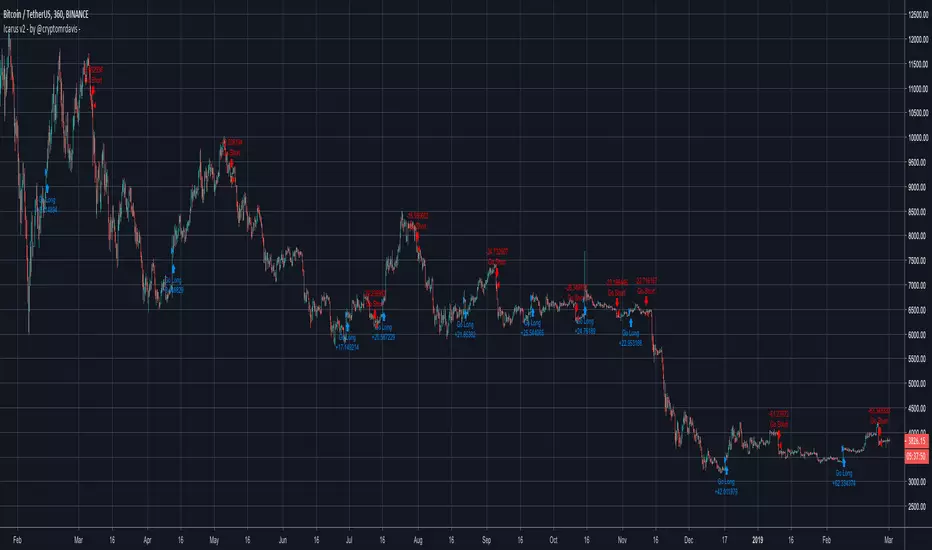
MovingAvg Cross x SARSimple yet powerful strategy to use on cryptomarkets.
I recommend use up to 2-3x leverage in order to prevent liquidations. The results will be much better than backtest if you do so.
Working timeframes are 1d and 4h , but you can test it anywhere. Set time interval in settings to avoid >3000 orders.
Feel free to add this to your favorites and use it on your own risk.
The best markets are BITMEX:XBTUSD , BITSTAMP:BTCUSD , BINANCE:XRPBTC and BITFINEX:ETHUSD .
If you found this helpful please donate and I will develop more interesting things:
BTC: 3BMEXi9EU5SRmiSxXFdTRVCpDXQeP8KMis
ETH: 0xc4ce227a1c8586794e07ca378c04a64ba6bb2387
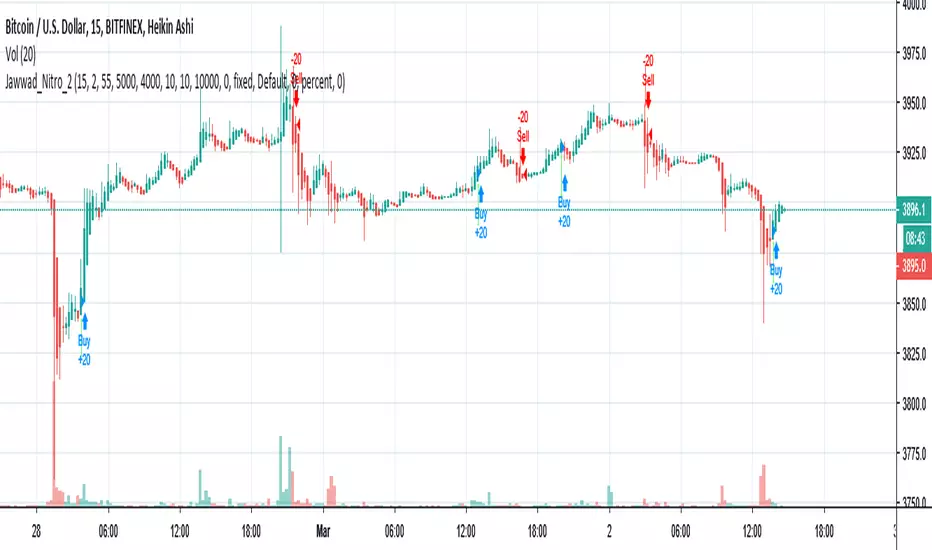
Jawwad Nitro_2 Crypto Forex Strategy - Highly ProfitableThis strategy is tested on selected crypto and forex pairs. It seems to be highly profitable and non-repainting. You can make some good money until you are following it properly and not playing with the settings.
1. Use 15 minute Heiken-ashi chart.
2. Apply the strategy.
3. Enjoy!!!
If this strategy works for you, please don't forget to buy me a cup of coffee... If you find anything wrong, please let me know. I shall be happy to fix it for you.
Cheers,
Jawwad
The People's Indicator Swing TradeThe People's Indicator Swing Trade is the Longer Term Version of the People's Indicator. It will allow you to spot patterns.

TREND PROTECTTrading system developed for protecting grid trading or gamma short positions or for taking advantage of a rise of the BTC protecting from crashes.
It is in forward test without changing the parameters since April 2018.

Trend Detector [Strategy]This is the Strategy for the Trend Detector to show the performance (real time, not delayed) on Agrello. Profit from backtesting is huge at 1,500% for daily charts. This was for 2 years of trading data on daily timeframe. It beats buy and hold no contest.
New indicator for today called Trend Detector, follows the trend. It shows buy signals when coin is going up, sell signals when it is going down. Indicator showed plenty of Buy and Sell signals at the right times for buying and selling DLT . This indicator works on real time so you get the email alerts on time so you can action it.
Message me if you are interested in using the Trend Detector Indicator and Strategy.

Cryptocurrency trend following EMA Ribbon LONG only strategyThis strategy is based on EMA Ribbon and uses multiple indicators to find optimal time to enter/exit the trade and filter out false signals. The script with default setting is developed mainly for trading altcoins/stable coin pair such as ADA/USDT etc on 4h timeframe but it can be applied to any pair/any timeframe with some settings adjustments.
For plot on chart features make sure that you have both study and strategy scripts on chart with same settings.
Strategy settings description:
1. Signal EMA Length - Value for exponencial moving average (slowest from EMA Ribbon)
1a. Buy price toleration (%) - Price deviation for filtering bounces of EMA - price must close defined percents above EMA to open long trade
1b. Sell price toleration (%) - Price deviation for filtering bounces of EMA - price must close defined percents bellow EMA to close long trade
1c. EMA deelay - EMA id delayed by defined bars for smoothening
2. Filter by Fast EMA - Strategy filters signals to prevent buy while coin is dropping
2a. Fast EMA Length - Value for fast exponencial moving average
3. Filter by SMA - Strategy filters signals to confirm trend change
3a. SMA Length - Value for simple moving average
4. Filter by RSI - Strategy filters signals to prevent buing/selling overbought/oversold coins
4a. RSI Length - Length of RSI identificator
4b. RSI Source candle - What price of candle is used for RSI calculation (open, close, high, low)
4c. RSI Long condition - When buy, RSI indicator must be below this value to prevent of buying already overbought coin
4d. RSI Short condition - When sell, RSI indicator must be above this value to prevent of selling already oversold coin
5. RSI Close Trade Condition - Strategy sell coin once RSI reach defined value
5a. RSI close trade condition - Sell once RSI indicator acquires defined value
6. Close trade by Take Profit or Stop Loss Condition (STRATEGY ONLY) - Strategy sell coin once defined take profit / stoploss level is reached
6a. Take Profit (%) - Take profit value in percent
6b. Stop Loss (%) - Stop loss value in percent
6c. Plot targets on chart - defined targets will be plotted as lines on chart
7. Date range from
7a From Year - To run strategy in interval
7b From Month - To run strategy in interval
7c From Day - To run strategy in interval
8. Date range to
8a To Year - To run strategy in interval
8b To Month - To run strategy in interval
8c To Day - To run strategy in interval
9. Wait to confirm the signal
9a Wait candless to buy - strategy will wait defined candless to confirm the signal before buy
9b Wait candless to sell - strategy will wait defined candless to confirm the signal before sell
10. Plotting on chart (STUDY ONLY)
10a Plot signal line channel with bows on chart
10b Plot simple moving average on chart
10c Plot EMA Ribbon on chart
10d Plot recent support and resistance levels on chart
11. Show Every signal (STUDY ONLY) - Unchecked shows only first signal based on strategy. But if you use take profit/stoploss settings within your bot, you might want to rebuy on next signal. Checked shows signal on each candle.
Throw on chart also buld-in RSI indicator and set the same as strategy
Notice that there might be false signals, especially when the coin is not trending or is strongly manipulated. Overall strategy is profitable though. You just take some minor loses and wont miss the big move.
You may also consider to compare buy&hold return vs profit from trading this strategy. In downtrend as we have seen recently, profit may not be as high as you expect but it is still much better than just hold and hope.
You can use the strategy script for fine tunning settings and find best settings for yourself.
Study script helps you to automate trading with use of alerts perharps with 3commas bot or even trade manually based on email/sms notification setted by tradingview
Notice that study script does not handle takeprofit/stoploss order. That is why sell arrows could be plotted by study script later than strategy script. To rebuy after takeprofit/stop-loss use "11. Show Every signal (STUDY ONLY)" setting
Make sure that you keep same settings for strategy and study scripts.
If you need any help with settings do not hesitate to ask. I would also appriciate any feedback and ideas how to improve this script.
Here is backtest result from 1. Nov 2018 using constant 100USD Buy ammount:
