MACD oscillator with EMA strategy 4H This is a simple, yet efficient strategy, which is made from a combination of an oscillator and a moving average.
Its setup for 4h candles with the current settings, however it can be adapted to other different timeframes.
It works nicely ,beating the buy and hold for both BTC and ETH over the last 3 years.
As well with some optimizations and modifications it can be adapted to futures market, indexes(NASDAQ,NIFTY etc), forex(GBPUSD), stocks and so on.
Components:
MACD
EMA
Time condition
Long/short option
For long/exit short we enter when we are above the ema, histogram is positive and current candle is higher than previous.
For short /exit long , when close below ema, histo negative and current candles smaller than previous
If you have any questions please let me know !
Kripto

ELIA MULTI INDICATORS STRATEGYExperimental multi indicators strategy, to catch right entry and avoid noise.
Each indicator included in the strategy, assume a value based on its status and because is a trend-follow strategy, some indicator value are higher then the other
Backtested on ETHUSDTPERP
BINANCE:ETHUSDTPERP

Scalping Dips On Trend (by Coinrule)Coinrule's Community is an excellent source of inspiration for our trading strategies.
In these months of Bull Market, our traders opted mostly on buy-the-dips strategies, which resulted in great returns recently. But there has been an element that turned out to be the cause for deep division among the Community.
Is it advisable or not to use a stop-loss during a Bull Market?
This strategy comes with a large stop-loss to offer a safer alternative for those that are not used to trade with a downside protection.
Entry
The strategy buys only when the price is above the Moving Average 50 , making it less risky to buy the dip, which is set to 2%.
The preferred time frame is 1-hour.
The stop-loss is set to be quite loose to increase the chances of closing the trade in profit, yet protecting from unexpected larger drawdowns that could undermine the allocation's liquidity.
Exit
Stop loss: 10%
Take Profit: 3%
In times of Bull Market, such a trading system has a very high percentage of trades closed in profit (ranging between 70% to 80%), which makes it still overall profitable to have a stop-loss three times larger than the take profit.
Pro tip: use a larger stop-loss only when you expect to close in profit most of the trades!
The strategy assumes each order to trade 30% of the available capital and opens a trade at a time. A trading fee of 0.1% is taken into account.

(IK) Stoch-60-15This strategy uses 60 minute and 15 minute stochastic data to determine entry and exit; it only executes long trades. I've only used this on BTC/USD, but I imagine the concepts employed should hold for any ticker
The script builds a simple Stochastic indicator for the current timeframe, and it also plots a single stochastic line for a higher resolution time frame. I've found good results trading on 15 minutes with a 60 minute higher resolution.
We enter a trade if the higher resolution stochastic is in an uptrend, if the current resolution stochastic is in an uptrend, and if the current stochastic value is less than 50.
We exit a trade when the current stochastic value crosses below 80 or the trailing stop loss is hit.
Stop loss is calculated with the input value, Stop Loss Percent. This value represents the percent of capital you're willing to lose before exiting a trade. A stop loss percent of 0.050 means your trade will exit if it falls 5% from the highest high since entering a trade. You will have at least 95% of your original capital left. There is no option to change a trailing stop loss to a set stop loss (in order to keep the code as simple as possible), however, you can turn it off by setting Stop Loss Percent to 1.
I tried to keep the script itself lightweight and very easy to understand, so it's not very customizable in regards to input options. You can change stochastic data, as well as the trailing stop percentage. The script can be adjusted to other timeframes, however this requires a small change in the code (details in script comments). Changing just the "Higher Resolution" input will not produce expected results
My hope is that by keeping it lightweight and simple, it will be easier for you to adjust to your specific needs, or work into a larger strategy.

Crypto rsi cci mf stoch rsi oscillators all in one strategyThis is a strategy based on the popular oscillator like RSI, CCI, MF and Stochastic RSI oscillators.
In this situation I use a very high length , 100 candles, and the middle point between overbought and oversold levels at 50.
The entry for long is when all oscilators are above 50, and the exit is when they are below 50 + plus some minor modifications
If you have any questions, please message me a private message !

3Commas Bollinger StrategyThis strategy is intended for use as a way of backtesting various parameters available on 3commas.io composite bot using a bollinger band type trading strategy. While it's primary intention is to provide users a way of backtesting bot parameters, it can also be used to trigger a deal start by either using the {{strategy.open.alert_message}} field in your alert and providing the bot details in the configuration screen for the strategy or by including the usual deal start message provided by 3commas. You can find more information about how to do this from help.3commas.io
The primary inputs for the strategy are:
// USER INPUTS
Short MA Window - The length of the Short moving average
Long MA Window - The length of the Long moving average
Upper Band Offset - The offset to use for the upper bollinger offset
Lower Band Offset - The offset to use for the lower bollinger offset
Long Stop Loss % - The stop loss percentage to test
Long Take Profit % - The Take profit percentage to test
Initial SO Deviation % - The price deviation percentage required to place to first safety order
Safety Order Vol Step % - The volume scale to test
3Commas Bot ID - (self explanatory)
Bot Email Token - Found in the deal start message for your bot (see link in previous section for details)
3Commas Bot Trading Pair - The pair to include for composite bot start deals (should match format of 3commas, not TradingView IE. USDT_BTC not BTCUSDT)
Start Date, Month, Year and End Date, Month and Year all apply to the backtesting window. By default it will use as much data as it can given the current period select (there is less historical data available for periods below 1H) back as far as 2016 (there appears to be no historical data on Trading view much before this). If you would like to test a different period of time, just change these values accordingly.
Known Issues
Currently there are a couple of issues with this strategy that you should be aware of. I may fix them at some point in the future but they don't really bug me so this is more for informational purposes than a promise that they may one day be fixed.
Does not test trailing take profit
Number of safety orders and Safety Order Step Scale are currently not user configurable (must edit source code)
Using the user configuration to generate deal start message assumes you are triggering a composite bot, not a simple bot.

Momentum Strategy (BTC/USDT; 1h) - MACD (with source code)Good morning traders.
It's been a while from my last publication of a strategy and today I want to share with you this small piece of script that showed quite interesting result across bitcoin and other altcoins.
The macd indicator is an indicator built on the difference between a fast moving average and a slow moving average: this difference is generally plottted with a blue line while the orange line is simply a moving average computed on this difference.
Usually this indicator is used in technical analysis for getting signals of buy and sell respectively when the macd crosses above or under its moving average: it means that the distance of the fast moving average (the most responsive one) from the slower one is getting lower than what it-used-to-be in the period considered: this could anticipate a cross of the two moving averages and you want to anticipate this potential trend reversal by opening a long position
Of course the workflow is specularly the same for opening short positions (or closing long positions)
What this strategy does is simply considering the moving average computed on macd and applying a linear regression on it: in this way, even though the signal can be sligthly delayed, you reduce noise plotting a smooth curve.
Then, it simply checks the maximums and the minimums of this curve detecting whenever the changes of the values start to be negative or positive, so it opens a short position (closes long) on the maximum on this curve and it opens a long position (closes short) on the minimum.
Of course, I set an option for using this strategy in a conventional way working on the crosses between macd and its moving average. Alternatively you can use this workflow if you prefer.
In conclusion, you can use a tons of moving averages: I made a function in pine in order to allw you to use any moving average you want for the two moving averages on which the macd is based or for the moving average computed on the macd
PLEASE, BE AWARE THAT THIS TRADING STRATEGY DOES NOT GUARANTEE ANY KIND OF SUCCESS IN ADVANCE. YOU ARE THE ONE AND ONLY RESPONSIBLE OF YOUR OWN DECISIONS, I DON'T TAKE ANY RESPONSIBILITY ASSOCIATED WITH THEM. IF YOU RUN THIS STRATEGY YOU ACCEPT THE POSSIBILITY OF LOOSING MONEY, ALL OF MY PUBBLICATIONS ARE SUPPOSED TO BE JUST FOR EDUCATIONAL PURPOSES.
IT IS AT YOUR OWN RISK WHETHER TO USE IT OR NOT
But if you make money out of this, please consider to buy me a beer 😜
Happy Trading!

Keltner + RSI Bitcoin Futures Trading [luca_badoer]This indicator combines the power of the Keltner channel with the power of the Relative Strength Indicator (RSI). It can help understand when the market is entering a bullish or a bearish trend.
Normally a Keltner channel would reference an Exponential Moving Average (EMA) of the price. In this case the Keltner Channel in the "Keltner + RSI Bitcoin Futures Trading " references the EMA of the 14-day RSI (white line). On top of that it overlays a 7-day RSI line (blue line). This produces some signals that are particularly useful in 2h, 4h and 1 day charts. The signals consist in the 7-day RSI line (blue line) crossing the upper (green) or lower (red) Keltner channels as well as the middle (white) line. Depending on the direction of the crossing (up or down) and the RSI level (from 0 to 100) at which the crossing takes place this produces bullish or bearish signals.
Examples:
- Bullish crossing: 7-day RSI (blue) crosses both the lower (red) and middle (white) lines upwards at a low to neutral RSI level (<70%)
- Bearish crossing: 7-day RSI (blue) cross both the upper (green) and middle (white) lines downwards at a high to neutral RSI (>30%)
Recommendations:
- Better to use it in 2h, 4h, and 1-day charts, thought it can also be used in lower timeframes. Confirmations of crossings in higher time-frames provide more certainty about the direction of the move.
- Use in combination with Heikin Ashi candles and volume indicators.

ATR Without OutliersIt is an ATR indicator which filters out outliers.
Outliers are values which are higher than the standard deviation of the true range.
It may be better than normal ATR for stop loss, because it does not keep large values after pump or dump.
It is very useful for high volatile markets like crypto markets.

Arbitrage Sniper (POC)Good Morning Traders!
Today I want to share with you the proof-of-concept of how you would be able to do arbitrage with crypto pairs.
THE INDICATOR MUST BE PLACED ON THE TRADING PAIR OF THE TWO CURRENCIES (i.e. ETH/BTC, EOS/ETH etc.)
This arbitrage method is based on the transitional decorrelation between the crypto treding pair and the price ratio of the involved currencies, of course computing commissions as well.
Whenever the non-arbitrage condition is not respected, there is an arbitrage oportunity.
This indicator won't consider the chance of shorting, so if the arbitrage oportunity occurs the indicator will suggest you just the chance of buying the relative-undervalued currency (but inside the code you will know how to do the alternative method as well, by shorting the relative-overvalued currency)
Let's take the trading pair ETH/BTC (as in the graph) → if we assume commissions for the 0.075% of the order, the non-arbitrage condition will be presented like this
This arbitrage method will need three orders, so n=3
So let's assume that P(ETH)/(P(BTC)*P(ETH/BTC))>(1-0.075)^(-3) → it means that the price of Ethereum is currently overreated enough (relatively to the trading pair) for doing arbitrage.
We have two alternatives:
• Buy BTC, change it into ETH (by "buying" ETH in the trading pair ETH/BTC) and then sell ETH
• Sell ETH, buy BTC, change it into ETH (by "buying" ETH in the trading pair ETH/BTC)
On the other hand, if P(ETH)/(P(BTC)*P(ETH/BTC))<(1-0.075)^(-3) → it means that the price of Ethereum is currently underrared enough (relatively to the trading pair) for doing arbitrage.
We have two alternatives:
• Buy ETH, change it into BTC (by "selling" ETH in the trading pair ETH/BTC) and then sell BTC
• Sell BTC, buy ETH, change it into BTC (by "selling" ETH in the trading pair ETH/BTC)
I'm saying that is nothing more than a proof-of-concept since:
- Arbitrage Oportunities will emerge frequently just nearly zero commissions
- Data of prices are retrieved using security() function and there can be some delay (so the arbitrage oportunity will be already extinguished by the time the signal is retrieved)
- In order to have the freshest data, repiainting will occurr

Rate ConverterThis is a simple rate converter that can convert almost anything into almost anything else. It supports cryptocurrencies, currencies and most commodities.
On the chart we see the following:
USD (US Dollar) into EUR (Euro) as a candle stick chart
WTICO (West Texas Intermediate Crude Oil) into ISK (Icelandic Krona) as a bar chart
ADA (Cardano) into JMD (Jamaican Dollar) as a line chart
XPT (Platinum) into XAG (Silver) as a scatter plot
It supports plotting the rates as japanese candlesticks, bars, lines, or as a scatter plot.

Ark Crypto HeatlineThis is the 'on chart' indicator. See also "Ark Crypto Heatband" indicator for a side-by-side BTC view, without a re-scaled line.
The crypto landscape is largely dominated by BTC and characterised by cyclical stages with varying degrees of mean reversion.
To understand what stage of the cycle we are currently experiencing, it is useful to examine to what degree the current price has extended beyond the long term average that BTC has established. This is true even when analysing other crypto assets as BTC is the dominant force in the crypto asset class.
This indicator uses the 1400 period daily SMA , which is broadly the 200 period weekly SMA. This can be configured, but historically has represented a baseline to which BTC commonly returns.
The graph plots current price in terms of multiples of this long term average. Traditionally, at multiples beyond 10, BTC is considered overextended with a higher likelihood of trending towards the mean thereafter. Colors indicate the extent of price extension.
Where the indicator is applied to non BTCUSD pairs, a smoothed conversion is applied, seeking to superimpose the BTC long period SMA onto the current chart.
The indicator specifically references BTC by default on all charts, as it is designed to use BTC as general purpose indication of where crypto as a whole currently sits. Accordingly the indicator is only to be used on crypto charts.
For best results on BTC, using BNC:BLX will give the longest historical view.

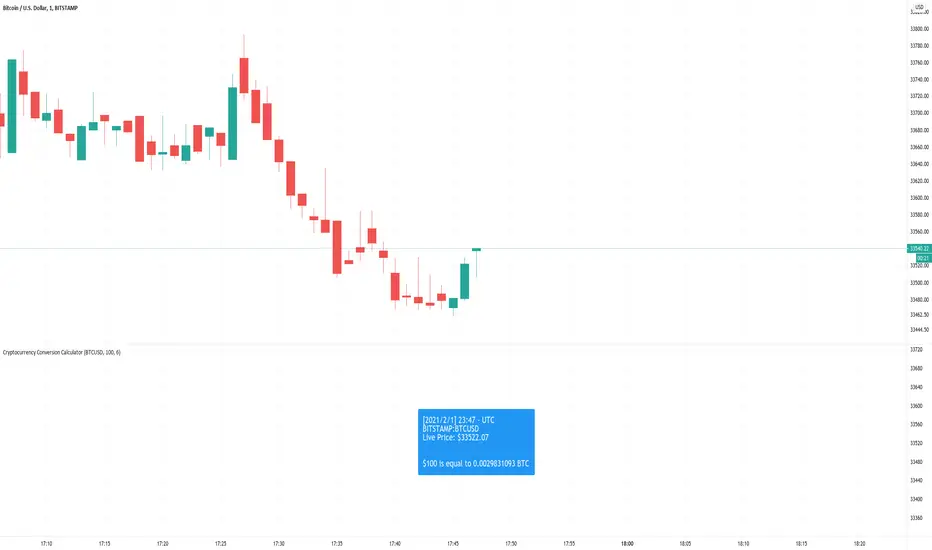
Cryptocurrency Conversion CalculatorA calculator that gives you the amount of a coin that is equal to the inputted value.
Options to configure are the ticker, amount in USD that will be converted, and how many digits you would want to be shown after the decimal point.
Currently, this only supports USD quote currencies. Ideally in the future, the code will be rewritten. Maybe.
Ark Crypto HeatbandThe crypto landscape is largely dominated by BTC and characterised by cyclical stages with varying degrees of mean reversion.
To understand what stage of the cycle we are currently experiencing, it is useful to examine to what degree the current BTC price has extended beyond a long term average. This is true even when analysing other crypto assets and helpful to view side by side.
This indicator uses the 1400 period daily SMA, which is broadly the 200 period weekly SMA. This can be configured, but historically has represented a baseline to which BTC commonly returns.
The graph plots current price in terms of multiples of this long term average. Traditionally, at multiples beyond 10, BTC is considered overextended with a higher likelihood of trending towards the mean thereafter. Colors indicate the extend of price extension.
The indicator specifically references BTC by default on all charts as it is designed to use BTC as general purpose indication of where crypto as a whole currently sits. Accordingly the indicator is only to be used on crypto charts.

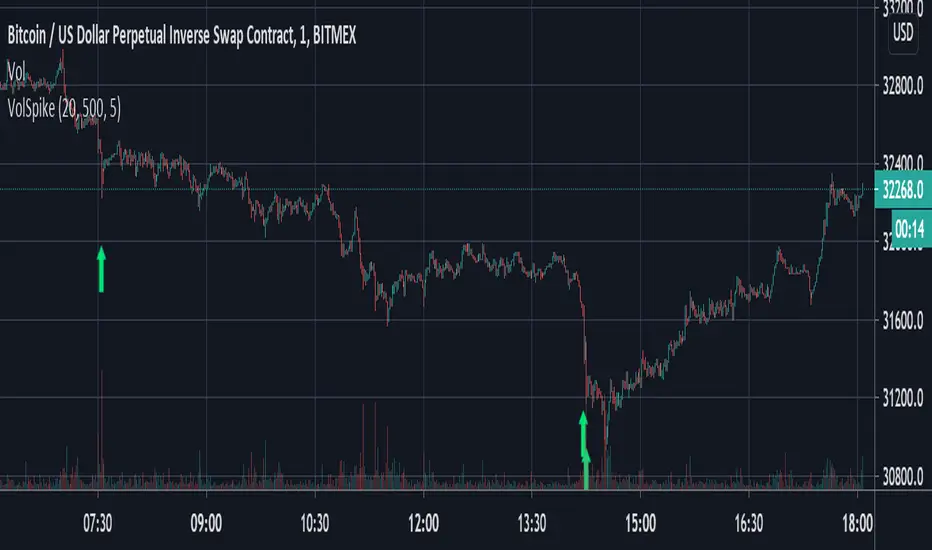
Volume Spike Strategy This is a Pine Script implementation of “Capitalize AI: Volume Spike Strategy" by Bitcoin Trading Challenge (copied with permission).
Original Capital AI formula :
If BTC/USD 1 minute volume > BTC/USD average volume in 20-1m bar by at least 500% and if BTC/USD is below the MA (5,1m,close) of BTC/USD then buy 10,000 USD WORTH of BTC/USD
Tested on XBTUSD 1 minute.
Original strategy is buy-only. Option for sells was added (enable in settings).
First published script -- comments/feedback appreciated
Ehler Fisher applied on distance EMAThis is an improved version of Fisher, which use as a source the distance from EMA , compared to the initial source which was on the close of a candle.
It can be used in any market, any time frame .
For conditions we have multiple conditions for the logic, in this case initially if our fisher is above 0 is a long direction ,if its belowe 0 its a short direction.
Also we can improve this condition even further, in this case if we cross up our previous line its a buy signal, and if we cross down its a sell signal.
For best usage combine the cross together with the position of fisher respecting the 0.
If you have any other questions, let me know with a private message.

Ichimoku Crypto LONG 3h ANY CRYPTO PairThis is a strategy which works with most of the crypto pairs on the 3H time frames.
It beats easily on the long term buy and hold strategy.
This strategy is made from the baseline from ichimoku together with ema 200
This is a long only strategy.
THe condition is : our candle is above ema 200 and our ichimoku its telling we have a long trend. We exit on the opposite signal.
If you have any questions private message me !

OBV Accumulation / Distribution Strategy CryptoThis version its made for 8-12h and works amazingly on the ETH pairs. Can be adapted to others as well
For this example, I used an initial 1$ account, using always full capital on each trade(without using any leverage), together with a 0.1% commission/fees for each deal, on Coinbase broker.
This is a long only strategy
The components for the inside of the strategy are the next one :
1. OBV Accumulation/Distribution
3. EMA
The rules here are simple : we check for cross up or above on OBV and EMAmoving average and after that we check for the trend direction based on ascending/descending OBV. Based on this we enter long or exit long.
RISK WARNING
Trading on any financial market involves a risk of loss. Please consider carefully if such trading is appropriate for you. Past performance is not indicative of future results.
If you have any questions or you are interested in trying it, private message me and I will give you as soon as I see the message a trial for it.

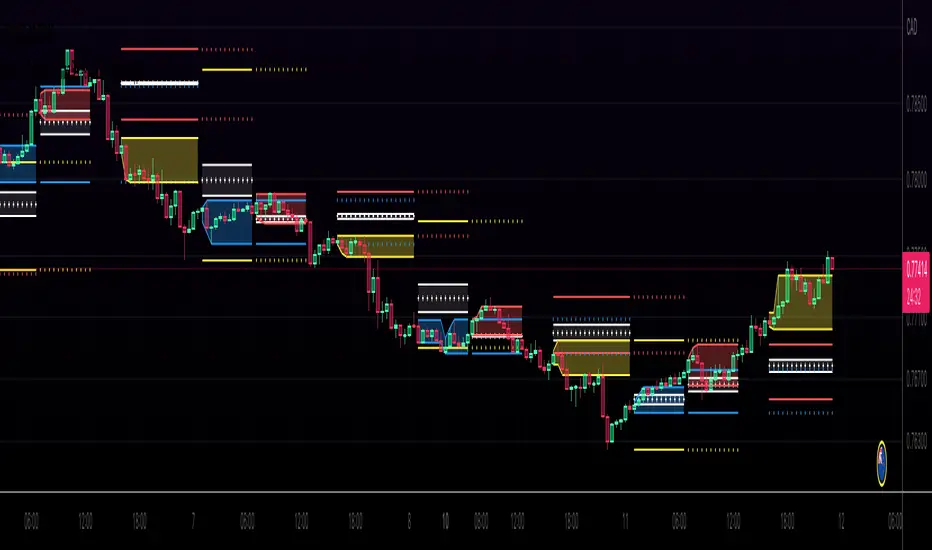
Kviateq - Session Pivots for CryptoPretty much the exact same indicator as my other Session Pivots, however this one also shows the weekends and the session times are set to Bitmex exchange (note: I'm in a GMT+7 timezone myself).
Heikin Ashi + Price Action Crypto LONG StrategyThis is a simple and efficient crypto strategy, designed for big timeframes like 12/24h.
On history it beats buy and hold strategy in many ocasions, and because of a low DD, pyramid can be used to elevate our winnings while still keeping a low DD < 40% avg.
For the purpose of this example, I used 100% of the capital on each trades, together with a comission of 0.1%
Warning : THERE IS NO STOP LOSS ON THIS STRATEGY ,USE IT AT YOUR OWN RISK
This strategy is made with inside Heikin Ashi candles , together with some price actions logics like for long Close > High and green candle and High > High .
We exit when we have a red candle and the current close is lower than the previous Low
If you have any questions, message me in private !

Heikin-Ashi Change Strategy/ Indicator
Today I bring you a simple and efficient indicator/strategy based only on HA.
Can be used together with other TA tools or alone.
The idea behind is simple :
We have to forms to calculate the candle, using inner HA candles or normal candles. Once we have that we apply certain rules to get the max high, min low, open and close(ohlc)
With that then we check for changing in the patters like for example
For long close is higher than open and the previos close is lower than open. For short is going to be the opposite of long condition.
For the purpose of this example, I only use long direction and exit once we have the short signal.
If you have any questions, please let me know in private chat !

Realized Volatility (annualized for any time frame)Plots standard deviation of returns (realized volatility), and annualizes it for the selected timeframe. Suitable for forex/cryptocurrencies which trade 24/7.

Momentum Strategy (BTC/USDT; 30m) - STOCH RSI (with source code)Here's a strategy for low time frames (30min suggested) for BTC , based on momentum Analysis using Stochastic RSI
By default the strategy will use the 50% of the specified capital for each trade; if "Gamble Sizing" is enabled, it will add the specified amount of capital (25% by default, until reaching the 100% limit or lower) for the next trade after having detected a loss in the previous trade; if the next trade is successful, the size for the next trade comes back to 50%
• Trend Filter LONG: If the fast exponential moving average is UNDER the slow exponential moving average , it won't open LONG positions
• Trend Filter SHORT: If the fast exponential moving average is ABOVE the slow exponential moving average , it won't open SHORT positions
• Bars delay: the strategy will wait the specified amount of bars before closing the current position; the counter is triggered as soon as the closing trade condition is verified
BY MAKING USE OF THIS STRATEGY, YOU ACKNOWLEDGE AND AGREE THAT: (1) YOU ARE AWARE OF THE RISKS ASSOCIATED WITH TRANSACTIONS OF DIGITAL CURRENCIES AND THEIR DERIVATIVES; (2) YOU SHALL ASSUME ALL RISKS RELATED TO THE USE OF THIS STRATEGY AND TRANSACTIONS OF DIGITAL CURRENCIES AND THEIR DERIVATIVES; AND (3) I SHALL NOT BE LIABLE FOR ANY SUCH RISKS OR ADVERSE OUTCOMES.
SOURCE CODE BELOW
