Syminfo.TypeHello traders
Earlier this week I discovered a new built-in variable called syminfo.type
What is it for?
This variable returns the type of the current symbol. Possible values are cfd, stock, futures, indices, forex, crypto, fund.
Cool bro but... should we care?
Well... we all should. Imagine you have a generic script and you want a different configuration whether you're trading FOREX or Crypto .
I designed a dummy example in that script that will preset the inputs according to the asset type from the chart.
Here I want 12/26/9 for forex and 20/50/50 for crypto - 30/60/90 otherwise
Quick caveat
It seems that for any crypto asset, syminfo.type returns "bitcoin". TradingView will fix it at some point but wanted to give you the heads-up regardless
Enjoy and all the BEST ^^
--
Dave
Kripto

BEAM BandsBEAM Bands is a version of the BEAM indicator that is drawn directly on the price chart. It is a more visual representation of BEAM and lets you compare it directly to the price.
Disclaimer: This is not financial advice. For educational purposes only.
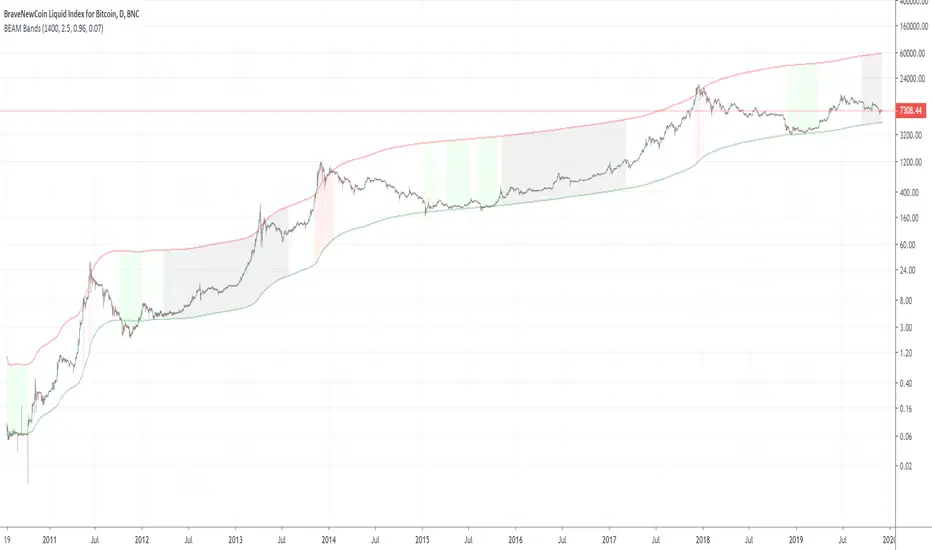
BEAMThe BEAM indicator helps identifying promising times during a cycle for buying and selling Bitcoin or other crypto currencies. It can also be used with gold or silver after adjusting its parameters, but does not work very well with stocks.
Disclaimer: This is not financial advice. For educational purposes only.

MesattoTrend v1 - MesattoCapitalWelcome to MesattoTrend v1
How to use it:
1- VWAP(pink line)
BUY Scenario, VWAP will act as your base, it has to be below price to be a valid buy.
SELL Scenario, VWAP will be higher and act as resistance.
2- Support/Resistance lines will give you an idea on where prices
might pullback or increase in volume for a breakout.
3- Supertrend(green/red cross)
Supertrend will act as your Stop point. Use it as reference together with
support/resist lines to set your stoploss/gain
Reminder: Use it at your own risk, an indicator serves to assist you on taking a trade, always look for confimation before trading.
Link to my bottom indicator
comment below if you would like more adjustments.

LIVIDITIUM [BTC] {PREMIUM}The LIVIDITIUM is a set of indicators centered around a series of parallel bands call the LVDT guide bands, defined by lines call the LVDT levels. Major LVDT levels have thicker line-widths.
LVDT levels are constructed from a mathematical conjugation of the complex golden ratio solutions.
>> Useful to determine critical levels, indicates possible support levels, as well as major and minor tops/bottoms.
Look at historical interactions to work out key levels for any particular chart, and adjust the displacement offset value to get the LVDT levels to conform better to a particular chart at a particular time-frame.
Major BUY/SELL indicators for top/bottom levels were added specifically for BTCUSD and optimised for the 1D chart (disabled at lower time-frames). These are based on the interaction of the candlestick with various emas and smas as well as with the LVDT levels.
A scoring algorithm also analyses the significance of major and minor death crosses, base on the presence of other indicators in its vicinity to suggest potential local buy/sell prices, and should still work relatively well at lower time-frames.
Various triggers are also implemented, including golden/death cross indicators, as well as pivot and potential reversal points -- labelled with either text-markers, or colored vertical bands.
Signal markers that are only valid for the BTCUSD chart are automatically disabled when LIVIDITIUM is being used on other charts.
~ * ~ * ~ * ~ * ~ * ~ * ~ * ~ * ~ * ~ * ~ * ~ * ~ * ~ * ~ * ~ * ~ * ~ * ~ * ~ * ~
Note:
In no way is this intended as a financial/investment/trading advice. You are responsible for your own investment/trade decisions.
Please exercise your own judgement for your own trades base on your own risk-aversion level and goals as an investor or a trader. The use of OTHER indicators and analysis in conjunction (tailored to your own style of investing/trading) will help improve confidence of your analysis, for you to determine your own trade decisions.
Please PM me for access information.

CryptoEngineering 🔥Isn’t It Time You Made Your Crypto Portfolio Great Again? 🔥
The falling knives, the heartbreaking crashes, the devastating feeling of watching a missed trade soar all the way to the moon.
The markets aren’t fair, which means you need a tool that gives you an edge. So,It is time to try EngineeringRobo.
The Engineeringrobo is a great ally in a crypto market - when the price moves the algorithm will automatically show Buy and Sell orders when there is a best opportunity to make a profit. It is a just SMART trading system script on TradingView that brings the easiest approach to trading with a high profitability rate.
I created EngineeringRobo to help you on your traders as a robo advisor , It will "not " trade on behalf of you on exchanges via API. It is not an AI robot,It is am ALGO Trading robot. You can use it on any trading markets (BIST, S&P 500,Commodities ,Forex, Crypto ) with any time frame!
My unique algorithm find profitable altcoins based on their Ichimoku, McGinley, MA, RSI, MACD, Stochastic, Volumes and Price Changes gives you BUY and SELL signals. The EngineeringRobo indicator displays two different signals for entry and exit on a coin to maximize its profitability on the chart. The signals can appear at any time during an open candle, but once closed the signal is final and wont change in the future.
One of the biggest advantages of algo trading is removing human emotion from the crypto markets,humans trading are susceptible to emotions that lead to irrational decisions.Robo doesn't have to think or feel good to make a trade. If conditions are met, it enters.When the trade goes the wrong way or hits a profit target, It exits. It doesn't get angry at the market or feel invincible after making a few good trades. The two emotions that lead to poor decisions that algo traders aren't susceptible to are fear,and greed.
That's why It makes money but most of you not!
What Are the Advantages of using it as a ROBO Advisor?
🔴Reduce your required screen-time
🔴Reduce anxiety over missing setups when you are busy
🔴Turn existing indicators into alerts (eg. Whenever RSI goes overbought)
🔴Find comfort in knowing that you have me on your side
To get the maximized results from @EngineeringRobo
Open tradingview
Decide the coin/BTC
Pick 1M
Draw the Support & Resistance lines
Change the 1W
Draw the lines - Support & Resistance
Find out Chart Patterns
Change to 3D/1D / 3H
Check Robo' signals
Set your orders
Enjoy your profits💰
***Even the best automated day trading software can trigger false trends.
In August 2012 by Knight Capital group;who lost over $440 million in just half an hour when their trading software went rogue in response to market conditions. That's why it is a Robo advisor not trading bot! Engineeringrobo is not a get-rich-quick scheme as well!
Disclaimer
Information on EngineeringRobo should not be seen as a recommendation to trade BIST, S&P 500,Commodities ,Forex, Crypto.
EngineeringRobo is not licensed nor authorized to provide advice on investing and related matters.
Information on the page is not, nor should it be seen as investment advice.Any trading decisions that you make are solely your responsibility. Clients without sufficient knowledge should seek individual advice from an authorized source.
Crypto and Forex trading entails significant risks and there is a chance that clients lose all of their invested money. Past performance is not a guarantee of future returns. Before trading with any of the Algos, clients should make sure they understand the risks.
EngineeringRobo nor its agents or partners are not registered and do not provide any services on the US territory.
***I have been trading since 2016 . Got my first bitcoin in 2013

Cyatophilum Ultimate Trading Bot [ALERTSETUP]Private Indicator.
This is an indicator for trading low timeframes . It is generic and configurable meaning you can use it not only on crypto, but also forex, CFD, stocks etc.
HOW IT WORKS
The user chooses between three powerful base strategies: Bollinger Bands + Stoch RSI, RSI Divergences or the SARMA Strategy .
He can also trade support and resistance breakouts , with or without the base strategy.
Use the Alert Setup version to trigger entry and exit alerts .
You can choose between a set of trend lines that will filter trades that are against the main trend in order to increase profitability.
The integrated Trailing Stop Loss will trigger an alert to exit the trade.
You can use the Trailing Take Profit with a configurable % deviation. It will also trigger an exit alert.
SAMPLE USE CASES
XBTUSD 5m BitMEX
XBTUSD 15m BitMEX
ETHUSD 5m BitMEX
ETHUSD 15m BitMEX
USD/WTI 1m IDC (Us Dollar/ WTI Crude OIL)
Backtest below for BITMEX:LTCZ19 in 15m timeframe.
Note: This is the Alert version. You can find the backtest version in my profile.
To get access to the indicator, use the link below, thanks for reading!

Total Trend Follow Study with Alerts, Pyramid and DCA
Introduction
This is the study version of my trend following strategy. It is designed to be a “drop in” replacement for its twin strategy. I have replicated the analysis logic and entry and exit procedures to produce a nearly identical result set to the strategy. Other than the properties tab, the inputs dialog is exactly the same. Backtest the strategy to determine the best inputs to trade. Then apply the same inputs to this study to forward test. Alerts are available for trade entry, take profit close, stop-loss exit and pyramid level. Please see the strategy version for a complete description of the trading behavior of this script.
In brief, this script is intended to benefit from long duration trending markets. The trading behavior is to buy on strength and sell on weakness. As such the trade orders maintain its directional bias according to price pressure. What you will see on the chart is long positions on the left side of the mountain and short on the right. Long and short positions are not intermingled as long as there exists a detectable trend. My trend following script uses the same pivot point calculations used by my range trader but this time rising pivots are long and falling pivots are short. I refer to pivots as a vertex in the inputs dialog box. The cone based measurement adds a peak, sides and a base to the calculation elements. This allows the inputs to focus on adjusting the location of trades and not just trend lines. The pivot points can be plotted on the backtest. You can use the vertex input values to move the pivots where you want trades to be. This script can be traded in four different modes: Long, Short, BiDir, and Flip Flop.
This script replicates the TradingView pyramid feature by adding a field to the inputs tab. Pyramiding works the same way in this script as its twin strategy. Each pyramid level increases the order size as a multiple of its level. This makes it easy to comply with NFA FIFO Rule 2-43(b) if the trades are executed here in America. The current pyramid level is reported in the summary label when reports are enabled. You can use this value to manually adjust the position size in your forward testing. I also expose an alert when the pyramid threshold is breached. Use the TradingView alert window to send yourself a message when the level increases.
In addition to pyramiding this script employs a DCA feature which can increase the order size in response to stopped out or winning streak trades. The number of losing trades is tracked through the “Debt Sequence” value displayed in the summary report. When the debt is recovered the sequence number resets to zero. You can use the “Debt Sequence” number to manually manage DCA on your forward test. The main difference between DCA and pyramids is that this implementation of DCA applies to new trades while pyramids affect open positions. If DCA is enabled be sure to set the limiter to prevent your account from depleting capital during runaway markets.
I also have a range trading version of this script for those not interested in trend following.
Design
This script is approximately 1800 lines of Pine 4 code and implements nine indicators on two time frames. The chart (primary) interval and one higher time frame which is based on the primary. The higher time frame identifies the trend for which the primary will trade. The original trading algorithms are a port from a much larger program on another trading platform. I've converted some of the statistical functions to use standard indicators available on TradingView. The setups make heavy use of the Hull Moving Average in conjunction with EMAs that form the Bill Williams Alligator as described in his book “New Trading Dimensions” Chapter 3. Lag between the Hull and the EMAs form the basis of the entry and exit points. The alligator itself is used to identify the trend main body.
Indicator Repainting
Indicator repainting is an industry wide problem which mainly occurs when you mix backtest data with real-time data. It doesn't matter which platform you use some form of this condition will manifest itself on your chart over time. The TradingView wiki has an in depth article on this subject in regard to the elements of the Pine language which contribute or are susceptible to this effect. In dealing with this problem from a prevention aspect in Pine, you have to accept some repaint to occur.
The goal of my repaint prevention in the study script is simply to ensure that my signal trading bias remains consistent between the strategy, study and broker. This actually turned out to be kind of a job since it interfered with another project goal to synchronize the entry and exits between the strategy and study scripts. The script execution engines are different between the Pine strategy and study. While the primary chart interval is quite manageable the higher time frame requires the security() function. TradingViewʼs higher time frame implementation, which interleaves the chart interval, combined with the critical “lookahead” parameter makes the solution necessarily complex. According the wiki regarding this issue, best practice comes down to the following two methods:
1. a = security(syminfo.tickerid, 'D', close , lookahead=barmerge.lookahead_on)
2. indexHighTF = barstate.isrealtime ? 1 : 0
indexCurrTF = barstate.isrealtime ? 0 : 1
a0 = security(syminfo.tickerid, 'D', close ,lookahead=barmerge.lookahead_off)
a = a0
This script employs method 2 with the only problem being the Pine sar() function which does not expose its internal bar series. The best work around would require hand coding the parabolic but the script is at the maximum local scopes and run-time duration so that option is not viable. So far, this hasn't proven to be much of a problem. I'm currently running several symbols, forex and crypto, the strategy and study remain highly correlated with no instances of completely opposite real-time signals. However, I have received some alerts with no corresponding plot on the chart but so far it only occurred on one symbol. I will continue to monitor this problem.
The Bottom Line. Does this script repaint. Yes, it will repaint about as much as every other multi-interval script which employs the best practice solutions available in the Pine Language.
Usage
Please be aware that the purpose of the study script is to perform forward testing of the configuration established in the backtest process. Therefore, the usage here in the study begins with the backtest configuration parameters. The following steps provide instructions to get this study script connected to the TradingView alert notification system. For a detailed description of how to create a trend following system using this script please see the strategy version.
Step 1. Create a chart with the trading instrument and interval used in the backtest.
Step 2. Find this script in the “Invite Only” section of the Indicators Dialog and apply it to the current chart.
Step 3. Copy the values from the backtest input dialog to the study.
Step 4. Open the TradingView Alert window.
Step 5. In the “Condition” drop down field find and select the name of the script.
Step 6. A new drop down field will appear with the alerts available in the script. This script exposes the following eight signals:
-- Long Entry Signal
-- Long Profit Signal
-- Long Stop-loss Signal
-- Long Pyramid
-- Short Entry Signal
-- Short Profit Signal
-- Short Stop-loss Signal
-- Short Pyramid
Select the signal for which you want notification.
Step 7. In the “Options” field select the frequency of the alert. Typically, "Once Per Bar" or "Once Per Bar Close" will be sufficient.
Step 8. Set the expiration date and time.
Step 9. Select the action of the alert. Currently TradingView offers six different actions:
-- Notify on App
-- Show Popup
-- Send Email
-- Webhook URL
-- Play Sound
-- Send Email to SMS
Step 10. Create a message to to transmitted with the alert. The script provides a default message which can be overridden with any custom description. The price, time and other reserved chart elements can be included in the message
Step 11. Click the “Create” button to generate this single alert.
Step 12. Repeat steps 1 through 11 for every signal you wish to receive.
This script is open for beta testing. After successful beta test it will become a commercial application available by subscription only. I’ve invested quite a lot of time and effort into making this the best possible signal generator for all of the instruments I intend to trade. I certainly welcome any suggestions for improvements. Thank you all in advance.

FS position sizethis is position sizing indicator base on Justin wise and his team on crackingcryptocurrency idea
so all credit goes to them
you can put your capital and risk amount that you tend to put on risk in a trade and it will measure your position size base on USD and BTC and it will measure your Take profits base on ATR which are editable.

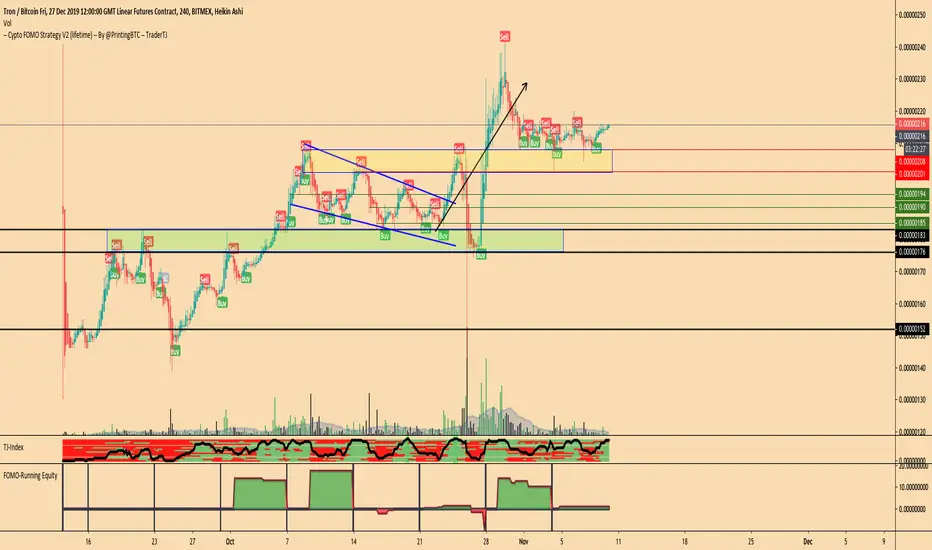
FOMO-Running EquityThis is a backtested for the running equity of my Crypto FOMO Strategy.
It shows you the performance of each trade, shows you periodical equity, resets the equity after each period to 0, shows histograms after each trade.
This is an easy visual tool following Gainzys style to see how the algorithm performed previously and which settings might be the most or more profitable ones in the near future.
Best regards, TJ
Full Range Trading Study with Alerts and DCA
Introduction
This is the study version of my range trading strategy. It is designed to be a “drop in” replacement for its twin strategy. I have replicated the analysis logic and entry and exit procedures to produce a nearly identical result set to the strategy. Other than the properties tab, the inputs dialog is exactly the same. Backtest the strategy to determine the best inputs to trade. Then apply the same inputs to this study to forward test. Alerts are available for trade entry, take profit close and stop-loss exit. Please see the strategy version for a complete description of the trading behavior of this script.
In brief, this script is intended to benefit from a range bound market. The trading behavior is to buy on weakness and sell on strength. As such trade orders are placed in a counter direction to price pressure. What you will see on the chart is a short position on peaks and a long position on valleys. This is accomplished by calculating pivot points from the price stream. Rising pivots are shorts and falling pivots are longs. I refer to pivots as a vertex in the inputs dialog box. The cone based measurement adds a peak, sides and a base to the calculation elements. This allows the inputs to focus on adjusting the location of trades and not just trend lines. The pivot points can be plotted on the backtest. You can use the vertex input values to move the pivots where you want trades to be. This script can be traded in four different modes: Long, Short, BiDir, and Ping Pong. When trading in “Ping Pong” mode long and short positions are intermingled continuously as long as there exists a detectable vertex. I also have a trend following version of this script for those not interested in trading the range.
This script employs a DCA feature which enables users to experiment with loss recovery techniques in the backtest. Here in the study the summary report displays the “Debt Sequence” number which can be used to manually increase the order size on subsequent trades at the broker. The script keeps track of debt incurred from losing trades. When the debt is recovered the “Debt Sequence” resets to zero so orders can return to the base size. Be sure to set the limiter to prevent your account from depleting capital during runaway markets.
Consecutive loss limit can be set to report a breach of the threshold value. Every stop hit beyond this limit will be reported on a version 4 label above the bar where the stop is hit. Use the consecutive loss limit to manually halt live trading on the broker side.
Design
This script uses twelve indicators on a single time frame and is approximately 1800 lines of Pine 4 code. The original trading algorithms are a port from a much larger program on another trading platform. I’ve converted some of the statistical functions to use standard indicators available on TradingView. The setups make heavy use of the Hull Moving Average in conjunction with EMAs that form the Bill Williams Alligator as described in his book “New Trading Dimensions” Chapter 3. Lag between the Hull and the EMAs form the basis of the entry and exit points. The vertices are calculated using one of five featured indicators: Volume, Histogram, Fractal, Candle and Macro. The backtest is used to determine the best fit for your desired trading instrument. The incorporation of five distinct pivot point calculations broadens the scope of the markets where this tool can be beneficial.
Example configurations for various instruments along with a detailed PDF user manual is available.
Indicator Repainting
Please see the strategy script for a more detailed description of the repaint problem. The goal of my repaint prevention in the study script is simply to ensure that my signal trading bias remains consistent between the strategy, study and broker. This script employs the following conventions in effort to avoid indicator repainting:
1. This script uses only 1 time frame. The chart interval.
2. Every entry and exit condition is evaluated on closed bars only.
3. Entry and exit plots are not triggered off trend line crossovers.
4. No security functions are called to avoid a look-ahead possibility.
5. Every contributing factor specified in the TradingView wiki regarding this issue has been addressed. Except the use of the exponential moving average which is essential to my strategy.
6. I’ve run a 10 minute chart live for a week and compared it to the same chart periodically reloaded. The two charts were highly correlated with no instances of completely opposite real-time signals
This script does indeed bring up the TradingView warning dialog. The only reason for this is due to “peculiarities of the algorithm” regarding the EMA as stated in the wiki article.
The Bottom Line. Does this script repaint. Yes, it will repaint about as much as every other trading platform which combines backtest data with real time prices in a live trading scenario.
Usage
Please be aware that the purpose of the study script is to perform forward testing of the configuration established in the backtest process. Therefore, the usage here in the study begins with the backtest configuration parameters. The following steps provide instructions to get this study script connected to the TradingView alert notification system. For a detailed description of how to create a range trading system using this script please see the strategy version.
Step 1. Create a chart with the trading instrument and interval used in the backtest.
Step 2. Find this script in the “Invite Only” section of the Indicators Dialog and apply it to the current chart.
Step 3. Copy the values from the backtest input dialog to the study.
Step 4. Open the TradingView Alert window.
Step 5. In the “Condition” drop down field find and select the name of the script.
Step 6. A new drop down field will appear with the alerts available in the script. This script exposes the following six signals:
Long Entry Signal
Long Profit Signal
Long Stop-loss Signal
Short Entry Signal
Short Profit Signal
Short Stop-loss Signal
Select the signal for which you want notification.
Step 7. In the “Options” field select the frequency of the alert. Typically, "Once Per Bar" or "Once Per Bar Close" will be sufficient.
Step 8. Set the expiration date and time.
Step 9. Select the action of the alert. Currently TradingView offers six different actions:
Notify on App
Show Popup
Send Email
Webhook URL
Play Sound
Send Email to SMS
Step 10. Create a message to to transmitted with the alert. The script provides a default message which can be overridden with any custom description. The price, time and other reserved chart elements can be included in the message
Step 11. Click the “Create” button to generate this single alert.
Step 12. Repeat steps 1 through 11 for every signal you wish to receive.
This script is open for beta testing. After successful beta test it will become a commercial application available by subscription only. I’ve invested quite a lot of time and effort into making this the best possible signal generator for all of the instruments I intend to trade. I certainly welcome any suggestions for improvements. Thank you all in advance.

Algorithm Builder CRYPTO (m5)Hello traders 👋
I. 💎 SCRIPTS ACCESS AND TRIALS 💎
1. Every 3 weeks trial request access has to be done through my website .
2. My website URL is in this script signature at the very bottom (you'll have to scroll down a bit and going past the long description) and in my profile status available here : Daveatt
3. Many video tutorials explaining clearly how all our indicators work are available on your website > guides section.
4. You may also contact me directly for more information regarding the trading method included in the indicator or how to access it
2.1 Forewords
This indicator is for the Intraday CRYPTO traders looking for fixed entries based on a trading method designed by 2 experienced traders.
It's a variation of our Algorithm Builder with a custom method for 5-minutes chart trading - can be coupled with the UNIVERSAL Algo Builder also,
We designed this framework for CRYPTO/USD and CRYPTO/CRYPTO pairing (ex: LTC/BTC, XRP/ETH, ...).
Made for crypto with enough trading volume (big and mid-caps)
ETH/BTC
XRP/ETH
EOS/USD
The tool works in m5 timeframe but won't work with any other timeframe . Even if applied on a 5-minutes chart; we included higher timeframe indicators to enter more securely.
It includes :
- our proprietary method with fixed entries
- a hard exit system (built-in stop-loss)
- 🔔 Compatible with dynamic alerts 🔔
Dynamic alerts are bringing automated trading to a whole new level. The third-party solutions capturing TradingView alerts are able to use them.
- (optional) we let the users decide to use or not our built-in Trade Manager.
Regardless of the Trade Manager is used or not, one must mandatory exit, once a vertical hard exit bar appears.
- the Algorithmic Supports and Resistances used as safeguards and take profit zones.
Final words
We made it as simple as we could (to be honest it's a very simple system for the end-user) - even with several hundreds of calculations in the indicator.
Please hit me up for any question/feedback/comment
Become the BEST trader that you deserve to be
Dave

Algorithm Builder UNIVERSAL (m30)Hello traders 👋
I. 💎 SCRIPTS ACCESS AND TRIALS 💎
1. Every 3 weeks trial request access has to be done through my website .
2. My website URL is in this script signature at the very bottom (you'll have to scroll down a bit and going past the long description) and in my profile status available here : Daveatt
3. Many video tutorials explaining clearly how all our indicators work are available on your website > guides section.
4. You may also contact me directly for more information regarding the trading method included in the indicator or how to access it
2.1 Forewords
This indicator/trading framework is available only to our PREMIUM users.
We decided to call it "UNIVERSAL" because the tool gives very decent signals for STOCKS/PENNY STOCKS/FOREX/CRYPTO (USD & BTC pairing)/INDICES/COMMODITIES trading
(the asset classes that I'm not listing are not tested yet; though we should cover a wide range of tradable assets here)
This is a by-product of defining an algorithmic trading method... we were surprised ourselves those past few weeks while trading with it.
The entries displayed are most of the time amazing, and the invalidations allow to reduce the losses considerably (more wins and less losses => delighted trader)
A few examples below showing why it's "universal"
FOREX
INDICES
COMMODITIES
CRYPTO (BTC pairing)
The tool works in m30 timeframe but won't work with any other timeframe . Even if applied on a 30-minutes chart; we included higher timeframe indicators to enter more securely.
It includes :
- our proprietary method with fixed entries
- a hard exit system (built-in stop-loss)
- 🔔 Compatible with dynamic alerts 🔔
Dynamic alerts are bringing automated trading to a whole new level. The third-party solutions capturing TradingView alerts are able to use them.
- (optional) we let the users decide to use or not our built-in Trade Manager.
Regardless of the Trade Manager is used or not, one must mandatory exit, once a vertical hard exit bar appears.
- the Algorithmic Supports and Resistances used as safeguards and take profit zones.
Final words
We made it as simple as we could (to be honest it's a very simple system for the end-user) - even with several hundreds of calculations in the indicator.
Please hit me up for any question/feedback/comment
Become the BEST trader that you can be
Dave

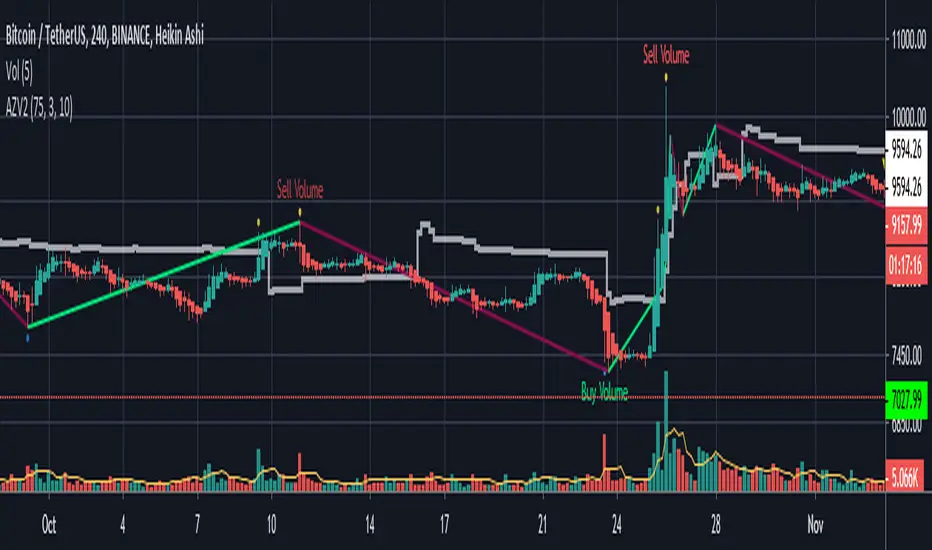
AZV Indicator
AVZ
Market is changing by 4 Factors which are (PVTTI - Price - Volume - Trades - Time
This indicator is a hybrid, with a combination of leading indicators and lagging trending indicators combined into one,and it's using mostly the 3 factors_ PVT which will help you getting good trades .
Volume :-
Leading indicators such as Volume Spikes , Average Volume Spikes (VolMA) ,and a special Spike calculation using RSI as a function with volume as a source .
Price:-
SemiLead indicators such as Aroon Indicator , RSI .
Time and Price Combination :-
Trend Recognition using Harmonic and Zigzag implementation from 'RicardoSantos' .
.
www.investopedia.com
Volatility Recognition : Using a special calculation to get the average called ( ZScore ) with Vwap implementation .
en.wikipedia.org
www.investopedia.com
How to use ?
This indicator is using number of bars of the last wave whatever if it's UP wave or Down wave .
Type number of bars on the specified area of the wave ( Bars Of Wave )
How many NO. Bar s to get accurate levels ?
1- If you are searching for a Support level , you have to count the number of bars of last UP wave from its low to it's high .
2- If you are searching for a Resistant level , you have to count the number of bars of last Down wave from its high to its low .
Buying Signal and Selling Signal ?
The indicator tries to identify levels that Buying Volume enter in the same way for Selling Volume .
L&S PROFIT SCALP Indicator for scalp trades for TF 1-15 minutes. 1-4 signals per day depending on the currency pair. Suitable for all crypto exchanges, Forex, binary options. Signals+ take profit Levels.

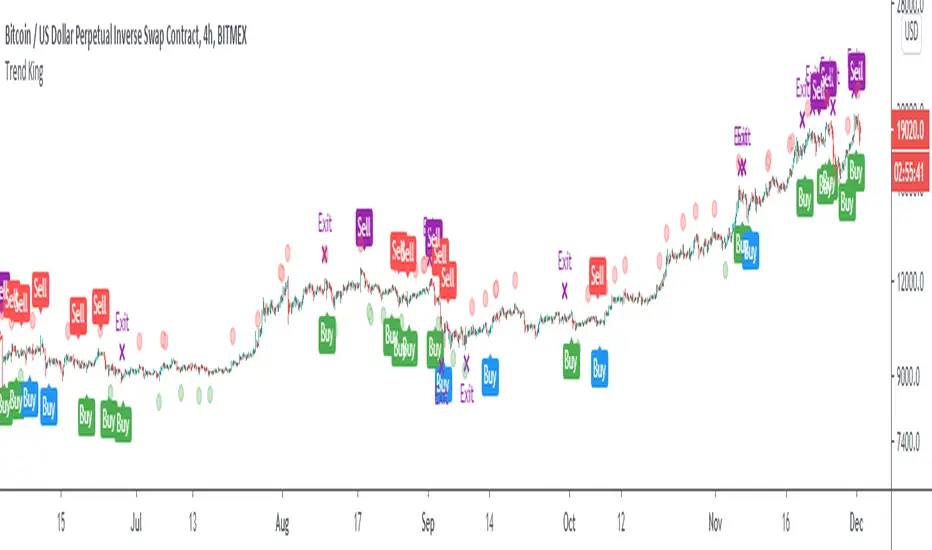
Trend KingIntroducing “Trend King”.
The alpha generating strategy built for Crypto.
“Trend King” combines 4 proprietary indicators. It buys and sells based on:
Short-term momentum
Long-term momentum
Volume compression
Volatility breakouts
The strategy was built on 2 years of BitMEX data (XBTUSD) and backtested on 9 years of Bitcoin data (BLX). Finally, the strategy was validated on multiple large market cap cryptocurrencies, including Ethereum (ETHUSD), without parameter adjustment.
Strategy backtesting checks include:
Used 0.12% fees. 60% more than the actual BitMex/Binance fees of 0.075%.
No Heikin-Ashi Candles (to avoid fake results)
No Stop-losses (to avoid fake order execution)
Market Orders Only (to avoid fake order execution)
The results speak for them self.
See the positive excess return from the “Trend King” strategy returns versus a simple Bitcoin “Buy-and-Hold” strategy. Best functionality on the Daily and 4HR timeframes.
**For Access: Contact me on TradingView or Twitter.
Volume ComparisonThis script shows the volume of the current chart relative to the volume of another selected ticker.
For meaningful information you should compare coins with the same base pair (for example BTCUSD against LTCUSD).
Volume bars will be plotted green if the other security's volume is higher, red otherwise.
You may use this script go generate alerts and automate your trading with a bot such as WolfBot.org

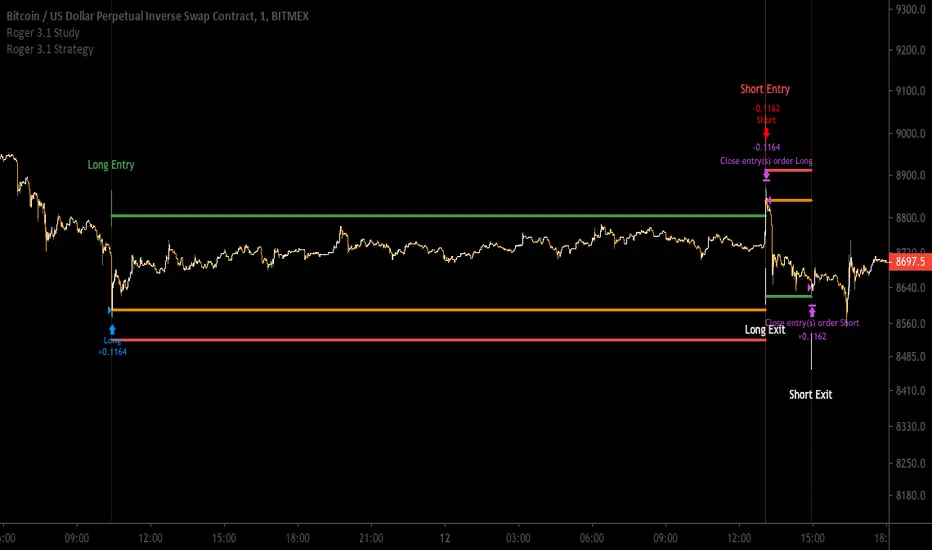
[Aill3urs V.1.1.P] Study RogerThis INVIT-ONLY study is based on Noise / Fixe TP & SL / EMA and you can optimize it with trends and work on low timeframe < 5min
Please use comment section for any feedback.
For any question DM me for any request.
## DISCLAIMER
1. I am not licensed financial advisors or broker dealers. I do not tell you when or what to buy or sell. I developed this software which enables you execute manual or automated trades multiple trades using TradingView. The software allows you to set the criteria you want for entering and exiting trades.
2. Do not trade with money you cannot afford to lose.
3. I do not guarantee consistent profits or that anyone can make money with no effort. And I am not selling the holy grail.
4. Every system can have winning and losing streaks.
5. Money management plays a large role in the results of your trading. For example: lot size, account size, broker leverage, and broker margin call rules all have an effect on results. Also, your Take Profit and Stop Loss settings for individual pair trades and for overall account equity have a major impact on results. If you are new to trading and do not understand these items, then I recommend you seek education materials to further your knowledge.
**YOU NEED TO FIND AND USE THE TRADING SYSTEM THAT WORKS BEST FOR YOU AND YOUR TRADING TOLERANCE.**
**I HAVE PROVIDED NOTHING MORE THAN A TOOL WITH OPTIONS FOR YOU TO TRADE WITH THIS PROGRAM ON TRADINGVIEW.**
Multi MA MTFMulti MA MTF
The moving averages are generally used as dynamic supports and resistances as well as to determine the trend,
so if the price is above its average it is called an uptrend and otherwise a downtrend.
The crossing of MA if used to confirm a trend and not as a signal
because the moving averages react slowly depending on the type of MA and the periods we are analyzing.
Indicator Functions:
- It allows to display 4 MA at the same time.
- You can use several types of moving averages: SMA, EMA, DEMA, WMA, VWMA, HullMA, TMA, SSMA, SMMA.
- Shows the crossing points of the MA's.
- Multimeframe: so you can visualize the behavior of MA's in different timeframes without changing timeframe.
- Alerts for when crosses occur.
Same chart with 1 week timeframe MA enable

OracleWhere to use?
Oracle gives the best performance on ETH/USD but also works for BTC/USD and some other charts like XAU/USD ( Gold ). Fails for almost all other cryptocurrencies.
Use 1d or 4h time frames only. 2h and 3h also work in some cases. Use Heikin Ashi candles for the best results.
The strategy is still being tested. Use at your own risk.
How to use?
Arrows start pointing upwards and candle closes above the Orange line - Price is likely to go up
Arrows start pointing downwards and candle closes below the Orange line - Price is likely to go down
Also, the orange line can be used as a mental stop loss point.

Position Size Calculator - GBHow-To:
- Add the script to your Favourite Scripts and add it in your chart.
- Choose between black or white background.
- Change the X, Y Axis coordinates in order to make the panel fit in your chart.
- Check the Real Time Updates box if you want real time updates on the position size and account balance input in BTC. Uncheck the box for manual account balance input in USD.
- Entry Price & Stop Loss Prices are in USD.
- % Account Risk is the percentage of your account balance you're are willing to lose if you get stopped out.
- Voila! The script prints out the amount of contracts for your positions.
Version 1.01:
- Used mostly for crypto.
- Next versions will have fees & slippage added in the calculation formula.
- Let me know if you find any bugs and if you have any suggestions.

Triple RSI - by cryptotradingresource.com -This simple combination of 3 different RSI can help you to find a good entry or exit point.
Default RSI's are: 5, 13, 50. You can simple change them on values you like to use more.
For buy the background color will change into green and for sell, red. Play around and find the best settings that fits your trading setup.
Check out also my other indicators.
Happy trading
+++ use this tool on your own risk. i'm not responsible for your loses +++

Stochastic RSIStochastic RSI
It is generally used to generate signals when crossings are made in overbought or oversold areas,
but it is important to take advantage of these signals according to the general trend, in this way we avoid false signals.
Overbought doesn't necessarily mean the price will reverse lower, just like oversold doesn't mean the price will reverse higher.
Rather the overbought and oversold conditions simply alert traders that the RSI is near the extremes of its recent readings.
So the main idea will be to use the signals as long as we are trending in the same direction,
the other crosses will be used as signals to take profits or as warning signs to check our trades.
Extra functions in this indicator:
- Trend background.
- Long and Short Labels base on trend and take profit warnings.
- Alerts for long and short entries and take profit warnings.
Take Profit / Warning Labels enable (Orange)
