BTC Precognition - Mtrl_Scientist (study version)Hey everyone!
This is the study version of the improved 'BTC - Precognition' algorithm, meaning you'll only see the indicator and not have 'longs/shorts' painted on your chart.
- Works better with normal candles now, as internal calculations are forced to be done on Heikin Ashi, regardless of chosen candle format
- Turned into a study, rather than strategy, as not to interfere with strategies that are already in place
- Added Overbought/Oversold conditions (orange) with adjustable threshold, based on normalized price action helper indicator
Reminder: Only for use with BTCUSD, as it draws data from specific exchanges!
I will also add these changes to the strategy version.
Please let me know what you would like to see improved!
Kripto

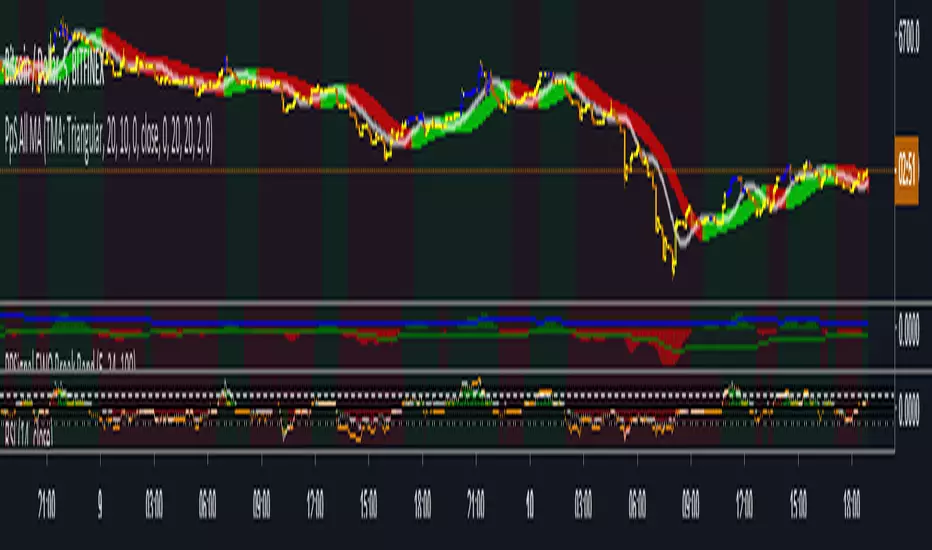
PpSignal ALL MOve Average 1.0Different moving average, Kaufman Adaptive Moving Average, Wilder's Moving Average, Triangular Moving Average , ZLEMA, EMA, SMA , HULL, ALMA, TEMA, ETC. -
BITFINEX:BTCUSD
Renkonator 5000 [IND]Renko scalping indicator based off Vdub Renko SniperVX1 v1. Major addition is requiring confluence of MACD signal for opening position + alerts for entering long/short positions.
Important: use Traditional setting with Renko. Box Size and timeframe are the two most important settings to optimize for.
Suggestions:
Pair Box Size Timeframe
EURCAD 0.0001 240m
BTCUSD 1 240m
ETHUSD 0.1-1.0 240m

FOMO DRIVEN SUPERCLOUDSFomo Driven Developments Super Clouds
Works well with FDD Super Candles Indicator.
For access please go to www.fomodd.io.
Twitter = Telegram = @dgnsrekt
FOMO DRIVEN DEVELOPMENT

FOMO DRIVEN SUPERCANDLESIchimoku base candle coloring system
Works well with FDD Cloud Indicator.
For access please go to www.fomodd.io.
Twitter = Telegram = @dgnsrekt
FOMO DRIVEN DEVELOPMENT


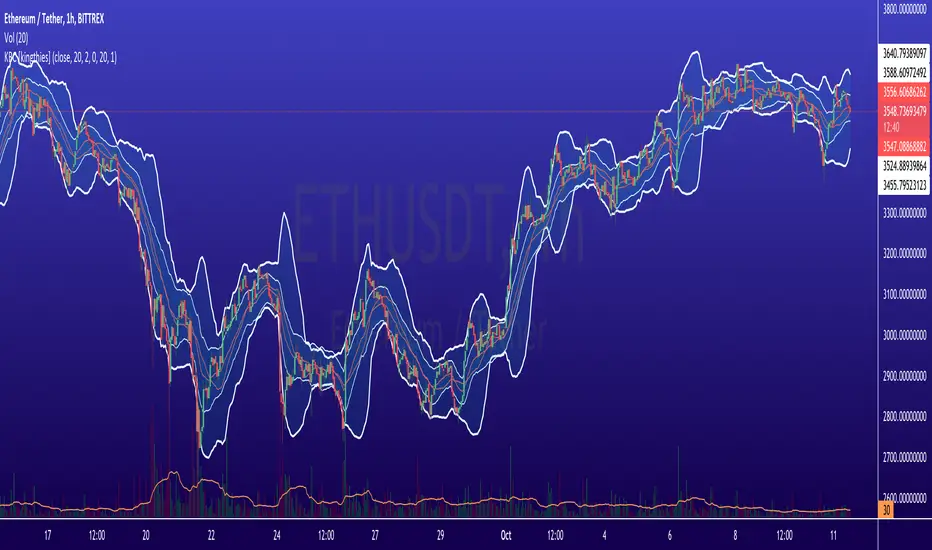
Renko CandlesticksRenko charts are awesome . They reduce noise by only painting a brick on the chart when price moves by a specified amount up/down. When the price reverses, it must go twice the specified amount before a brick is painted. Time is not a factor, just price movement. Sometimes however, you want the pros of a renko chart, but on a regular candlestick chart. This indicator attempts to do just that.
A band is placed around price action showing the upper and lower bounds of what would be the current renko brick. The band only goes up/down when the price action itself moves up/down by the amount you specify. There are several ways of specifying the amount:
Fixed Price Amount: As the name says, you enter the brick size amount, i.e. the amount the price has to move before being in a new brick.
% of Price: This method will calculate the amount the price has to move as a percentage of the price itself. This way as price goes up/down, your brick size will adjust accordingly. Recommended values would be around 1% or less.
% of ATR: This option will make the brick size a percentage of the Average True Range. You can specify the ATR time frame to be different from your current time frame as well as the ATR length. For instance you could be on a 10 minute chart but specify the ATR to be daily with a length of 3 and a percentage amount of 15. This would make your brick size 15% of the Average True Range for the last 3 days. Recommended values are 10 to 20%.
Use this indicator on any time frame, even the 1 minute as the renko bands span the price action the same way on any time frame easily letting you know whether or not the price has moved appreciably, regardless of how much time has passed.
You can also set alerts easily, simply set the alert to crossing and choose “Renko Candlesticks” instead of “Value”. You will then see the options for the renko upper and lower bounds.
Tested on Bitcoin with the following values:
Fixed Price Amount: 30 ($30)
% of Price: 0.45 (if Bitcoin is $7000 then the brick size would be $31.50)
% of ATR: 15%, ATR Time Frame: 1D, ATR Length: 3 (3 days)


MTF StochRSI Grid v2.0 - CryptoProToolsNew version has added the following :
- Custom Time Frames (not limited to TradingViews default resolution selection)
- Optional Medium Strength Signals (Matching 3 x OB or OS instead of the full 4)
- Toggle Highlight Bar Colors ON and OFF
- Signal arrows visible above and below the grid
Original Version Can Be Found Here :
Get Access To This + All of our other current and future indicator releases with a CryptoProTools Lifetime Membership
------------------------------------------------
Other Popular CryptoProTools Releases

Correlated Market Matrix - Correlation Computer - GyromaticalCorrelated Market Matrix - Correlation Computer
Works with up to 7 markets simultaneously to find price divergences.
Study Forex pairs, stocks, crypto alt coins.
Find potential entries quicker.
Short Description:
This indicator analyzes 6 markets and one spread (or 7 and no spread) against the currently loaded instrument,
with support for complex formulas. This indicator finds positive and negative correlations intrabar and throughout
the specified time frame simultaneously. It employs a weighting system and score threshold
(everything is user-definable) and signals upon positive or negative score. Alerts are included
for intrabar and overall positive and negative correlations.
Detailed description:
This indicator analyzes 6 different markets and 1 spread (or 7 different markets if no spread) and
measures correlations between them. The squares on the background are individual
correlations (intrabar) and the circles to the right-hand side depict whether the markets have risen
or fallen in price since the start of the specified time frame (red/green or gray for neutral).
To the right of the circles you have the instrument numbers. The numbers represent the instruments you
have specified, in order. Above these numbers and circles you will find two square icons.
You will notice the left-most icon has the caption of "Overall Score +" (or -) and the right-most icon
has the caption of "Intrabar Score +" (or -). The overall score measures the correlation score from the
start of the time frame to the present time. The intrabar icon measures the correlation score of
individual candles. The scoring system implements weighting which uses scores for each individual instrument
and all scores are user-definable (positive and negative). There is also a threshold level which is user-definable,
if the score reaches or crosses this level it will trigger the aforementioned signal icons.
The analyzation time frame is decided by the user. The Correlated Market Matrix can calculate from a
given date to present (real-time), or between two specified historic dates.
You are able to represent the correlations using the close (price) of the instrument or an EMA (speed is user-adjustable).
The spread has the individual option to use EMA or close (price) separately from the other instruments.
You have the option to assign the weight of any number (0 to 100) to any instrument if the instrument is bullish.
You additionally have the option of subtracting the numbers if it is bearish (-100 to 0).
You may assign both bullish and bearish weights to each instrument at the same time to obtain maximum balance.
If you do not desire custom weighting, simply leave the weights at 1.
The negative vs positive levels are then measured, and whichever score is the strongest determines if the
square icon displays "Overall Score +" or "Overall Score -" (same for Intrabar).
"Score +" means that the score is equal to or greater than the threshold.
"Score -" means that the score is less than the threshold.
Additionally you are provided the option of visualizing the actual correlation lines. This is useful in the sense that
you may view the direction of that particular secondary instrument without actually opening its chart. The color red
implies that the correlation is falling, while green implies it is rising. Please note that due to
limitations you cannot see the actual correlation value of these lines, and also this is an experimental feature so lines
may not always appear appropriately. In testing a line may vanish momentarily here and there but it is somewhat rare.
The background squares will tell you the actual state of the correlation.
HOW DO YOU READ IT?
The numbers represent the instrument you selected in that number slot.
The circles to the left of the numbers indicate if that market is up or down since the beginning of the specified timeframe.
Red means price is down, green means price is up, gray is neutral.
The icon "Intrabar Score +" or "Intrabar Score -" indicates whether the majority of markets are over their score threshold
(negative or positive correlation) for the current candle only.
If this is "Neutral" then there is no current score.
The icon "Overall Score +" or "Overall Score -" indicated the majority of markets are over their score threshold (negative or
positive correlation) for the OVERALL time frame (start to current, or start to finish if you are not using in real-time).
If this is "Neutral" then there is no current score.
For individual candle correlations, if the secondary instrument is up and the main instrument is down, the boxes are red.
If secondary instrument is down and main instrument is up, boxes are green.
If correlation lines are red then the correlation is becoming negative, if they're green then they're becoming positive.
This does not mean there is a negative or positive correlation, only that the correlation is rising or falling.
The background squares will tell you the state of the correlation.
PLEASE NOTE:
If you are using a white or bright colored chart, click the gear icon next to the indicator name.
Select the "Style" tab. The first option "Time frame Background Color" should be adjusted to either
black or white with no transparency (take note of the slider underneath the color squares).
This will make the matrix appear correctly.
INPUT MENU
By clicking the gear icon next to the indicator name, you are presented with a host of options.
The options are as follows, in order of appearance:
- Correlation Length : Amount of bars to look back for the correlation.
- Show Correlation Lines : Chose whether to display the correlation lines or not.
- Use Rising/Falling Colors : Use rising/falling colors for correlation lines instead of unique colors.
- Instrument Source : Chose from 'Price' or process the instrument through EMA instead.
- Price Source : This source works for both "Price" source and the EMA source.
- EMA Speed : Speed of the EMA if 'Instrument Source' is set to 'EMA'.
- Use EMA on Spread 1 : Use EMA on the 'Spread Instrument 1'. If unchecked, close is used by default.
- Use EMA on Spread 2 : Use EMA on the 'Spread Instrument 2'. If unchecked, close is used by default.
- EMA Speed for Spread 1 : Speed of EMA for Spread 1 if EMA is used instead of 'close'.
- EMA Speed for Spread 2 : Speed of EMA for Spread 2 if EMA is used instead of 'close'.
- Disable Spread and use Instrument 1 as correlated market instead : By default, the indicator takes both spread
instruments and calculates the spread between each (instrument1-instrument2=spread). If this feature is enabled, the indicator
will use only the 'Spread Instrument 1' and calculate it in the same manner as the other markets.
This is useful if you do not wish to use a spread and would rather have an extra market.
- Positive Weight of Instrument (1-7/spread) : Positive weight for the instrument.
It is recommended to enter only positive numbers here. If left 0, no weight will be added to the instrument but the indicator will
signal "Score -" if all others are also 0. If left at 1, if more markets are positive than negative, the indicator will present "Score +".
- Negative Weight of Instrument (1-7/spread) : This works in the same way as positive weight except it is recommended you enter
only negative numbers here (example: -1.5, -20). This number is subtracted from the overall score. If left 0, no weight will be
added to the instrument but the indicator will signal "Score -" if all others are also 0. If left at 1, if more markets are negative than positive,
the indicator will present "Score -".
- Threshold for score to be determined : if the weighting score of the instruments is this number or greater then
the square signal icon of + (greater) or - (lesser) is triggered.
- Instrument (1-6) : This is where you select which instruments/securities you wish to analyze. This input also
supports complex formulas, same as you'd enter them on your chart.
- Spread Instrument 1 : Instrument of part 1 of spread calculation
- Spread Instrument 2 : Instrument of part 2 of spread calculation
- From Month/Day/Year/Hour/Minute : Display data beginning at this specified time.
- To Month/Day/Year/Hour/Minute : Stop analyzing data at this specified time. To have it calculate indefinitely
in real-time, then the "To" settings should be left at Month: 12, Day: 31, Year: 2222, Hour: 23, Minute: 59.
STYLE MENU
- Time frame background color : The background color of the viewing area, especially helpful for white charts where colors may become faded.
- Correlation Line (1-7) : Properties for the displayed lines (if enabled). The first two colors are for rising and falling respectively
(if "Use rising/falling colors" is enabled), the last color is the default color of the line. This last color
will also be used for neutral if "rising/falling" is enabled.
- Instrument Label (1-7,Spread) : Properties for the right-hand numbered column, denoting which line is which instrument.
- Separator (1-8) : Solid lines between instruments
- Price Circle (1-7) : Circles between labels and background colors, denoting price rise/fall.
- Score + or - : Score icon above the instrument numbers
- Fill Row (1-6, Spread) : Background colors for the matrix. Default is red and green.
Have an idea? Customized logic is available for this framework.
This is not financial advice and this indicator system does not guarantee or claim to make profit.
The signals and ideas contained within this page and indicator are provided on an as-is basis. Use at your own risk.

Zentrading Trend Follower_v1.1For more information on how to use and how to subscribe please visit
www.zentrading.co
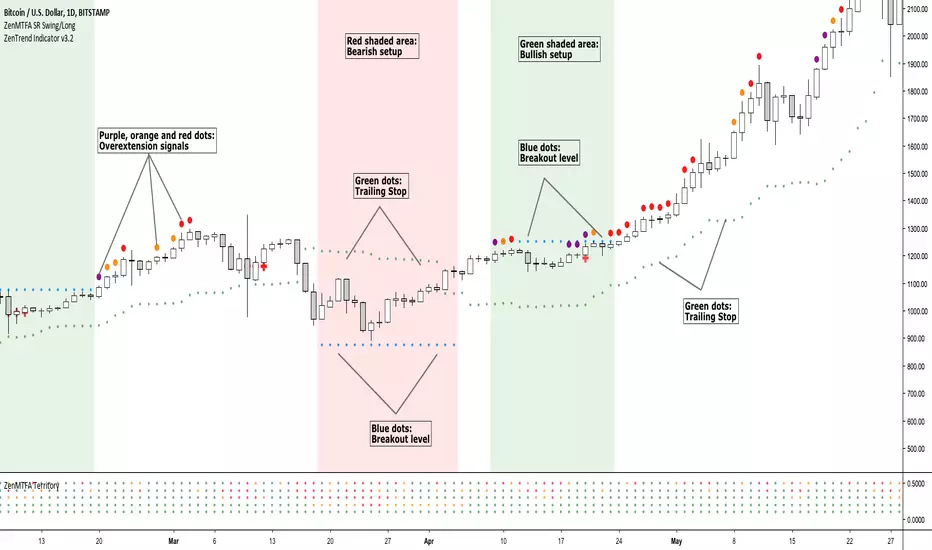
Our ZenTrend Follower is designed to get you into trends in a safe an risk averse manner. It does not only provide you with buy and sell signals forcing you to either react quickly or miss the trade. Rather, our algorithm detects when a trend setup is active and plots a breakout level where you can enter the trade. This also makes it easy for you to scan many assets quickly: All you need to do is see if the indicator has detected a setup, if not, move on!
To ensure that you capture the trend, the indicator indicator shows you where to place your stop loss as the trend progresses. We will also show you a few other simple ways to exit the trades at higher profit levels in the detailed manual you receive after purchasing the indicator.
The shaded areas on the chart indicate that a trade setup has been detected by the algorithm: Green for bullish setups, red for bearish setups. The blue dots are the breakout level, if the price breaks this level the trade is entered. (as you can see on the chart, they can sometimes move towards the price!) Red crosses are plotted as your trailing stop loss, if price breaks the stop loss the trade is closed.

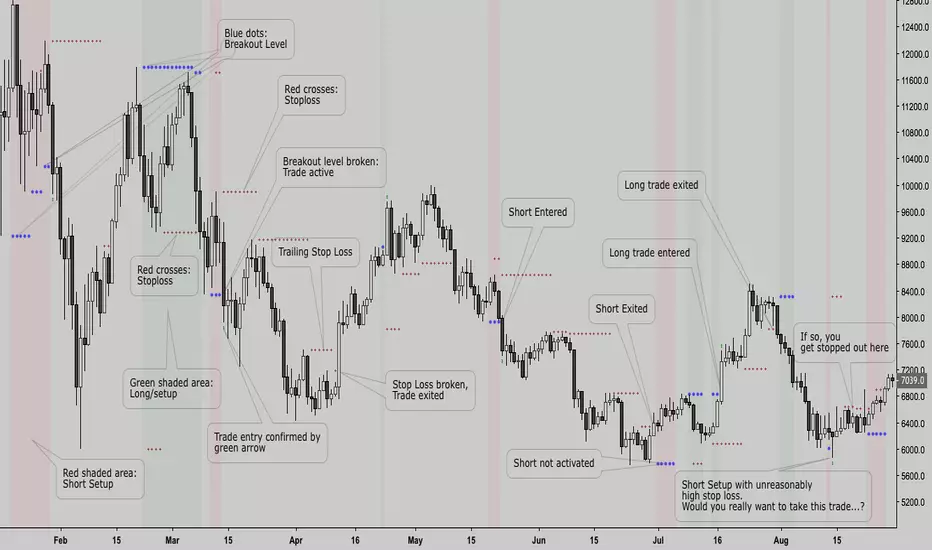
Zentrading Trend FollowerOur Trend following indicator is designed to get you in every trend safely, but perhaps most importantly, keeps you out of bad trades.
It performs well on all assets as it captures trending moves.
It does not only provide you with buy or sell signals you have to react on quickly, rather, it shows you when a trade setup is active. In this way you can anticipate the break of the breakout level to enter the trade. A trailing stop loss is used to exit.
It will work on all timeframes, but as lower timeframes add more noise to the market there will naturally be more losing trades than on higher timeframes. We recommend using it on anywhere from the weekly down to 1 or 2 HR -0.44% timeframes.
It is very simple to use:
The shaded areas on the chart indicate that a trade setup has been detected: Green for bullish setups, red for bearish setups.
The blue dots are plotted as the breakout level, if the price breaks this level the trade is entered. (as you can see on the chart, they can sometimes move towards the price!)
Red crosses are plotted as your trailing stop loss, if price breaks the stop loss the trade is closed.
This is a subscription indicator, please pm for information on how to access.
Happy trading!
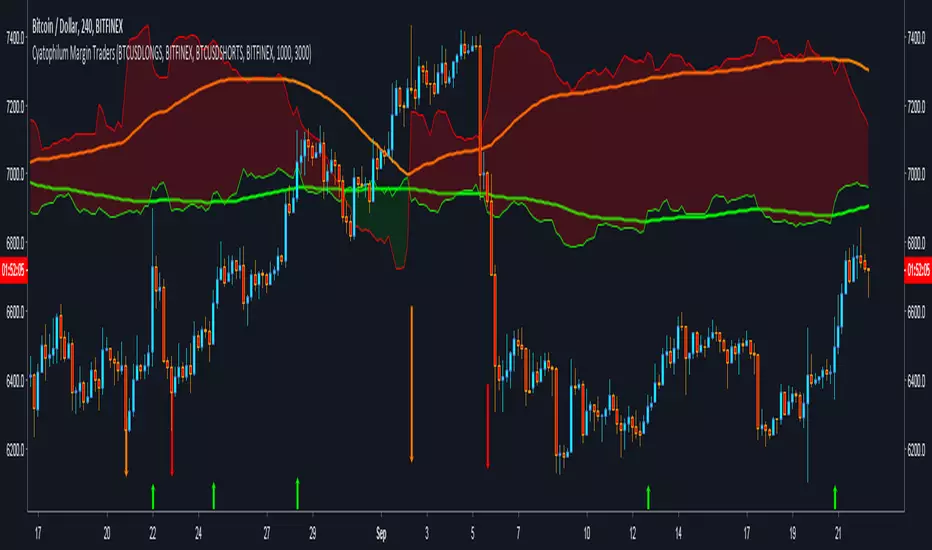
Cyatophilum Margin Traders [INDICATOR] [ALERTSETUP]This is an overlay indicator that you can add on top of the other 4H TimeFrame Indicators. It will help you stay aware of the amount of open longs and shorts trades.
Arrows represent change in shorts and longs. The arrows length is proportional to the change.
Green arrows show up when a huge amount of longs are opened in the last 4H. You can change the precision of arrows in the parameters (see below).
Red arrows show up when a huge amount of longs are closed in the last 4H.
Blue arrows show up when a huge amount of shorts are closed in the last 4H.
Orange arrows show up when a huge amount of shorts are opened in the last 4H.
Purchase the indicator and get more information at blockchainfiesta.com

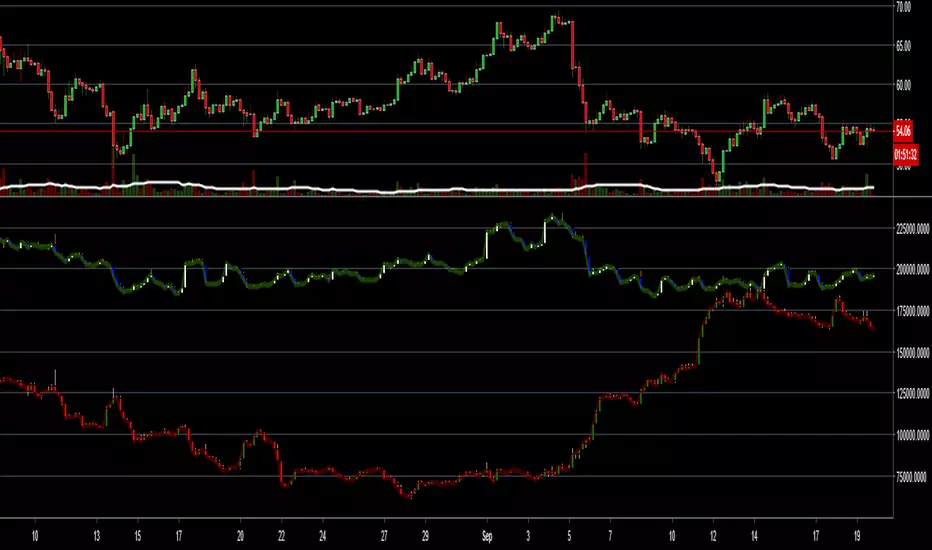
LTC Shorts & Longs (candles) - BitfinexSimilar version of my other scripts - this one is for LTCUSD Shorts and Longs in one indicator including the candles so you can see actual movement as well.
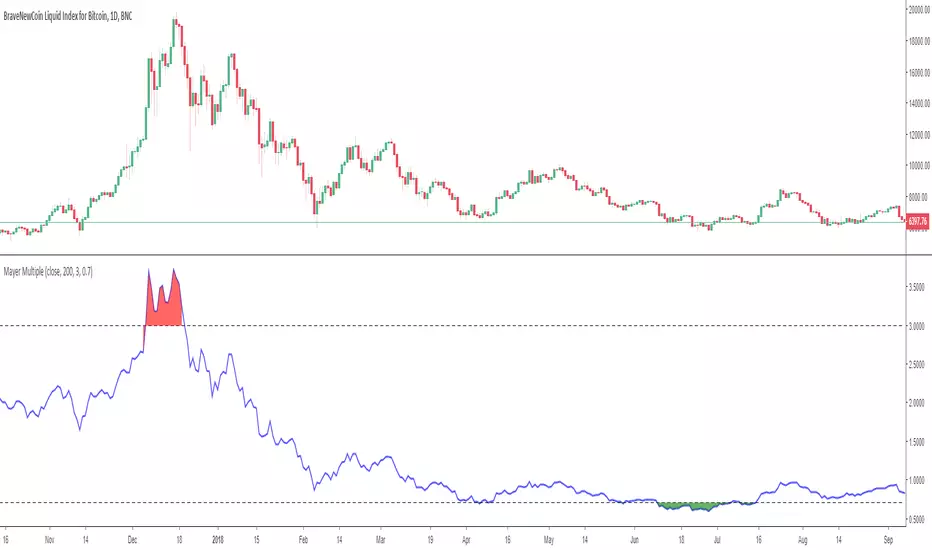
HSS Bitcoin Mayer MultipleIntroducing the Mayer Multiple script…the Mayer Multiple looks over extended periods of time and pinpoints when a cryptocurrency was overbought/sold. The calculation itself is simply the price of the cryptocurrency divided by the 200-day SMA. The default settings are based on Trace Mayer’s recommended numbers but can be adjusted to satisfy your own preferences.
So check it out – I hope you find it useful. As always, this indicator/script should not be taken as trading or financial advice of any kind; it should be used for educational purposes only.
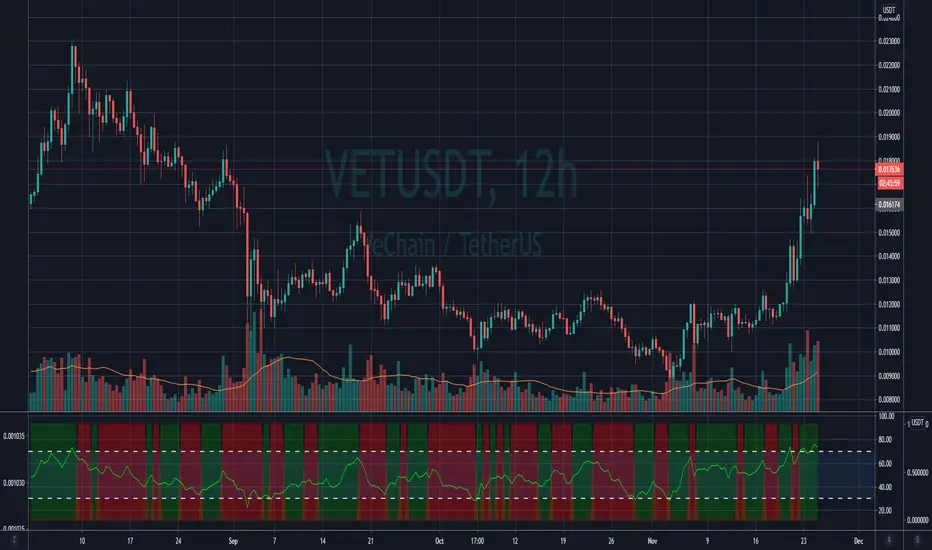
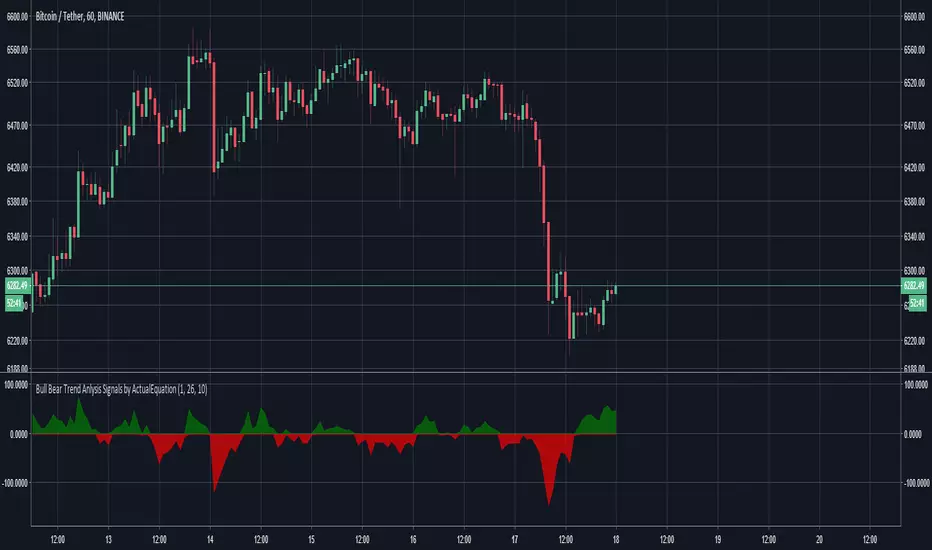
Bull Bear Trend Anlysis Signals by ActualEquationThis indicator analyzes the trend utilizing MACD and other math algorithms to find confirmed entries and exits.
How To Use
Best used on TF larger than 1 hour for highest accuracy.
The higher the wave the stronger the trend.
For entries, wait for the wave to rise then enter after a color flip.
Once flipped, you can look for entries at a smaller time frame to narrow down your buy price.
For shorts, wait for confirmation of color flip with initial red wave down.
BOUNCE PLAYS:
1. Find Divergences via the height of the wave.
2. The more stretched from 0 the stronger the strength.
3. If second drop/rise is less than first, then divergence is present, look for entry.
4. Zoom in to the hourly charts to find initial bounces, then zoom into 5 minutes to look for setups.
NOTE: all signals strength are based off the charts macro strength and most are delayed. If the signal is too high, then it should be the time to close position soon.
Crypto Boston MethodThis is one update to the EMA cross+future triggers
It follows the Travis Swing Method, with the next prices for the EMA crosses, green for the 1st in, blue for the 2nd in, and silver -0.64% for the all in.
Red for the sell price, orange is others (actually the sell price for second in and all in)
Update:
I added the cross price for the next day, it shows what will be the next cross price for Sell (red cross), green for 1st in (green cross), blue for the 2nd in (blue cross) and silver -0.64% for the all in ( silver -0.64% cross).
The difference is this indicator is dynamic and depends on the actual price, the first indicator relay only on the price of the candles before, this indicator gives you the info based in the actual price.
Also the Title was updated
Thanks to Travis and Hanaan for their great work!
//Tip Jar for the Author:
//ETH/ERC20 wallet: 0xb01159a43cc4cc11d9751ae12c340b5dd493ac35
//BTC: 1AnaZMNRJWPtkLC6NQvgBzyqXBnL3DXEa6
//BCC: 1AnaZMNRJWPtkLC6NQvgBzyqXBnL3DXEa6
//LTC: LZwzgQRezaYHpae9c8ZSWYHyheadtyutqA

Macro Trend Confirmation by ActualEquation v1Red = Bear trend
Green = Bull trend
This analyzes the macro trend.
Don't use it on small timeframes.
Color flips are delayed.
This is mainly used to confirm trends instead of a preemptive indicator.
MAKE SURE TO OVERLAY THIS INDICATOR OVER EITHER YOUR CHART OR RSI.
WITHIN THE EXAMPLE. IT IS OVERLAYED ON THE RSI.