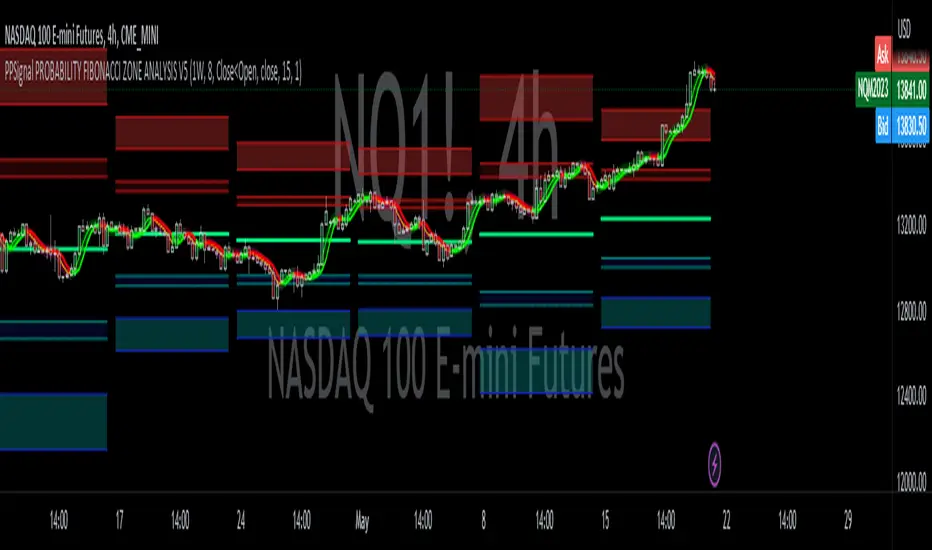
PPSignal - Trend OverlayPpsignal trend overlay is based in macd projection 21 34 13 period on the chart price or overlay.
Kripto

Crypto Low Frequency Trader [ALERTS] - NO REPAINTLow Frequency Trading Signals - Safe to trade with low leverage leverage and make a retirement fund.
Absolutely NO REPAINT.
Very conservative approach.
Works best on 1H chart.
This is the alerts indicator, check my profile for the strategy with backtest.
This Level of Strategy, will not be free. PM for access - Monthly Subscription.

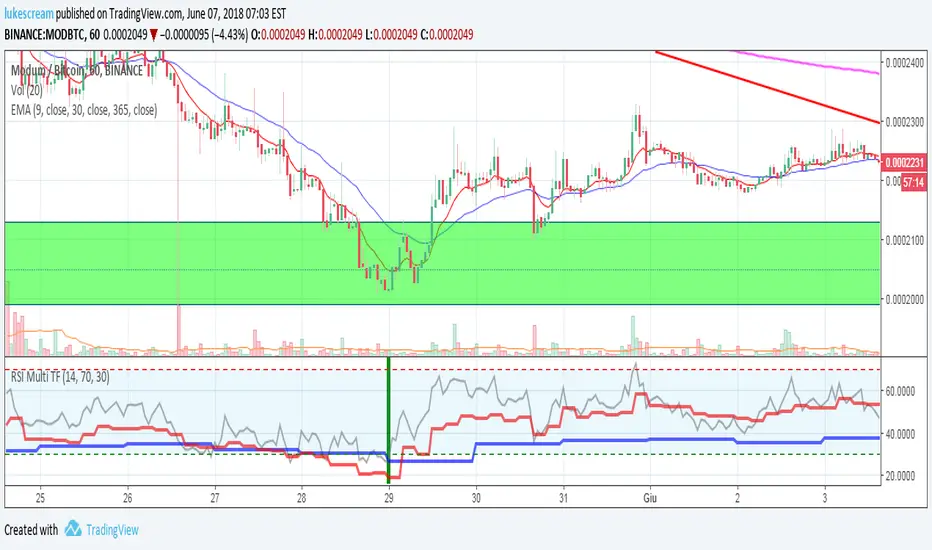
RSI Multi Time Frame - Spot Panic Sell Moments and profit!Union of three RSI indicators: 1h, 4h and daily. In order to show 1h RSI, you have to set it as active time frame on the chart.
Purpose: spot "triple oversold" moments, where all the three RSI are under the threshold, which is 30 by default but editable.
Target Market: Cryptocurrencies. Didn't try it on other ones, may work as well. Fits Crypto well as, by experience, I can tell it usually doesn't stay oversold for long.
When the market panics and triple oversold occurs, the spot is highlighted by a green vertical bar on the indicator.
The indicator highlights triple overbought conditions as well (usually indicating strong FOMO), but I usually don't use it as a signal.
I suggest to edit the oversold threshold in order to make it fit the coin you're studying, minimizing false positives.
Special thanks to Heavy91, a Discord user, for inspiring me in this indicator.
Any editing proposal is welcome!
I reposted this script, as the first time I wrote it in Italian. Sorry for that.
Auto Support & ResistanceAutomated Support & Resistance Lines
Save yourself some time by taking away the need to manually draw your horizontal S&R lines on each and every currency pair you are analyzing!
Support & Resistance plays a big part in any traders technical analysis, so why not automate it? Spend less time on TA with this handy script.
Trial Access
Send me a PM if you would like to try this out for 24 hours
Full Time Access
Access to this and all of our other indicators can be gained by becoming a CryptoProTools member

JackBot Scalper V5.4 Who
I am Jack Donaghy, a crypto trader and wealth strategist at an international asset management firm. I have traded billions in assets for clients and have grown a portfolio of personal assets by nearly 2200% within the last 1.5 years from trading. I originally invested in cryptocurrencies in November of 2016 and been catching waves ever since. This bot is for those interested in scalping methods.
What
Jackbot Pro Scalper is scalping study for bitcoin that operates on small timeframes. It has a 60-70% success rate and operates with the goal of maximizing gains while minimizing losses. This bot works well with leveraged strategies as pursues both long and short positions. While I primarily use it on BitMex, I have seen good success on Bitfinex.
When
5-30 minute charts, longer time frames can work but have not been successful enough to warrant publishing. Best results have come from 13 and 17-minute timeframes.
How
The bot works by 1. Defining its entry point. 2. Defining a take profit 3. Defining a stop loss. The magic of the bot is that it will not close a trade at the take profit, if volume and price are increasing, it will hold the exit until another indicator determines a reversal of the trend. More than that would ruin the logic so you will just have to see for yourself.
To Trade
Large Spikes = Entries (Green = Long, Red = Short)
Small Spikes = Take Profit (Green = Long Exit, Red = Short Exit)
Medium Spikes = Stop Loss (Purple = Long SL, Yellow = Short SL)
Previous Results
Backtested, this bot shows that with 1 Bitcoin (unleveraged) you can make about 10K in a 1.5 month period. My personal experience was trading a test amount of bitcoin on a particularly good run at 25x leverage using 25% of a test portfolio It went from 0.015 bitcoin to 0.091 within 10 days. See ibb.co
Disclaimer: This strategy is by no means perfect and not every trade will be a winner. Previously results show with a 25x leveraged position, the losses are ~20% before it will cut off the trade, however, the gains can be 40%+ (As the bot continues to run in certain conditions, it will often pick up major moves and hold them for longer.) It can have bad runs and a slew of poor entries, especially in tight volatile ranges.
PLEASE NOTE: This strategy can struggle with chop following major moves, if you are manually entering, consider other market conditions before entry if the price is in a tight range.

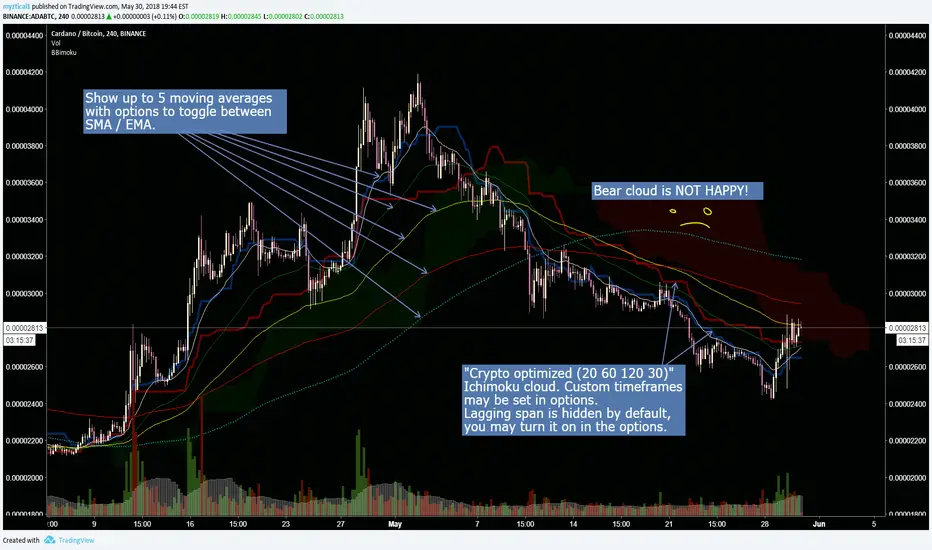
Crypto optimized Ichimoku and 5 variable SMA / EMAThis script has the option for showing up to 5 moving averages with options to toggle between SMA / EMA. Also includes crypto optimized Ichimoku cloud.
********This script was pieced together from various other's contributions from this site, and I cannot remember who the original authors are*******
Im just combining them to help others with free accounts and limited indicator availability like myself.
I hope this can help someone! Thank you and enjoy.

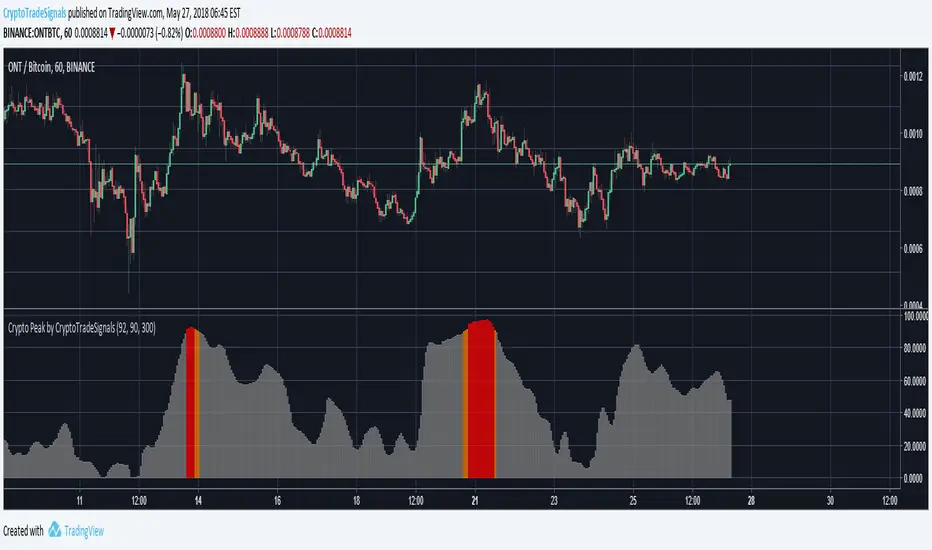
Crypto Peak by CryptoTradeSignalsRelease Notes:
1. AUTOMATED ALERTS: Staring at your phone all day? Get "Crypto Peak" alerts via email or via SMS (requires TradingView PRO Subscription).
2. CRYPTO PEAK SIGNAL: Not sure if a crypto has reached it’s “high point”? Identify the top of the market with this trading signal. When used in combination with the “Crypto Bottom Signal”, identifying the best points to “buy in” now becomes possible.
>>Get access to our Crypto Trading Indicators by visiting our website (please go to my main profile page or check the my signature)<<
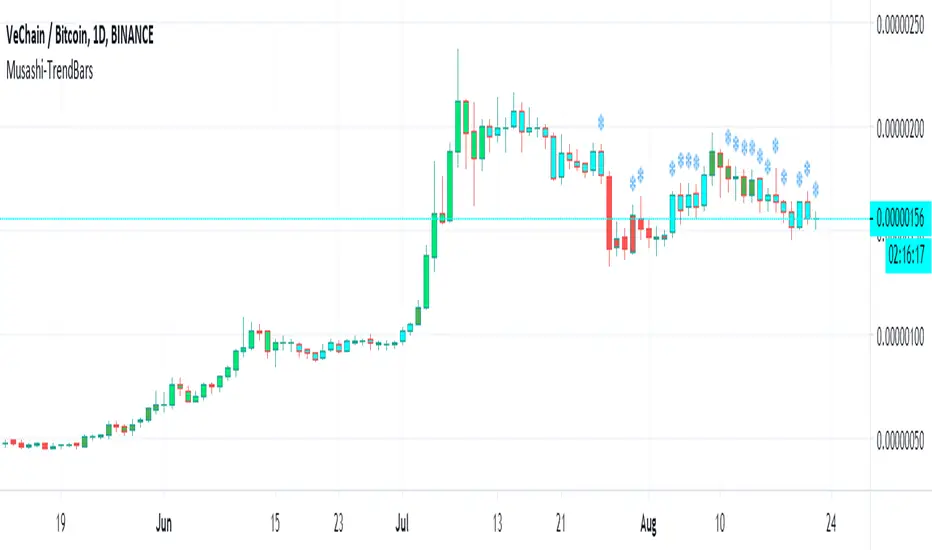
Musashi-TrendBarsThis is a script that has a unique approach to trending. This offers a multi-phase concept of trending, which is shown by a multitude of colors. This non-repainting indicator will predict the phases of trend change and progression. This script is under research at this point, and is considered an alpha version.
LEGAL STUFF:
Risk Disclosure
Futures , forex, stock, crypto and derivative trading contains substantial risk and is not for every investor. An investor could potentially lose all or more than the initial investment. Risk capital is money that can be lost without jeopardizing ones’ financial security or life style. Only risk capital should be used for trading and only those with sufficient risk capital should consider trading. Past performance is not necessarily indicative of future results
Hypothetical Performance Disclosure
Hypothetical performance results have many inherent limitations, some of which are described below. no representation is being made that any account will or is likely to achieve profits or losses similar to those shown; in fact, there are frequently sharp differences between hypothetical performance results and the actual results subsequently achieved by any particular trading program. One of the limitations of hypothetical performance results is that they are generally prepared with the benefit of hindsight. In addition, hypothetical trading does not involve financial risk, and no hypothetical trading record can completely account for the impact of financial risk of actual trading. for example, the ability to withstand losses or to adhere to a particular trading program in spite of trading losses are material points which can also adversely affect actual trading results. There are numerous other factors related to the markets in general or to the implementation of any specific trading program which cannot be fully accounted for in the preparation of hypothetical performance results and all which can adversely affect trading results
Nefitty Cryptowave: Visual Control Lite 90DBest used under the influence of Com Truise
The wave will careen off the top and bottom of the channel. Use it to anticipate possible upcoming support and resistance lines. The midline is usually purple, and turns red when it is higher than the channel ceiling, 45 days back. Intended for daily timeframe only.
This indicator requires additional research:
Are there any leading indicators before the wave smashes into an edge?
How do we read it when it begins tightly hugging one extreme?
Can we use the midway line to predict changes?
That's it for now.
Godspeed, soldier.
- nefitty
Find me on r/cryptocurrency Discord

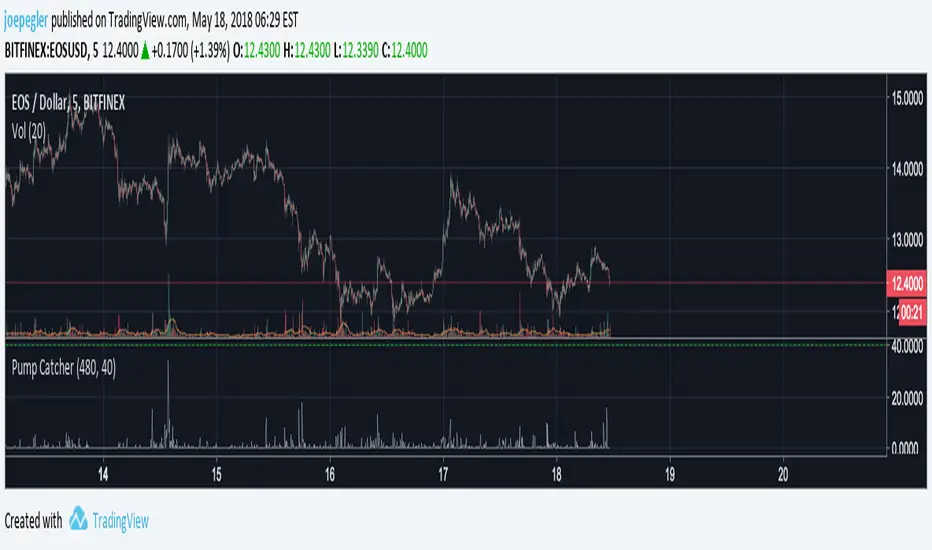
Pump CatcherThis indicator attempts to detect moments of abnormal and accelerating increase in volume. Because pumps happen over short time frames, this script is potentially better used on smaller timeframes (1 - 15 minutes). It takes two inputs: The length of the lookback for the volume rate of change (vroc) calculation (default=20), and The threshold over which a pump is determined to have happened (0-100, default=50). The vroc has been normalised to a result between 0 (no rate of change) and 100 (maximum rate of change the asset has ever undergone to date).
TD/VixFix/VolatilityStop/Momentum/WeisWave IndicatorsA nice collection of Buy/Sell indicators.
Send me some love if you find this useful:
btc: 1GcWRvkrLwmv2sD8nHYvJ7ZWf4qB1tQ1r9
eth: 0x3061513011c071d9ced8a375e51004aba26410e8
etc: 0xc7ad9ad4d6b0008a1be897666e7f643e7259a509
ltc: LY5pxGhRvNvGJcrb4pnTyH2A2hN1DPjLqt
xvg: DKcou5NyfvVzqLjjDo1eFTNaZuThdZaVUJ
zrx: 0x3061513011c071d9ced8a375e51004aba26410e8
Many thanks to:
glaz, ChrisMoody, admin, LazyBear

Bottom Finder 2.1Release 2.1 Final!
Bottom Finder is an automated cryptocurrency signals and analysis tool which uses a complex algorithm involving multiple indicators, trends, and cross-overs including proprietary formulas developed in-house to predict the bottom price of cryptocurrencies. It also works well on stocks, gold, oil and forex!

RISHI INDICATOR by KUJIRA v.2The RISHI indicator is a volume motivation indicator. It's calculations are based on volume moving averages and price action in relation to volume.

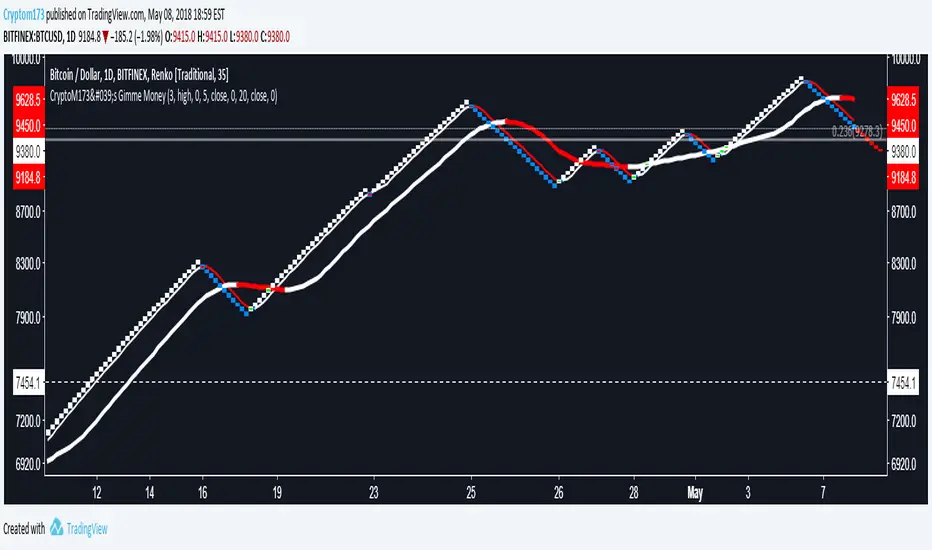
CryptoM173's Gimme MoneyLatest version. Nobody gave me feedback and managing requests to add people became a PITA. Enjoy.
I like money, you like money, this set up has the potential to make a LOT of it. That being said, I do NOTmake any warranties of this making you money, nor do I guarantee you will NOT lose money. In the end, you're the one configuring it and interpreting the results. Providing that you DO set it up correctly and it makes you obscene amounts of money, donations are always welcome (addresses below).
Before you start, it's probably you read EVERYTHING below.
You'll have to do some tweaking of the MA's to find a strat that best suits your needs. It is an indicator you're welcome to use to assist in your trading decisions. I made this script for renko charts and trading bitcoin -1.64% because the standard strat wasn't working out. if you find you're getting a lot of consecutive colored bars or crosses on Renko, you may need to switch from ATR 14 to something like Traditional 50. You will need to adjust the "box value" for traditional renko to fit the asset you're working with, on the time frame you're trading on. Smaller values (i.e. on bitcoin -1.64% I use a box value of 50 on 4hr and 1D with absurd success) but you need to make sure they're not too small, otherwise small moves may appear larger than they are, resulting in a bunch of break-even trades. If you're going to be trading cryptocurrency, it's easiest to switch back to ATR14 to get an idea of the Average Trading range to have a reference point to start from trading btc -1.64% (i.e .000034 rather than 50).
It's a great tool if you're looking to carry both swap and futs positions and keep an eye on the short term swap opportunities while monitoring the status of your futs position and help decide whether or not to close a long at a correction or not and while this strategy has been most effective for me with Renko bars, it's been very useful for monitoring futs positions on traditional charts.
For access, feel free to DM -0.34% me on twitter, @CryptoM173
If you're the generous type, feel free to donate Bitcoin to: 3BMEXWz6Es7iLdi9zAyMWWHHZPNbMKPqrV
PA Patterns Multi CRYPTOThis is the version for cryptocurrencies of my scanner for forex majors
The scope of this script is to work as a scanner of pin bars and engulfing candles of the crypto market.
Best to use with time frames Daily and 4h, lower timeframes gives too many results and may be noisy without trend filter.
Next improvement will be:
- To display in a better way the results, but actually you have to zoom in and out if some results are overlapping.
As the other one, this has alerts and trend filter.
If you like it, please leave a comment and follow me.
Thank you.


Crypto Market Maker w/ AlertsUltimate Trading Tool. Simple af 1.07% 1.07% . Follow signals, chart if you want to confirm.
Takes only trades with proper risk to reward ratio.
At times calls absolute top and bottom.
Can be used on ALTs as well.
Based on Neural Networks.
Can be used on 60m,30m,15m,5m, 3m 0.32% 0.32% 0.32% -0.88% - As this is basically a SCALPER. (use with leverage)
Works best in my experience on 15m.
This is the indicator for alerts, check my profile for the strategy with backtest.
Alerts -> Crypto Market Maker -> Plot -> Long/Short - Once Per Bar Close
This Level of Strategy, will not be free. PM for access - Monthly Subscription.

uncharted1 - Momentous v2Study using RSI, StochRSI, and MFI indicators. Mix and match to find your best entries and exits using these indicator combinations. All the switches are in the Inputs page so have fun with it. Alert setups are easy. I created this primarily for crypto currencies and long positions. Perfect for users of AutoView. Backtest component by @pbergden included.
Alert conditions are easy enough to set up. Just use 'Buy Alert' and 'Sell Alert'.

Bottom finder v8.1.1New version of Bottom Finder with additional confirmations to improve reliability in finding the bottom.

CryptoWave ProProps to Lazy Bear for his WaveTrend Oscillator which I've used as the basis of this indicator.
Whats changed?
Tweaked values for crypto markets - Working well on the 1h chart but can be used on essentially any time frame.
- Added visual buy sell signals
- Colored Arrow
- Bar Colors On Chart
Added alert syntax to easy TradingView alerts
Access given to all CryptoProTools members

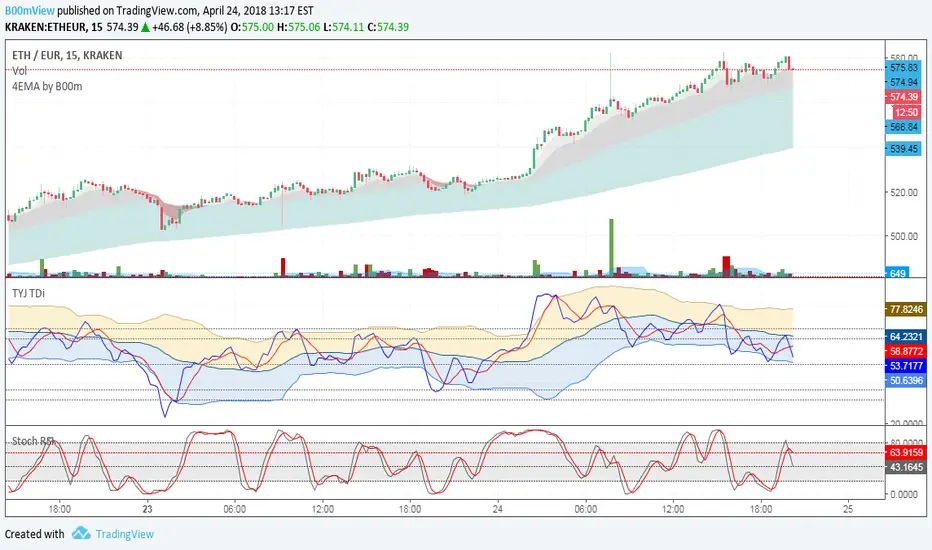
Four Exponential Moving Averages by B00m2tM00nAfter little research I couldn't find a simple 4EMA ribbon that bled when necessary.
Admittedly, nothing new here, use where you think appropriate.
Suggestions welcome!